
Exhibit 99.1
ServisFirst Bancshares, Inc. NYSE: SFBS August 2025
Forward - Looking Statements ▪ Statements in this presentation that are not historical facts, including, but not limited to, statements concerning future operations, results or performance, are hereby identified as "forward - looking statements" for the purpose of the safe harbor provided by Section 21 E of the Securities Exchange Act of 1934 and Section 27 A of the Securities Act of 1933 . The words "believe," "expect," "anticipate," "project," “plan,” “intend,” “will,” “could,” “would,” “might” and similar expressions often signify forward - looking statements . Such statements involve inherent risks and uncertainties . ServisFirst Bancshares, Inc . cautions that such forward - looking statements, wherever they occur in this presentation or in other statements attributable to ServisFirst Bancshares, Inc . , are necessarily estimates reflecting the judgment of ServisFirst Bancshares, Inc . ’s senior management and involve risks and uncertainties that could cause actual results to differ materially from those suggested by the forward - looking statements . Such forward - looking statements should, therefore, be considered in light of various factors that could affect the accuracy of such forward - looking statements, including, but not limited to : general economic conditions, especially in the credit markets and in the Southeast ; the performance of the capital markets ; changes in interest rates, yield curves and interest rate spread relationships ; changes in accounting and tax principles, policies or guidelines ; changes in legislation or regulatory requirements ; changes as a result of our reclassification as a large financial institution by the FDIC ; changes in our loan portfolio and the deposit base ; possible changes in laws and regulations and governmental monetary and fiscal policies, including, but not limited to, the Federal Reserve policies in connection with continued or re - emerging inflationary pressures and the ability of the U . S . Congress to increase the U . S . statutory debt limit as needed ; computer hacking or cyber - attacks resulting in unauthorized access to confidential or proprietary information ; substantial, unexpected or prolonged changes in the level or cost of liquidity ; the cost and other effects of legal and administrative cases and similar contingencies ; possible changes in the creditworthiness of customers and the possible impairment of the collectability of loans and the value of collateral ; the effect of natural disasters, such as hurricanes and tornados, in our geographic markets ; and increased competition from both banks and non - bank financial institutions . For discussion of these and other risks that may cause actual results to differ from expectations, please refer to “Cautionary Note Regarding Forward - looking Statements” and “Risk Factors” in our most recent Annual Report on Form 10 - K, in our Quarterly Reports on Form 10 - Q for fiscal year 2024 , and our other SEC filings . If one or more of the assumption forming the basis of our forward - looking information and statements proves incorrect, then our actual results, performance or achievements could differ materially from those expressed in, or implied by, forward - looking information and statements contained herein . Accordingly, you should not place undue reliance on any forward - looking statements, which speak only as of the date made . ServisFirst Bancshares, Inc . assumes no obligation to update or revise any forward - looking statements that are made from time to time . ▪ Non - GAAP Financial Measures - This presentation includes non - GAAP financial measures . Information about any such non - GAAP financial measures, including a reconciliation of those measures to GAAP, can be found in the presentation . 2

ServisFirst at a Glance Organic Growth Story ▪ Single bank BHC founded in Birmingham, Alabama ▪ Organic asset growth since the bank was founded in 2005 (1) : 24% CAGR High - Performing Metropolitan Commercial Bank ▪ Total Assets (2) : $17.38 billion ▪ Stockholders’ Equity (2) : $1.72 billion High Growth Coupled with Pristine Credit Metrics ▪ Gross Loans CAGR (4) : 14% ▪ Total Deposits CAGR (4) : 15% ▪ Net Income for Common CAGR (4) : 16% ▪ Diluted EPS CAGR (4) : 15% ▪ ROAA (3) : 1.42% ▪ Efficiency Ratio (3) : 34.22% 1) 19 - year compounded annual growth rate (CAGR) calculated from 12/31/05 – 12/31/2024; excludes the impact of ServisFirst’s one acquisition in 2015 – approximately $200 million 2) As of June 30, 2025 3) For six months ended June 30, 2025 4) 10 - year compounded annual growth rate (CAGR) calculated from 12/31/14 – 12/31/24 ▪ NPAs / assets (2) : 0.42% ▪ NPLs / loans (2) : 0.55% 3
Our Business Strategy ▪ Simple business model – Loans and deposits are primary drivers, not ancillary services ▪ Limited branch footprint – Technology provides efficiency ▪ Big bank products and bankers – With the style of service and delivery of a community bank ▪ Core deposit focus coupled with C&I lending emphasis ▪ Scalable, decentralized business model – Regional CEOs drive revenue ▪ Opportunistic expansion, attractive geographies – Teams of the best bankers in each metropolitan market ▪ Disciplined growth company that sets high standards for performance 4
Opportunistic Expansion ▪ Identify great bankers in attractive markets – Focus on people as opposed to places – Target minimum of $300 million in assets within 3 years – Best bankers in growing markets ▪ Market strategies – Regional CEOs execute simple business model – Back office support and risk management infrastructure – Non - legal board of directors comprised of key business people – Provide professional banking services to mid - market commercial customers that have been neglected or pushed down to branch personnel by national and other larger regional banks ▪ Opportunistic future expansion – Southern markets, metropolitan focus – Draw on expertise of industry contacts 5
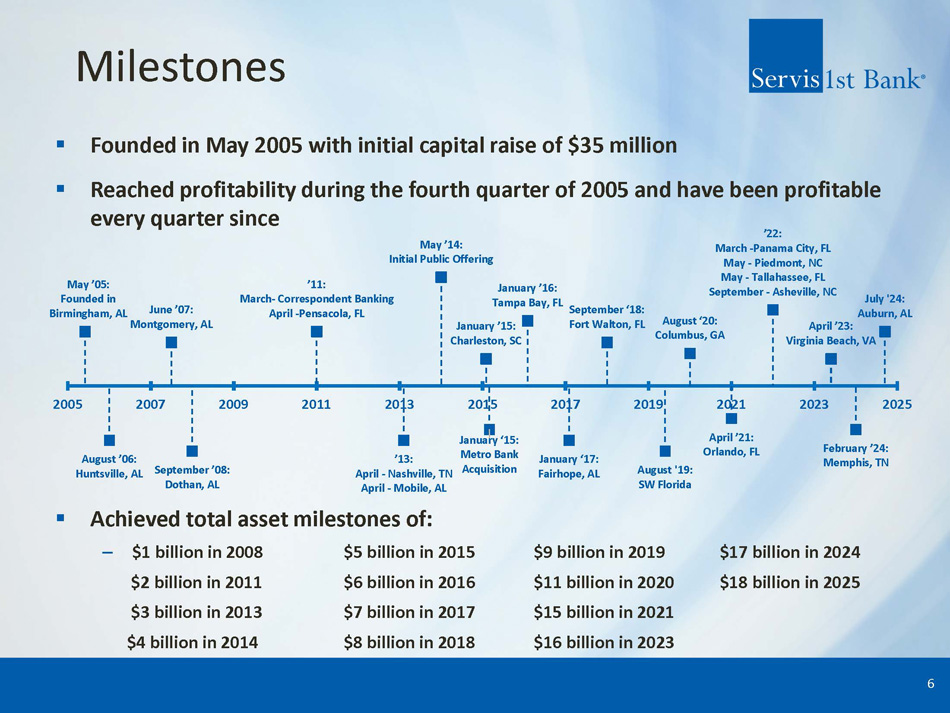
Milestones 6 ▪ Founded in May 2005 with initial capital raise of $35 million ▪ Reached profitability during the fourth quarter of 2005 and have been profitable every quarter since ▪ Achieved total asset milestones of: – $1 billion in 2008 $5 billion in 2015 $9 billion in 2019 $17 billion in 2024 $2 billion in 2011 $6 billion in 2016 $11 billion in 2020 $18 billion in 2025 $3 billion in 2013 $7 billion in 2017 $15 billion in 2021 $4 billion in 2014 $8 billion in 2018 $16 billion in 2023 ’13: April - Nashville, TN April - Mobile, AL January ‘15: Metro Bank Acquisition August ’06: Huntsville, AL September ’08: Dothan, AL January ‘17: Fairhope, AL August '19: SW Florida April ’21: Orlando, FL February ’24: Memphis, TN May ’05: Founded in Birmingham, AL June ’07: Montgomery, AL ’11: March - Correspondent Banking April - Pensacola, FL May ’14: Initial Public Offering January ’15: Charleston, SC January ’16: Tampa Bay, FL September ‘18: Fort Walton, FL August ‘20: Columbus, GA ’22: March - Panama City, FL May - Piedmont, NC May - Tallahassee, FL September - Asheville, NC April ’23: Virginia Beach, VA July '24: Auburn, AL 2005 2007 2009 2011 2013 2015 2017 2019 2021 2023 2025

Consistently Building Shareholder Value ▪ Tangible Book Value has increased year/year by a minimum of 10% every year since the bank opened in 2005 (19 - year CAGR (1) = 17%) ▪ Stock price has increased by more than 5,000% (2) since initial capital raise in 2005 (19 - year CAGR (1) = 23%) ▪ Dividend has increased each year since initial public offering in 2014 7 5 - year (3) CAGR = 15% 5 - year (3) CAGR = 14% Annual Dividend Per Share Tangible Book Value Per Share 1) 19 – year CAGR = 12/31/2005 – 12/31/24 2) Split adjusted (6 - for - 1) stock price for 2005 initial capital raise was $1.67 per share. Closing stock price on 12/31/24 was $8 4.74 3) 5 – year CAGR = 12/31/2019 – 12/31/24 0.60 0.70 0.80 0.92 1.12 1.20 1.34 2019 2020 2021 2022 2023 2024 6/30/2025 15.45 18.15 20.99 23.64 26.20 29.38 31.27 2019 2020 2021 2022 2023 2024 6/30/2025
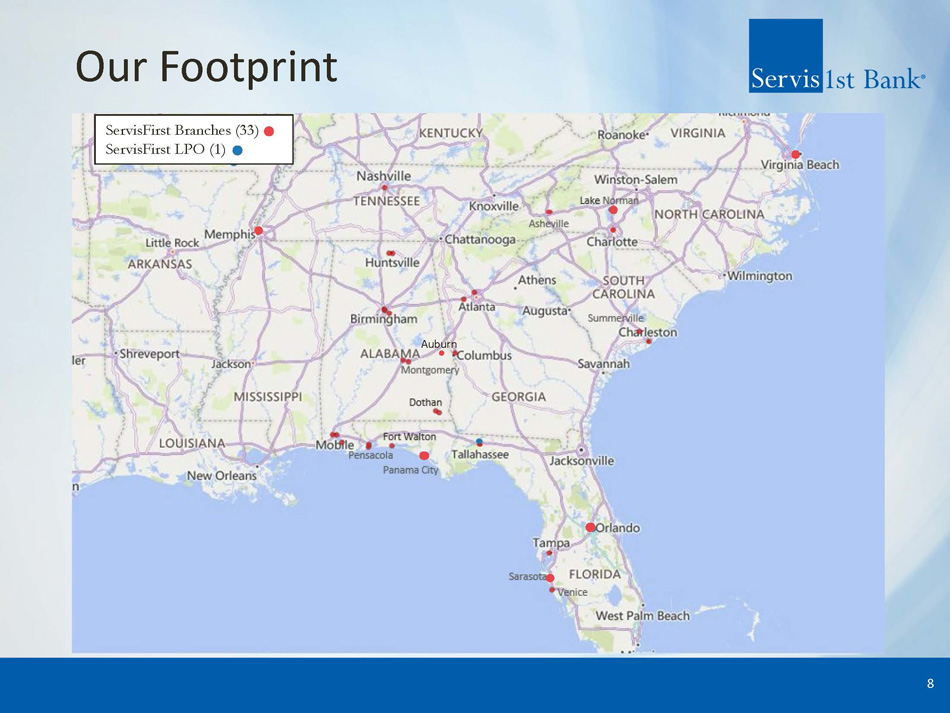
Our Footprint 8 ServisFirst Branches (3 3 ) ServisFirst LPO (1) Auburn
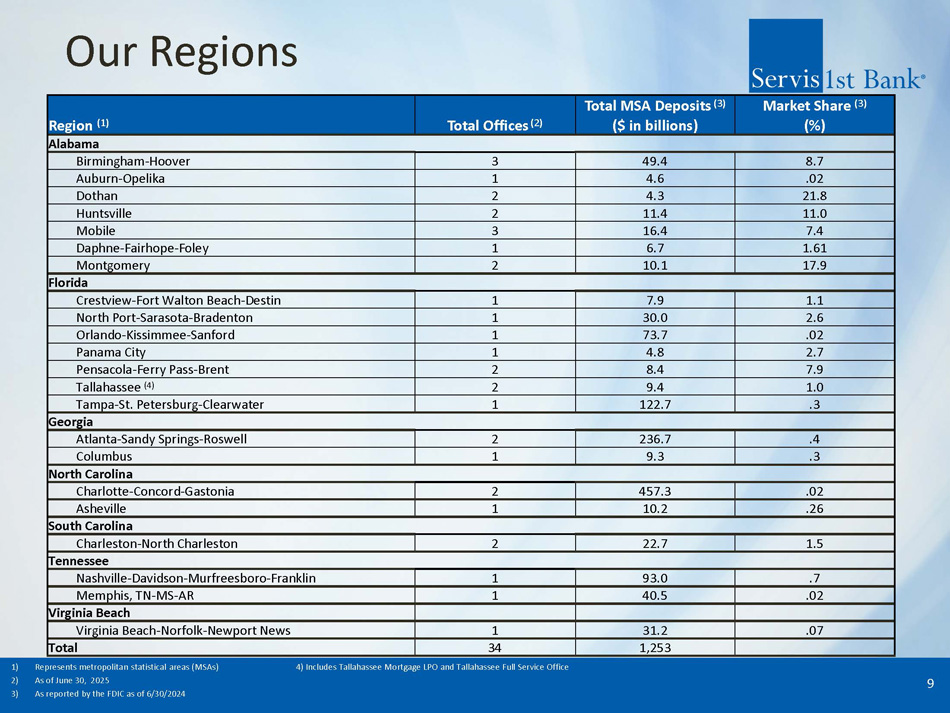
Our Regions 9 1) Represents metropolitan statistical areas (MSAs) 4) Includes Tallahassee Mortgage LPO and Tallahassee Full Service Office 2) As of June 30, 2025 3) As reported by the FDIC as of 6/30/2024 Market Share (3) Total MSA Deposits (3) Total Offices (2) Region (1) (%) ($ in billions ) Alabama 8.7 49.4 3 Birmingham - Hoover .02 4.6 1 Auburn - Opelika 21.8 4.3 2 Dothan 11.0 11.4 2 Huntsville 7.4 16.4 3 Mobile 1.61 6.7 1 Daphne - Fairhope - Foley 17.9 10.1 2 Montgomery Florida 1.1 7.9 1 Crestview - Fort Walton Beach - Destin 2.6 30.0 1 North Port - Sarasota - Bradenton .02 73.7 1 Orlando - Kissimmee - Sanford 2.7 4.8 1 Panama City 7.9 8.4 2 Pensacola - Ferry Pass - Brent 1.0 9.4 2 Tallahassee (4) .3 122.7 1 Tampa - St . Petersburg - Clearwater Georgia .4 236.7 2 Atlanta - Sandy Springs - Roswell .3 9.3 1 Columbus North Carolina .02 457.3 2 Charlotte - Concord - Gastonia .26 10.2 1 Asheville South Carolina 1.5 22.7 2 Charleston - North Charleston Tennessee .7 93.0 1 Nashville - Davidson - Murfreesboro - Franklin .02 40.5 1 Memphis, TN - MS - AR Virginia Beach .07 31.2 1 Virginia Beach - Norfolk - Newport News 1,253 34 Total
Our Business Model ▪ “Loan making and deposit taking” – Traditional commercial banking services – No emphasis on non - traditional business lines ▪ Culture of cost control – “Branch light,” with $420 million average deposits per banking center – Leverage technology and centralized infrastructure – Headcount focused on production and risk management – Key products; including remote deposit capture (approximately 2/3 of checks deposited are via remote deposit capture and mobile deposit), cash management, remote currency manager – Outsource selected functions ▪ C&I and Owner Occupied CRE lending expertise – 42% of gross loans – Target customers: privately held businesses $2 to $250 million in annual sales, professionals, affluent consumers 10
Scalable , Decentralized Structure ▪ Local decision - making – Emphasize local decision - making to drive customer revenue – Centralized, uniform risk management and support – Conservative local lending authorities, covers most lending decisions – Geographic organizational structure (as opposed to line of business structure) ▪ Regional CEOs empowered and held accountable – Utilize stock based compensation to align goals ▪ Top - down sales culture – Senior management actively involved in customer acquisition 11
Capacity For Growth ▪ Potential for significant growth in both loan and deposit book size of current calling officers – Approximately 63% of the bank’s loan book is managed by approximately 20% of the bank’s calling officers and approximately 64% of the bank’s deposit book is managed by approximately 20% of the bank’s calling officers – Average outstanding loan balances per officer as of 6/30/25 was $63 million and average deposit balances per officer was $71 million – Strive for a minimum of $75 million in outstanding loans and deposits for every calling officer, resulting in approximately $5.3 billion in potential additional loan balances and $5.3 billion in potential additional deposits balances – Approximately 30% of calling officers manage loan and/or deposit books in excess of $75 million ▪ Focused on identifying motivated, customer service oriented bankers – Regularly meet with potential new bankers – Sustainable growth achieved through exceptional customer service which builds client loyalty and leads to customer referrals 12
Risk Management ▪ Manage risk centrally while delivering products and services by each Regional Bank ▪ Centralized/Consistent: operations, compliance, risk, accounting, audit, information technology, and credit administration ▪ Investing resources in Risk Management Group – Invested in new technologies (ERM, BSA, information security, credit administration) – Enhanced staff and resources for risk, compliance, BSA, and credit administration – Increased scope of internal audits and independent loan reviews ▪ Management committees identify, monitor, and mitigate risks across enterprise ▪ Healthy Regulatory relations ▪ Independent loan portfolio stress testing performed regularly ▪ Correspondent Banking Division provides additional stable funding source 13
Risk Management Credit Process ▪ Lending focuses on middle market clients with Regional CEO and credit officers approving secured loan relationship up to $5MM; relationships greater than $5MM are approved by the CCO and/or members of executive management ▪ Centralized monitoring of ABL relationships greater than $2MM and centralized monitoring of commercial construction projects greater than $3MM ▪ Independent loan review examines 35 - 40% of the committed balances annually to affirm risk rating accuracy and proper documentation ▪ The Bank does not lead any Share National Credits (SNCs); the Bank does participate in 12 relationships that are classified as SNCs with current balances of $96MM as of 6/30/25 ▪ Approximately 87% of the Bank’s CRE loans are located in Bank’s seven state footprint ▪ The top three industry exposures as of 6/30/25 are: Real Estate (36%), Service Industry (13%) and Retail (8%). – The top three C&I and C&I OOCRE portfolio industries are: Retail (17%), Manufacturing (10%), and Health Care (9%). C&I and C&I OOCRE loans account for 40% of the total loan portfolio 14
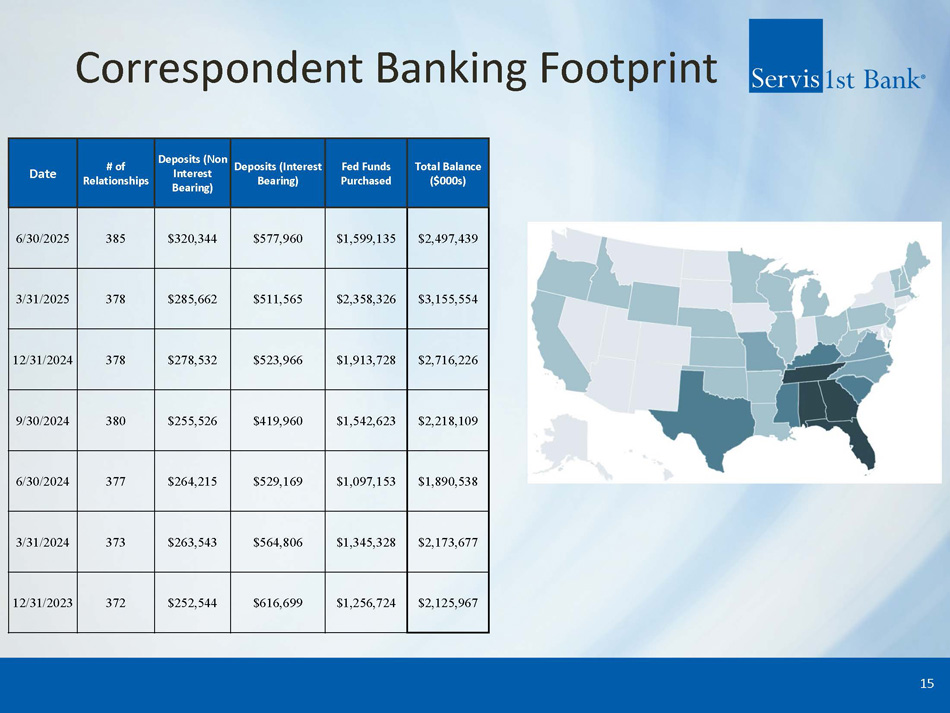
Correspondent Banking Footprint 15 Total Balance ($000s) Fed Funds Purchased Deposits (Interest Bearing) Deposits (Non Interest Bearing) # of Relationships Date $2,497,439 $1,599,135 $577,960 $320,344 385 6/30/2025 $3,155,554 $2,358,326 $511,565 $285,662 378 3/31/2025 $2,716,226 $1,913,728 $523,966 $278,532 378 12/31/2024 $2,218,109 $1,542,623 $419,960 $255,526 380 9/30/2024 $1,890,538 $1,097,153 $529,169 $264,215 377 6/30/2024 $2,173,677 $1,345,328 $564,806 $263,543 373 3/31/2024 $2,125,967 $1,256,724 $616,699 $252,544 372 12/31/2023
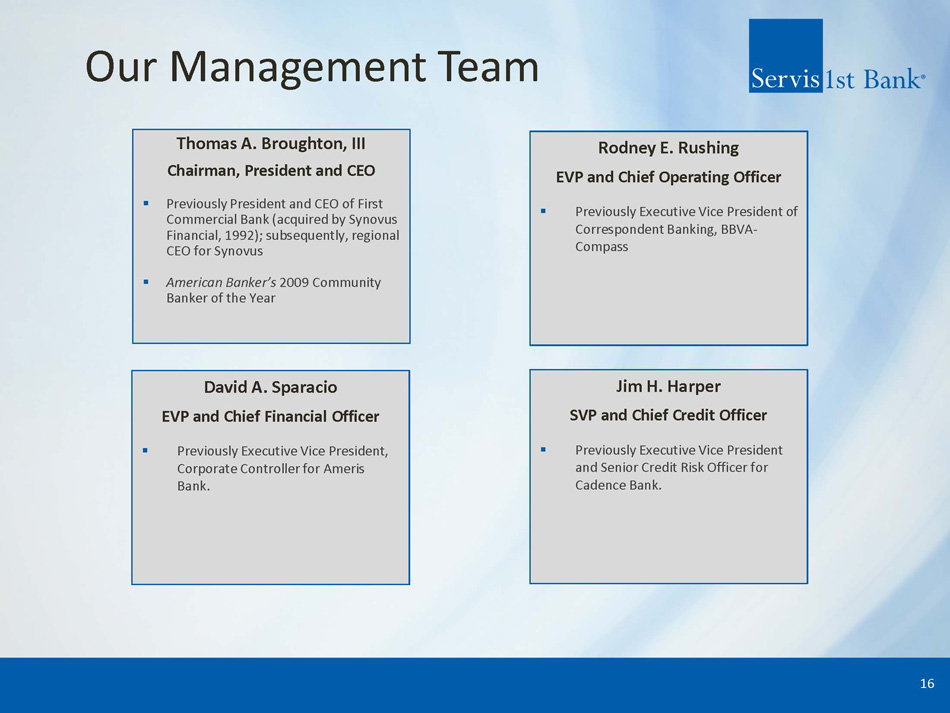
Our Management Team Thomas A. Broughton, III Chairman, President and CEO ▪ Previously President and CEO of First Commercial Bank (acquired by Synovus Financial, 1992); subsequently, regional CEO for Synovus ▪ American Banker’s 2009 Community Banker of the Year David A. Sparacio EVP and Chief Financial Officer ▪ Previously Executive Vice President, Corporate Controller for Ameris Bank. Rodney E. Rushing EVP and Chief Operating Officer ▪ Previously Executive Vice President of Correspondent Banking, BBVA - Compass 16 Jim H. Harper SVP and Chief Credit Officer ▪ Previously Executive Vice President and Senior Credit Risk Officer for Cadence Bank.
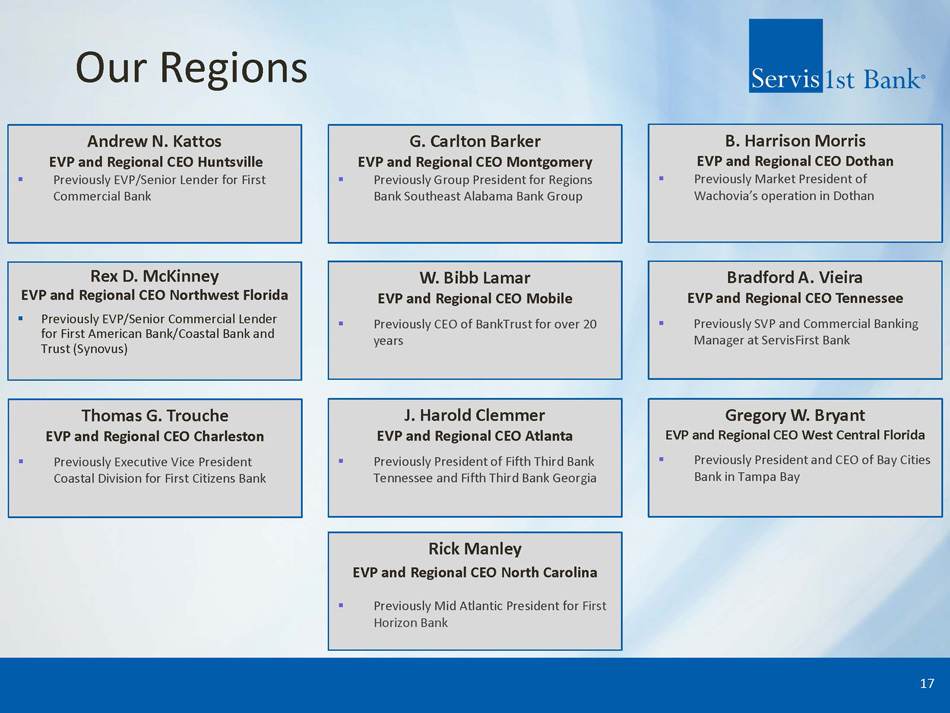
Our Regions Rex D. McKinney EVP and Regional CEO Northwest Florida ▪ Previously EVP/Senior Commercial Lender for First American Bank/Coastal Bank and Trust (Synovus) Andrew N. Kattos EVP and Regional CEO Huntsville ▪ Previously EVP/Senior Lender for First Commercial Bank J. Harold Clemmer EVP and Regional CEO Atlanta ▪ Previously President of Fifth Third Bank Tennessee and Fifth Third Bank Georgia W. Bibb Lamar EVP and Regional CEO Mobile ▪ Previously CEO of BankTrust for over 20 years G. Carlton Barker EVP and Regional CEO Montgomery ▪ Previously Group President for Regions Bank Southeast Alabama Bank Group B. Harrison Morris EVP and Regional CEO Dothan ▪ Previously Market President of Wachovia’s operation in Dothan Gregory W. Bryant EVP and Regional CEO West Central Florida ▪ Previously President and CEO of Bay Cities Bank in Tampa Bay Thomas G. Trouche EVP and Regional CEO Charleston ▪ Previously Executive Vice President Coastal Division for First Citizens Bank Bradford A. Vieira EVP and Regional CEO Tennessee ▪ Previously SVP and Commercial Banking Manager at ServisFirst Bank 17 Rick Manley EVP and Regional CEO North Carolina ▪ Previously Mid Atlantic President for First Horizon Bank

Financial Results
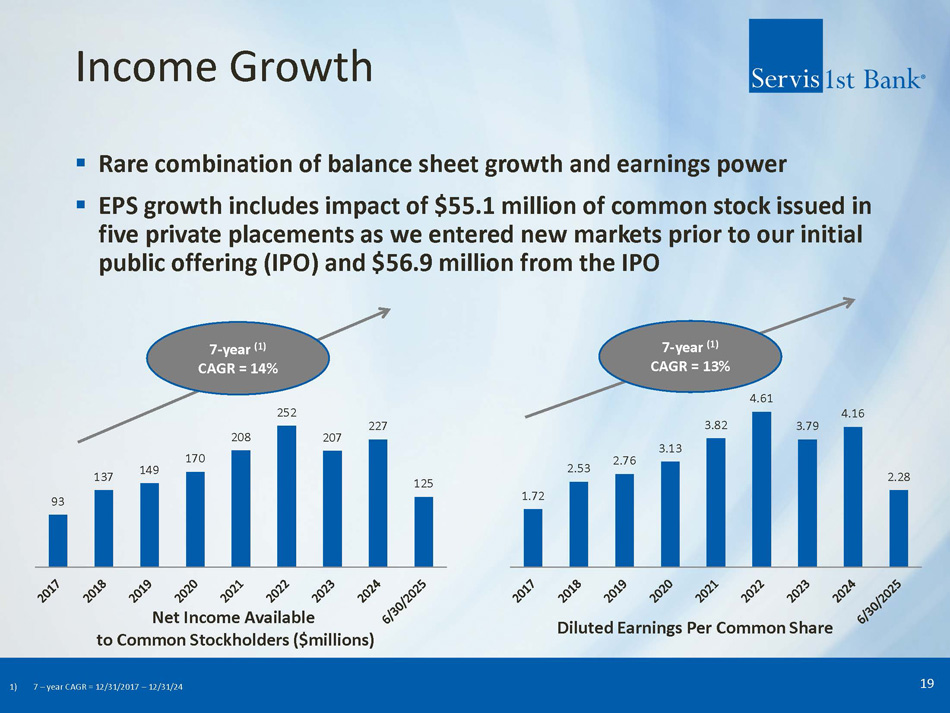
Income Growth ▪ Rare combination of balance sheet growth and earnings power ▪ EPS growth includes impact of $55.1 million of common stock issued in five private placements as we entered new markets prior to our initial public offering (IPO) and $56.9 million from the IPO 19 7 - year (1) CAGR = 14% 7 - year (1) CAGR = 13% Net Income Available to Common Stockholders ($millions) Diluted Earnings Per Common Share 1) 7 – year CAGR = 12/31/2017 – 12/31/24 93 137 149 170 208 252 207 227 125 1.72 2.53 2.76 3.13 3.82 4.61 3.79 4.16 2.28
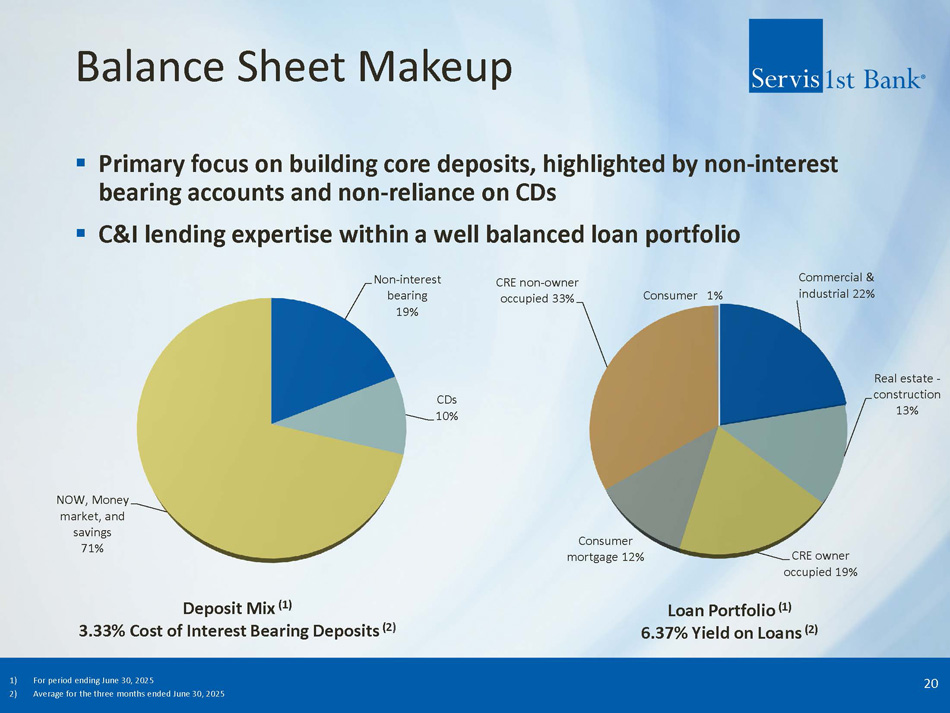
Balance Sheet Makeup ▪ Primary focus on building core deposits, highlighted by non - interest bearing accounts and non - reliance on CDs ▪ C&I lending expertise within a well balanced loan portfolio 20 Deposit Mix (1) 3.33% Cost of Interest Bearing Deposits (2 ) Loan Portfolio (1) 6.37% Yield on Loans (2) 1) For period ending June 30, 2025 2) Average for the three months ended June 30, 2025 Non - interest bearing 19% CDs 10% NOW, Money market, and savings 71% Commercial & industrial 22% Real estate - construction 13% CRE owner occupied 19% Consumer mortgage 12% CRE non - owner occupied 33% Consumer 1%
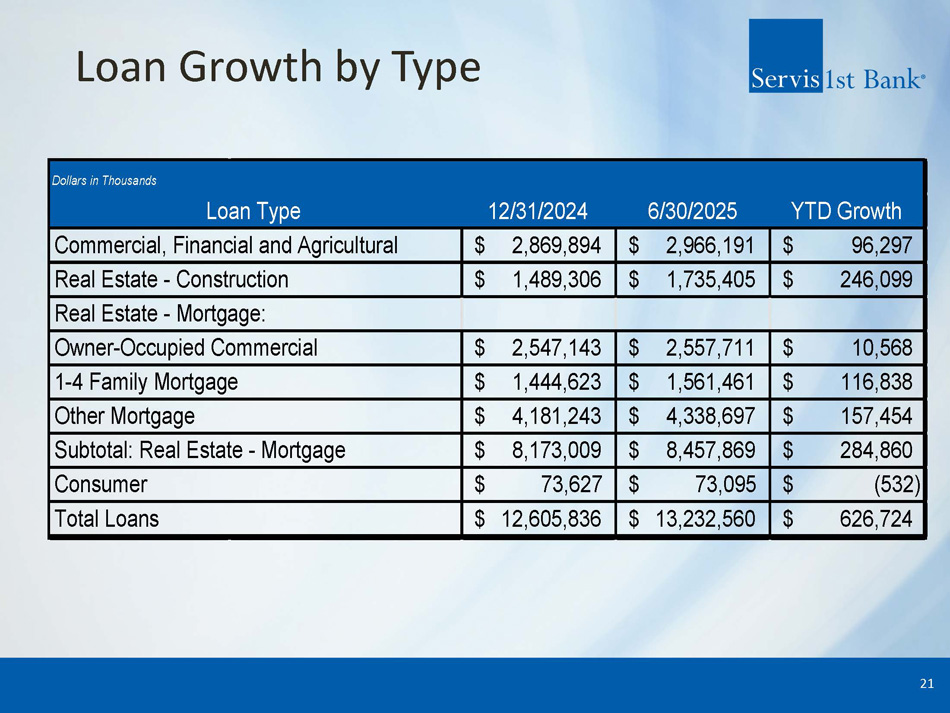
Loan Growth by Type 21 12/31/2024 6/30/2025 2,869,894$ 2,966,191$ 96,297$ 1,489,306$ 1,735,405$ 246,099$ 2,547,143$ 2,557,711$ 10,568$ 1,444,623$ 1,561,461$ 116,838$ 4,181,243$ 4,338,697$ 157,454$ 8,173,009$ 8,457,869$ 284,860$ 73,627$ 73,095$ (532)$ 12,605,836$ 13,232,560$ 626,724$ Total Loans Dollars in Thousands YTD GrowthLoan Type Commercial, Financial and Agricultural Real Estate - Construction Real Estate - Mortgage: Owner-Occupied Commercial 1-4 Family Mortgage Other Mortgage Subtotal: Real Estate - Mortgage Consumer
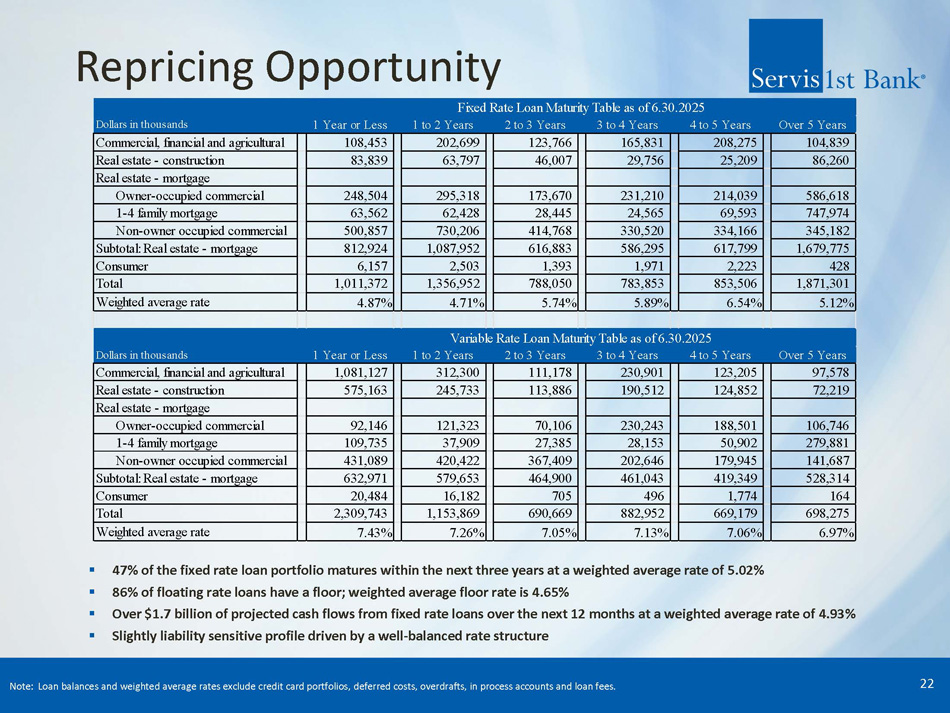
22 Repricing Opportunity ▪ 47% of the fixed rate loan portfolio matures within the next three years at a weighted average rate of 5.02% ▪ 86% of floating rate loans have a floor; weighted average floor rate is 4.65% ▪ Over $1.7 billion of projected cash flows from fixed rate loans over the next 12 months at a weighted average rate of 4.93% ▪ Slightly liability sensitive profile driven by a well - balanced rate structure Note: Loan balances and weighted average rates exclude credit card portfolios, deferred costs, overdrafts, in process accoun ts and loan fees. Dollars in thousands 1 Year or Less 1 to 2 Years 2 to 3 Years 3 to 4 Years 4 to 5 Years Over 5 Years Commercial, financial and agricultural 108,453 202,699 123,766 165,831 208,275 104,839 Real estate - construction 83,839 63,797 46,007 29,756 25,209 86,260 Real estate - mortgage Owner-occupied commercial 248,504 295,318 173,670 231,210 214,039 586,618 1-4 family mortgage 63,562 62,428 28,445 24,565 69,593 747,974 Non-owner occupied commercial 500,857 730,206 414,768 330,520 334,166 345,182 Subtotal: Real estate - mortgage 812,924 1,087,952 616,883 586,295 617,799 1,679,775 Consumer 6,157 2,503 1,393 1,971 2,223 428 Total 1,011,372 1,356,952 788,050 783,853 853,506 1,871,301 Weighted average rate 4.87% 4.71% 5.74% 5.89% 6.54% 5.12% Dollars in thousands 1 Year or Less 1 to 2 Years 2 to 3 Years 3 to 4 Years 4 to 5 Years Over 5 Years Commercial, financial and agricultural 1,081,127 312,300 111,178 230,901 123,205 97,578 Real estate - construction 575,163 245,733 113,886 190,512 124,852 72,219 Real estate - mortgage Owner-occupied commercial 92,146 121,323 70,106 230,243 188,501 106,746 1-4 family mortgage 109,735 37,909 27,385 28,153 50,902 279,881 Non-owner occupied commercial 431,089 420,422 367,409 202,646 179,945 141,687 Subtotal: Real estate - mortgage 632,971 579,653 464,900 461,043 419,349 528,314 Consumer 20,484 16,182 705 496 1,774 164 Total 2,309,743 1,153,869 690,669 882,952 669,179 698,275 Weighted average rate 7.43% 7.26% 7.05% 7.13% 7.06% 6.97% Fixed Rate Loan Maturity Table as of 6.30.2025 Variable Rate Loan Maturity Table as of 6.30.2025
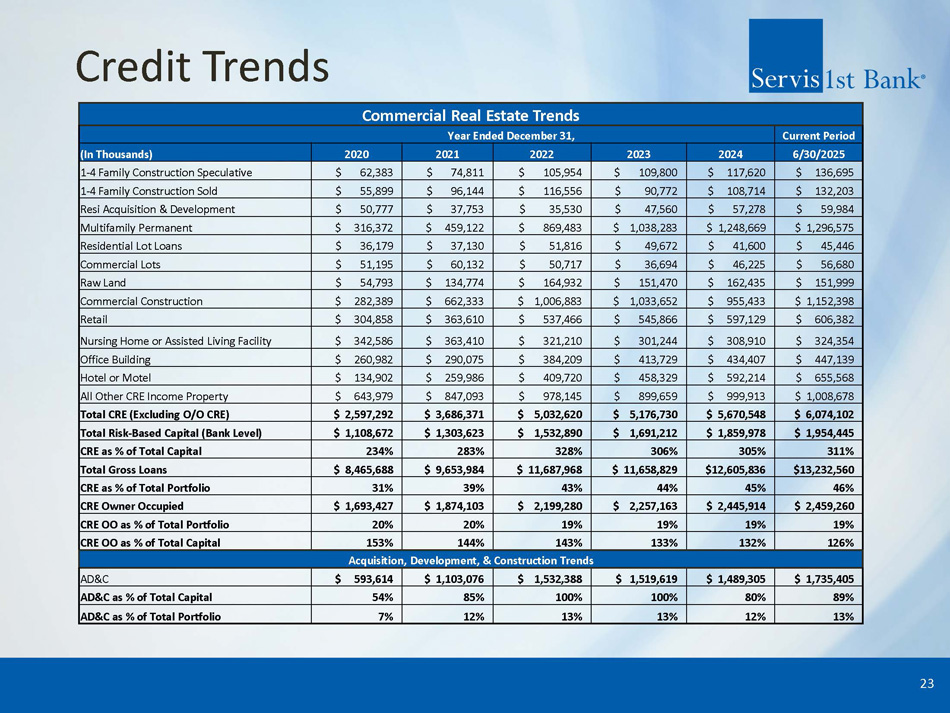
Credit Trends 23 Commercial Real Estate Trends Current Period Year Ended December 31, 6/30/2025 2024 2023 2022 2021 2020 (In Thousands) $ 136,695 $ 117,620 $ 109,800 $ 105,954 $ 74,811 $ 62,383 1 - 4 Family Construction Speculative $ 132,203 $ 108,714 $ 90,772 $ 116,556 $ 96,144 $ 55,899 1 - 4 Family Construction Sold $ 59,984 $ 57,278 $ 47,560 $ 35,530 $ 37,753 $ 50,777 Resi Acquisition & Development $ 1,296,575 $ 1,248,669 $ 1,038,283 $ 869,483 $ 459,122 $ 316,372 Multifamily Permanent $ 45,446 $ 41,600 $ 49,672 $ 51,816 $ 37,130 $ 36,179 Residential Lot Loans $ 56,680 $ 46,225 $ 36,694 $ 50,717 $ 60,132 $ 51,195 Commercial Lots $ 151,999 $ 162,435 $ 151,470 $ 164,932 $ 134,774 $ 54,793 Raw Land $ 1,152,398 $ 955,433 $ 1,033,652 $ 1,006,883 $ 662,333 $ 282,389 Commercial Construction $ 606,382 $ 597,129 $ 545,866 $ 537,466 $ 363,610 $ 304,858 Retail $ 324,354 $ 308,910 $ 301,244 $ 321,210 $ 363,410 $ 342,586 Nursing Home or Assisted Living Facility $ 447,139 $ 434,407 $ 413,729 $ 384,209 $ 290,075 $ 260,982 Office Building $ 655,568 $ 592,214 $ 458,329 $ 409,720 $ 259,986 $ 134,902 Hotel or Motel $ 1,008,678 $ 999,913 $ 899,659 $ 978,145 $ 847,093 $ 643,979 All Other CRE Income Property $ 6,074,102 $ 5,670,548 $ 5,176,730 $ 5,032,620 $ 3,686,371 $ 2,597,292 Total CRE (Excluding O/O CRE) $ 1,954,445 $ 1,859,978 $ 1,691,212 $ 1,532,890 $ 1,303,623 $ 1,108,672 Total Risk - Based Capital (Bank Level) 311% 305% 306% 328% 283% 234% CRE as % of Total Capital $13,232,560 $12,605,836 $ 11,658,829 $ 11,687,968 $ 9,653,984 $ 8,465,688 Total Gross Loans 46% 45% 44% 43% 39% 31% CRE as % of Total Portfolio $ 2,459,260 $ 2,445,914 $ 2,257,163 $ 2,199,280 $ 1,874,103 $ 1,693,427 CRE Owner Occupied 19% 19% 19% 19% 20% 20% CRE OO as % of Total Portfolio 126% 132% 133% 143% 144% 153% CRE OO as % of Total Capital Acquisition, Development, & Construction Trends $ 1,735,405 $ 1,489,305 $ 1,519,619 $ 1,532,388 $ 1,103,076 $ 593,614 AD&C 89% 80% 100% 100% 85% 54% AD&C as % of Total Capital 13% 12% 13% 13% 12% 7% AD&C as % of Total Portfolio
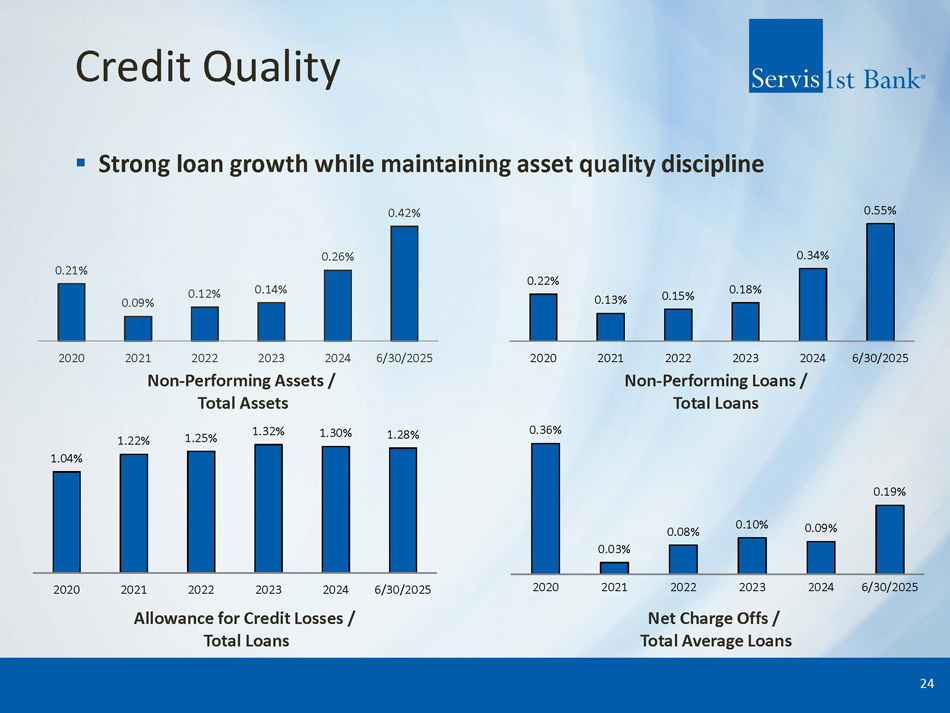
Credit Quality ▪ Strong loan growth while maintaining asset quality discipline 24 Allowance for Credit Losses / Total Loans Net Charge Offs / Total Average Loans Non - Performing Assets / Total Assets Non - Performing Loans / Total Loans 0.21% 0.09% 0.12% 0.14% 0.26% 0.42% 2020 2021 2022 2023 2024 6/30/2025 0.22% 0.13% 0.15% 0.18% 0.34% 0.55% 2020 2021 2022 2023 2024 6/30/2025 0.36% 0.03% 0.08% 0.10% 0.09% 0.19% 2020 2021 2022 2023 2024 6/30/2025 1.04% 1.22% 1.25% 1.32% 1.30% 1.28% 2020 2021 2022 2023 2024 6/30/2025
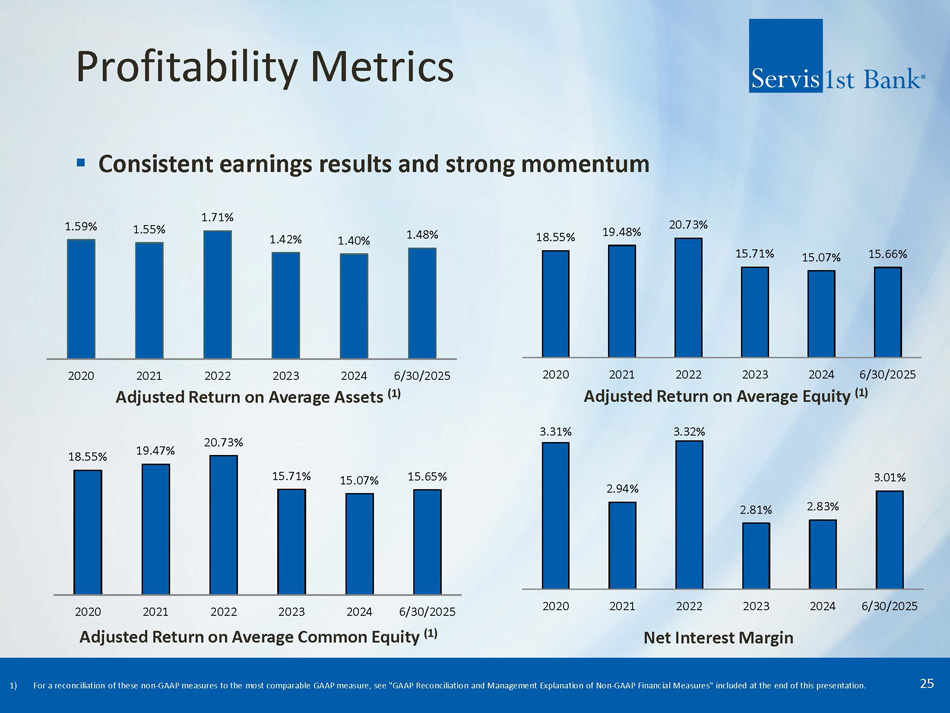
Profitability Metrics ▪ Consistent earnings results and strong momentum 25 Adjusted Return on Average Assets (1) Adjusted Return on Average Equity (1) Adjusted Return on Average Common Equity (1) Net Interest Margin 1) For a reconciliation of these non - GAAP measures to the most comparable GAAP measure, see "GAAP Reconciliation and Management Exp lanation of Non - GAAP Financial Measures" included at the end of this presentation. 1.59% 1.55% 1.71% 1.42% 1.40% 1.48% 2020 2021 2022 2023 2024 6/30/2025 18.55% 19.47% 20.73% 15.71% 15.07% 15.65% 2020 2021 2022 2023 2024 6/30/2025 3.31% 2.94% 3.32% 2.81% 2.83% 3.01% 2020 2021 2022 2023 2024 6/30/2025 18.55% 19.48% 20.73% 15.71% 15.07% 15.66% 2020 2021 2022 2023 2024 6/30/2025
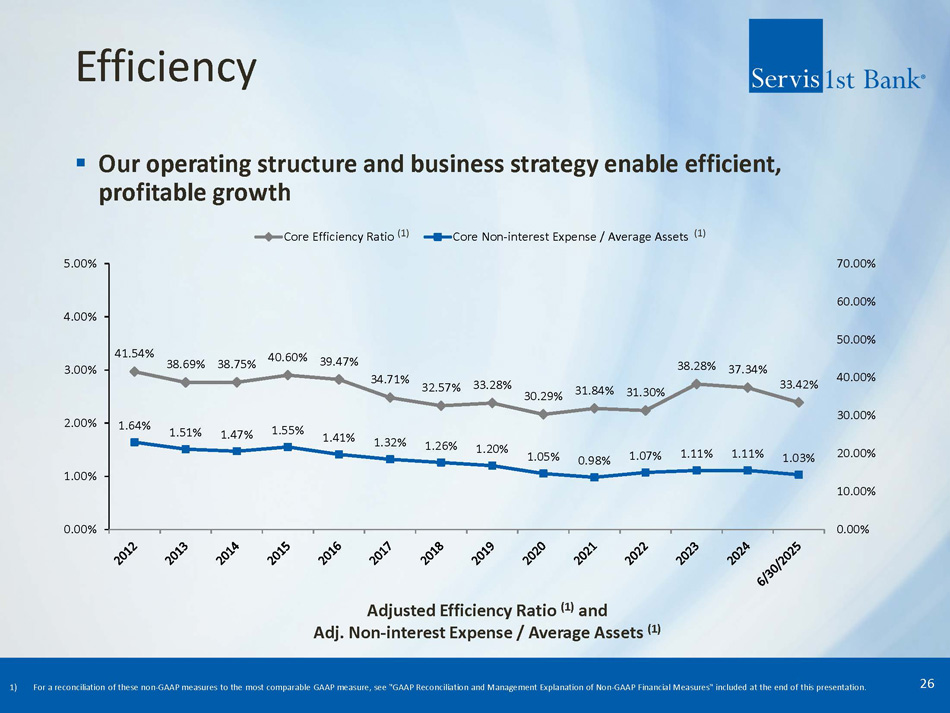
41.54% 38.69% 38.75% 40.60% 39.47% 34.71% 32.57% 33.28% 30.29% 31.84% 31.30% 38.28% 37.34% 33.42% 1.64% 1.51% 1.47% 1.55% 1.41% 1.32% 1.26% 1.20% 1.05% 0.98% 1.07% 1.11% 1.11% 1.03% 0.00% 1.00% 2.00% 3.00% 4.00% 5.00% 0.00% 10.00% 20.00% 30.00% 40.00% 50.00% 60.00% 70.00% Core Efficiency Ratio Core Non-interest Expense / Average Assets Efficiency ▪ Our operating structure and business strategy enable efficient, profitable growth 26 Adjusted Efficiency Ratio (1) and Adj. Non - interest Expense / Average Assets (1) (1) (1) 1) For a reconciliation of these non - GAAP measures to the most comparable GAAP measure, see "GAAP Reconciliation and Management Explanation of Non - GAAP Financial Measures" included at the end of this presentation .
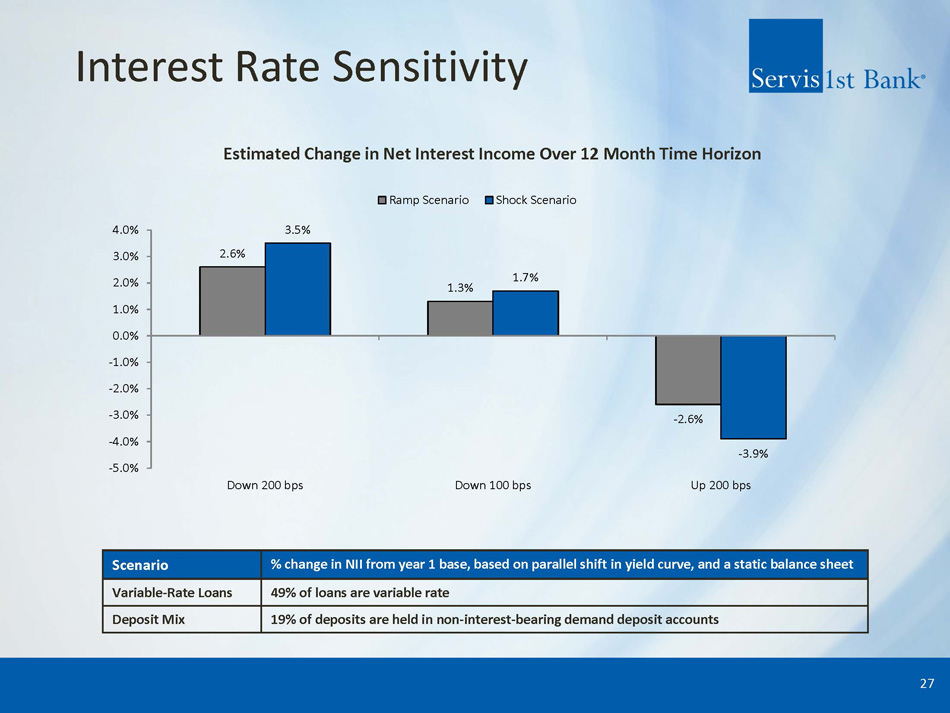
Interest Rate Sensitivity 27 Estimated Change in Net Interest Income Over 12 Month Time Horizon % change in NII from year 1 base, b ased on parallel shift in yield curve, and a static balance sheet Scenario 49% of loans are variable rate Variable - Rate Loans 19% of deposits are held in non - interest - bearing demand deposit accounts Deposit Mix 2.6% 1.3% - 2.6% 3.5% 1.7% - 3.9% -5.0% -4.0% -3.0% -2.0% -1.0% 0.0% 1.0% 2.0% 3.0% 4.0% Down 200 bps Down 100 bps Up 200 bps Ramp Scenario Shock Scenario
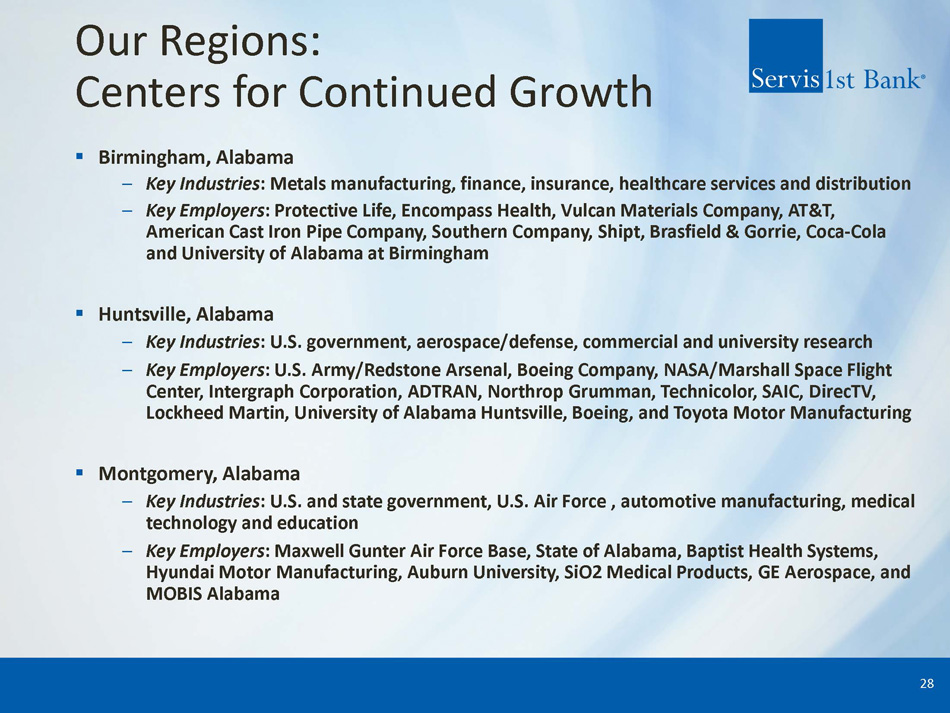
Our Regions: Centers for Continued Growth ▪ Birmingham, Alabama – Key Industries : Metals manufacturing, finance, insurance, healthcare services and distribution – Key Employers : Protective Life, Encompass Health, Vulcan Materials Company, AT&T, American Cast Iron Pipe Company, Southern Company, Shipt , Brasfield & Gorrie, Coca - Cola and University of Alabama at Birmingham ▪ Huntsville, Alabama – Key Industries : U.S. government, aerospace/defense, commercial and university research – Key Employers : U.S. Army/Redstone Arsenal, Boeing Company, NASA/Marshall Space Flight Center, Intergraph Corporation, ADTRAN, Northrop Grumman, Technicolor, SAIC, DirecTV, Lockheed Martin, University of Alabama Huntsville, Boeing, and Toyota Motor Manufacturing ▪ Montgomery, Alabama – Key Industries : U.S. and state government, U.S. Air Force , automotive manufacturing, medical technology and education – Key Employers : Maxwell Gunter Air Force Base, State of Alabama, Baptist Health Systems, Hyundai Motor Manufacturing, Auburn University, SiO2 Medical Products, GE Aerospace, and MOBIS Alabama 28
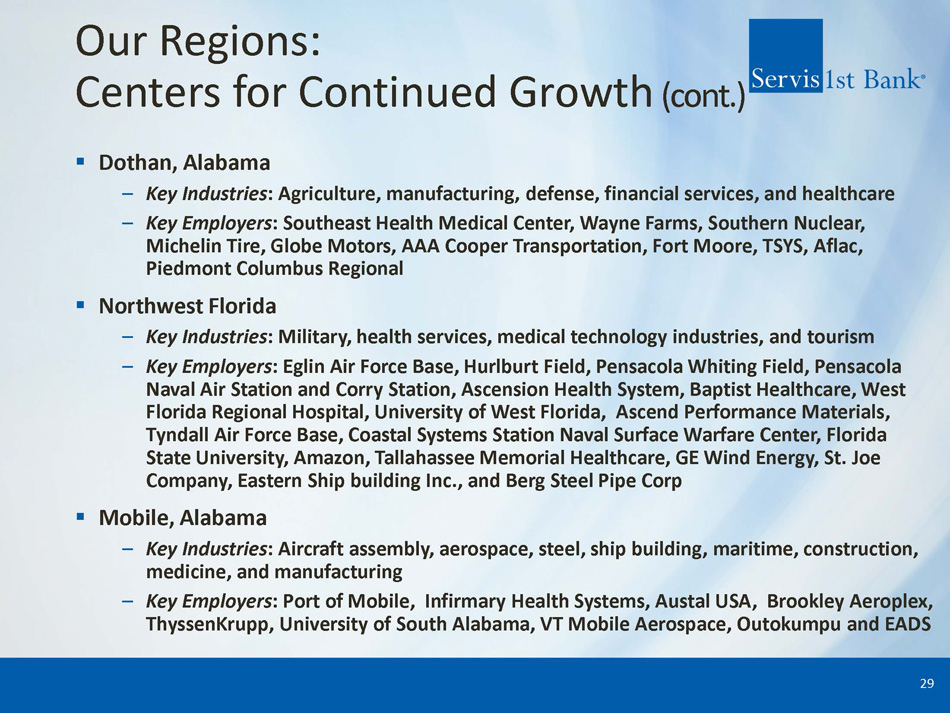
Our Regions: Centers for Continued Growth (cont.) ▪ Dothan, Alabama – Key Industries : Agriculture, manufacturing, defense, financial services, and healthcare – Key Employers : Southeast Health Medical Center, Wayne Farms, Southern Nuclear, Michelin Tire, Globe Motors, AAA Cooper Transportation, Fort Moore, TSYS, Aflac, Piedmont Columbus Regional ▪ Northwest Florida – Key Industries : Military, health services, medical technology industries, and tourism – Key Employers : Eglin Air Force Base, Hurlburt Field, Pensacola Whiting Field, Pensacola Naval Air Station and Corry Station, Ascension Health System, Baptist Healthcare, West Florida Regional Hospital, University of West Florida, Ascend Performance Materials, Tyndall Air Force Base, Coastal Systems Station Naval Surface Warfare Center, Florida State University, Amazon, Tallahassee Memorial Healthcare, GE Wind Energy, St. Joe Company, Eastern Ship building Inc., and Berg Steel Pipe Corp ▪ Mobile, Alabama – Key Industries : Aircraft assembly, aerospace, steel, ship building, maritime, construction, medicine, and manufacturing – Key Employers : Port of Mobile, Infirmary Health Systems, Austal USA, Brookley Aeroplex , ThyssenKrupp, University of South Alabama, VT Mobile Aerospace, Outokumpu and EADS 29
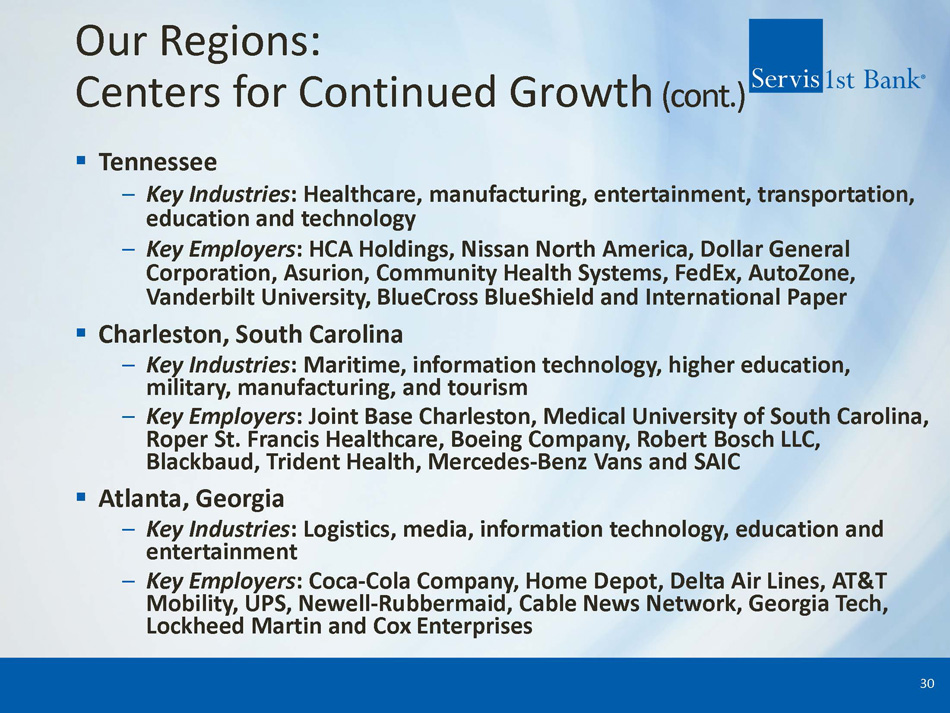
Our Regions: Centers for Continued Growth (cont.) ▪ Tennessee – Key Industries : Healthcare, manufacturing, entertainment, transportation, education and technology – Key Employers : HCA Holdings, Nissan North America, Dollar General Corporation, Asurion, Community Health Systems, FedEx, AutoZone, Vanderbilt University, BlueCross BlueShield and International Paper ▪ Charleston, South Carolina – Key Industries : Maritime, information technology, higher education, military, manufacturing, and tourism – Key Employers : Joint Base Charleston, Medical University of South Carolina, Roper St. Francis Healthcare, Boeing Company, Robert Bosch LLC, Blackbaud, Trident Health, Mercedes - Benz Vans and SAIC ▪ Atlanta, Georgia – Key Industries : Logistics, media, information technology, education and entertainment – Key Employers : Coca - Cola Company, Home Depot, Delta Air Lines, AT&T Mobility, UPS, Newell - Rubbermaid, Cable News Network, Georgia Tech, Lockheed Martin and Cox Enterprises 30
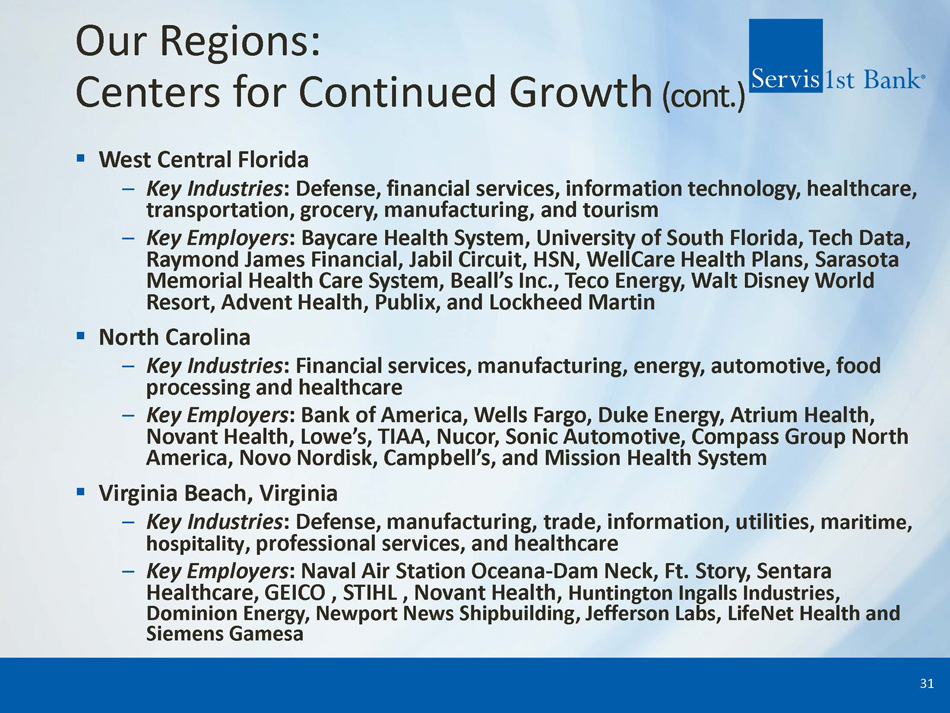
Our Regions: Centers for Continued Growth (cont.) ▪ West Central Florida – Key Industries : Defense, financial services, information technology, healthcare, transportation, grocery, manufacturing, and tourism – Key Employers : Baycare Health System, University of South Florida, Tech Data, Raymond James Financial, Jabil Circuit, HSN, WellCare Health Plans, Sarasota Memorial Health Care System, Beall’s Inc., Teco Energy, Walt Disney World Resort, Advent Health, Publix, and Lockheed Martin ▪ North Carolina – Key Industries : Financial services, manufacturing, energy, automotive, food processing and healthcare – Key Employers : Bank of America, Wells Fargo, Duke Energy, Atrium Health, Novant Health, Lowe’s, TIAA, Nucor, Sonic Automotive, Compass Group North America, Novo Nordisk, Campbell’s, and Mission Health System ▪ Virginia Beach, Virginia – Key Industries : Defense, manufacturing, trade, information, utilities, m aritime, hospitality , professional services, and healthcare – Key Employers : Naval Air Station Oceana - Dam Neck, Ft. Story, Sentara Healthcare, GEICO , STIHL , Novant Health, Huntington Ingalls Industries, Dominion Energy, Newport News Shipbuilding, Jefferson Labs, LifeNet Health and Siemens Gamesa 31
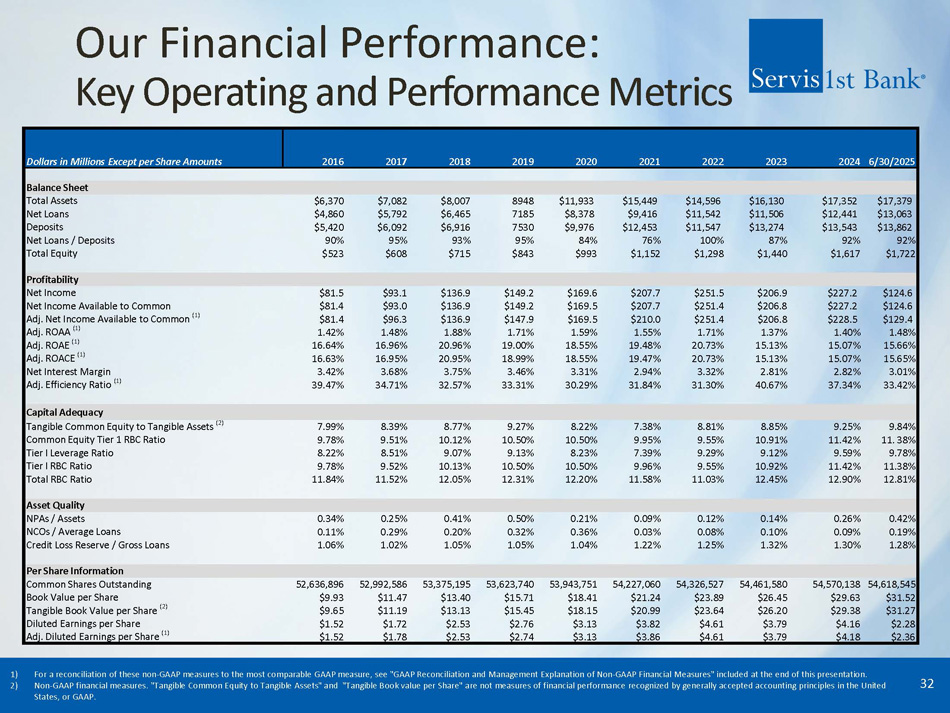
Our Financial Performance: Key Operating and Performance Metrics 32 1) For a reconciliation of these non - GAAP measures to the most comparable GAAP measure, see "GAAP Reconciliation and Management Exp lanation of Non - GAAP Financial Measures" included at the end of this presentation. 2) Non - GAAP financial measures. "Tangible Common Equity to Tangible Assets" and "Tangible Book value per Share" are not measures o f financial performance recognized by generally accepted accounting principles in the United States, or GAAP. Dollars in Millions Except per Share Amounts 6/30/2025 2024 2023 2022 2021 2020 2019 2018 2017 2016 Balance Sheet $ 17,379 $17,352 $16,130 $14,596 $15,449 $11,933 8948 $8,007 $7,082 $6,370 Total Assets $1 3,063 $12,441 $11,506 $11,542 $9,416 $8,378 7185 $6,465 $5,792 $4,860 Net Loans $1 3,862 $13,543 $13,274 $11,547 $12,453 $9,976 7530 $6,916 $6,092 $5,420 Deposits 92 % 92% 87% 100% 76% 84% 95% 93% 95% 90% Net Loans / Deposits $ 1,722 $1,617 $1,440 $1,298 $1,152 $993 $843 $715 $608 $523 Total Equity Profitability $ 124.6 $227.2 $206.9 $251.5 $207.7 $169.6 $149.2 $136.9 $93.1 $81.5 Net Income $ 124.6 $227.2 $206.8 $251.4 $207.7 $169.5 $149.2 $136.9 $93.0 $81.4 Net Income Available to Common $ 129.4 $22 8 . 5 $206.8 $251.4 $210.0 $169.5 $147.9 $136.9 $96.3 $81.4 Adj. Net Income Available to Common (1) 1. 48 % 1. 40 % 1.37% 1.71% 1.55% 1.59% 1.71% 1.88% 1.48% 1.42% Adj. ROAA (1) 1 5.66 % 1 5.07 % 15.13% 20.73% 19.48% 18.55% 19.00% 20.96% 16.96% 16.64% Adj. ROAE (1) 1 5.65 % 1 5.07 % 15.13% 20.73% 19.47% 18.55% 18.99% 20.95% 16.95% 16.63% Adj. ROACE (1) 3.01 % 2.82% 2.81% 3.32% 2.94% 3.31% 3.46% 3.75% 3.68% 3.42% Net Interest Margin 3 3.42 % 37. 34 % 40.67% 31.30% 31.84% 30.29% 33.31% 32.57% 34.71% 39.47% Adj. Efficiency Ratio (1) Capital Adequacy 9.84 % 9.25% 8.85% 8.81% 7.38% 8.22% 9.27% 8.77% 8.39% 7.99% Tangible Common Equity to Tangible Assets (2) 11. 38 % 11. 42 % 10 . 9 1 % 9.55% 9.95% 10.50% 10.50% 10.12% 9.51% 9.78% Common Equity Tier 1 RBC Ratio 9. 78 % 9.5 9 % 9.12% 9.29% 7.39% 8.23% 9.13% 9.07% 8.51% 8.22% Tier I Leverage Ratio 11. 38 % 11. 42 % 10.92% 9.55% 9.96% 10.50% 10.50% 10.13% 9.52% 9.78% Tier I RBC Ratio 12. 81 % 12. 90 % 12.45% 11.03% 11.58% 12.20% 12.31% 12.05% 11.52% 11.84% Total RBC Ratio Asset Quality 0. 42 % 0. 2 6% 0.1 4 % 0.12% 0.09% 0.21% 0.50% 0.41% 0.25% 0.34% NPAs / Assets 0. 19 % 0.0 9 % 0. 10 % 0.08% 0.03% 0.36% 0.32% 0.20% 0. 29 % 0.11% NCOs / Average Loans 1. 28 % 1.30% 1.32% 1.25% 1.22% 1.04% 1.05% 1.05% 1.02% 1.06% Credit Loss Reserve / Gross Loans Per Share Information 54, 618,545 54,5 70 , 138 54,461,580 54,326,527 54,227,060 53,943,751 53,623,740 53,375,195 52,992,586 52,636,896 Common Shares Outstanding $ 31.52 $29.63 $26.45 $23.89 $21.24 $18.41 $15.71 $13.40 $11.47 $9.93 Book Value per Share $ 31.27 $29.38 $26.20 $23.64 $20.99 $18.15 $15.45 $13.13 $11.19 $9.65 Tangible Book Value per Share (2) $ 2.28 $4.16 $3.79 $4.61 $3.82 $3.13 $2.76 $2.53 $1.72 $1.52 Diluted Earnings per Share $ 2.36 $4.1 8 $3.79 $4.61 $3.86 $3.13 $2.74 $2.53 $1.78 $1.52 Adj. Diluted Earnings per Share (1)
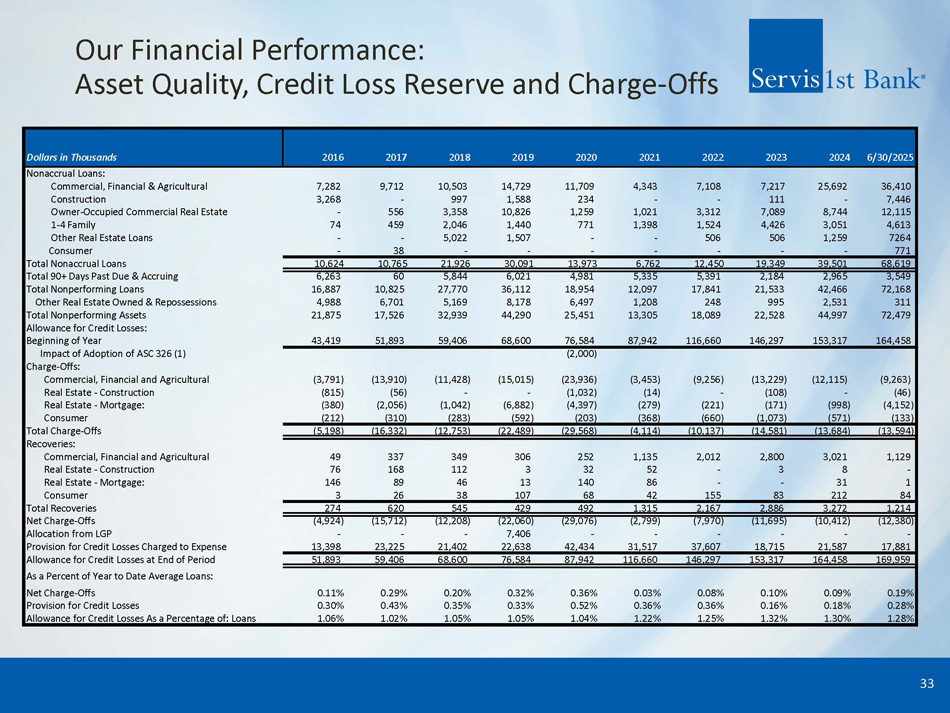
Our Financial Performance: Asset Quality, Credit Loss Reserve and Charge - Offs 33 6/30/2025 2024 2023 2022 2021 2020 2019 2018 2017 2016 Dollars in Thousands Nonaccrual Loans: 36,410 2 5,692 7,217 7,108 4,343 11,709 14,729 10,503 9,712 7,282 Commercial, Financial & Agricultural 7,446 - 111 - - 234 1,588 997 - 3,268 Construction 12,115 8,744 7,089 3,312 1,021 1,259 10,826 3,358 556 - Owner - Occupied Commercial Real Estate 4,613 3,051 4,426 1,524 1,398 771 1,440 2,046 459 74 1 - 4 Family 7264 1,259 506 506 - - 1,507 5,022 - - Other Real Estate Loans 771 - - - - - - - 38 - Consumer 68,619 3 9,501 19,349 12,450 6,762 13,973 30,091 21,926 10,765 10,624 Total Nonaccrual Loans 3,549 2, 965 2,184 5,391 5,335 4,981 6,021 5,844 60 6,263 Total 90+ Days Past Due & Accruing 72,168 42,466 21,533 17,841 12,097 18,954 36,112 27,770 10,825 16,887 Total Nonperforming Loans 311 2, 531 995 248 1,208 6,497 8,178 5,169 6,701 4,988 Other Real Estate Owned & Repossessions 72,479 4 4,997 22,528 18,089 13,305 25,451 44,290 32,939 17,526 21,875 Total Nonperforming Assets Allowance for Credit Losses: 164,458 153,317 146,297 116,660 87,942 76,584 68,600 59,406 51,893 43,419 Beginning of Year (2,000) Impact of Adoption of ASC 326 (1) Charge - Offs: (9,263) (12,115) (13,229) (9,256) (3,453) (23,936) (15,015) (11,428) (13,910) (3,791) Commercial, Financial and Agricultural (46) - (108) - (14) (1,032) - - (56) (815) Real Estate - Construction ( 4,152 ) ( 998 ) (171) (221) (279) (4,397) (6,882) (1,042) (2,056) (380) Real Estate - Mortgage: ( 133 ) ( 571 ) (1,073) (660) (368) (203) (592) (283) (310) (212) Consumer ( 13,594 ) ( 13,684 ) (14,581) (10,137) (4,114) (29,568) (22,489) (12,753) (16,332) (5,198) Total Charge - Offs Recoveries: 1,129 3,021 2,800 2,012 1,135 252 306 349 337 49 Commercial, Financial and Agricultural - 8 3 - 52 32 3 112 168 76 Real Estate - Construction 1 31 - - 86 140 13 46 89 146 Real Estate - Mortgage: 84 212 83 155 42 68 107 38 26 3 Consumer 1,214 3,272 2,886 2,167 1,315 492 429 545 620 274 Total Recoveries ( 12,380 ) ( 10,412 ) (11,695) (7,970) (2,799) (29,076) (22,060) (12,208) (15,712) (4,924) Net Charge - Offs - - - - - - 7,406 - - - Allocation from LGP 17,881 21,587 18,715 37,607 31,517 42,434 22,638 21,402 23,225 13,398 Provision for Credit Losses Charged to Expense 1 69,959 16 4,458 153,317 146,297 116,660 87,942 76,584 68,600 59,406 51,893 Allowance for Credit Losses at End of Period As a Percent of Year to Date Average Loans: 0. 19 % 0.0 9 % 0.10% 0.08% 0.03% 0.36% 0.32% 0.20% 0.29% 0.11% Net Charge - Offs 0. 28 % 0.1 8 % 0.16% 0.36% 0.36% 0.52% 0.33% 0.35% 0.43% 0.30% Provision for Credit Losses 1. 28 % 1.3 0 % 1.32% 1.25% 1.22% 1.04% 1.05% 1.05% 1.02% 1.06% Allowance for Credit Losses As a Percentage of: Loans
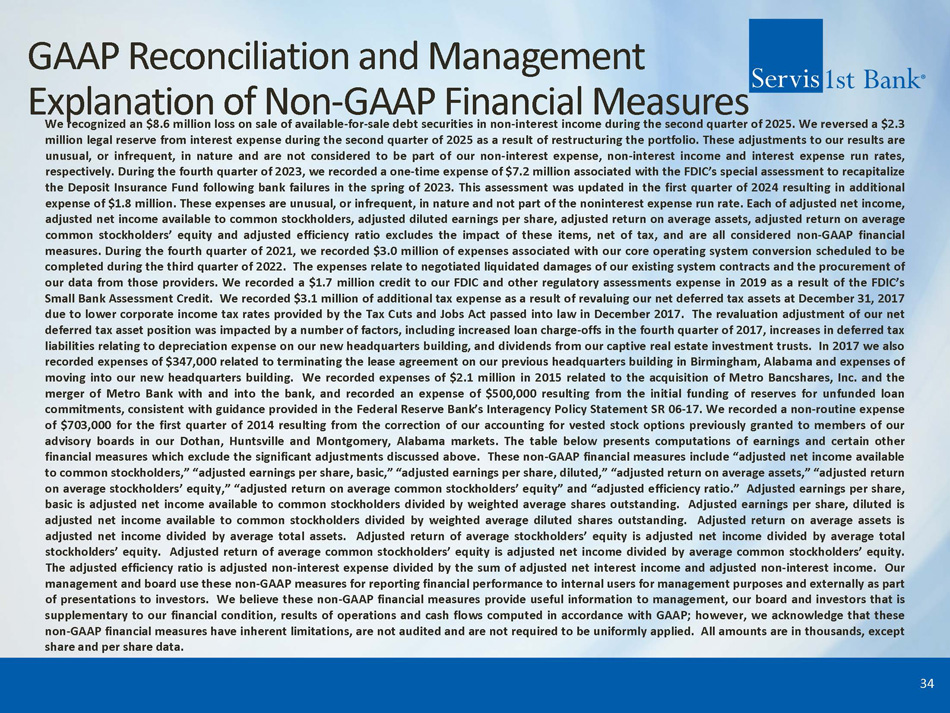
GAAP Reconciliation and Management Explanation of Non - GAAP Financial Measures We recognized an $ 8 . 6 million loss on sale of available - for - sale debt securities in non - interest income during the second quarter of 2025 . We reversed a $ 2 . 3 million legal reserve from interest expense during the second quarter of 2025 as a result of restructuring the portfolio . These adjustments to our results are unusual, or infrequent, in nature and are not considered to be part of our non - interest expense, non - interest income and interest expense run rates, respectively . During the fourth quarter of 2023 , we recorded a one - time expense of $ 7 . 2 million associated with the FDIC’s special assessment to recapitalize the Deposit Insurance Fund following bank failures in the spring of 2023 . This assessment was updated in the first quarter of 2024 resulting in additional expense of $ 1 . 8 million . These expenses are unusual, or infrequent, in nature and not part of the noninterest expense run rate . Each of adjusted net income, adjusted net income available to common stockholders, adjusted diluted earnings per share, adjusted return on average assets, adjusted return on average common stockholders’ equity and adjusted efficiency ratio excludes the impact of these items, net of tax, and are all considered non - GAAP financial measures . During the fourth quarter of 2021 , we recorded $ 3 . 0 million of expenses associated with our core operating system conversion scheduled to be completed during the third quarter of 2022 . The expenses relate to negotiated liquidated damages of our existing system contracts and the procurement of our data from those providers . We recorded a $ 1 . 7 million credit to our FDIC and other regulatory assessments expense in 2019 as a result of the FDIC’s Small Bank Assessment Credit . We recorded $ 3 . 1 million of additional tax expense as a result of revaluing our net deferred tax assets at December 31 , 2017 due to lower corporate income tax rates provided by the Tax Cuts and Jobs Act passed into law in December 2017 . The revaluation adjustment of our net deferred tax asset position was impacted by a number of factors, including increased loan charge - offs in the fourth quarter of 2017 , increases in deferred tax liabilities relating to depreciation expense on our new headquarters building, and dividends from our captive real estate investment trusts . In 2017 we also recorded expenses of $ 347 , 000 related to terminating the lease agreement on our previous headquarters building in Birmingham, Alabama and expenses of moving into our new headquarters building . We recorded expenses of $ 2 . 1 million in 2015 related to the acquisition of Metro Bancshares, Inc . and the merger of Metro Bank with and into the bank, and recorded an expense of $ 500 , 000 resulting from the initial funding of reserves for unfunded loan commitments, consistent with guidance provided in the Federal Reserve Bank’s Interagency Policy Statement SR 06 - 17 . We recorded a non - routine expense of $ 703 , 000 for the first quarter of 2014 resulting from the correction of our accounting for vested stock options previously granted to members of our advisory boards in our Dothan, Huntsville and Montgomery, Alabama markets . The table below presents computations of earnings and certain other financial measures which exclude the significant adjustments discussed above . These non - GAAP financial measures include “adjusted net income available to common stockholders,” “adjusted earnings per share, basic,” “adjusted earnings per share, diluted,” “adjusted return on average assets,” “adjusted return on average stockholders’ equity,” “adjusted return on average common stockholders’ equity” and “adjusted efficiency ratio . ” Adjusted earnings per share, basic is adjusted net income available to common stockholders divided by weighted average shares outstanding . Adjusted earnings per share, diluted is adjusted net income available to common stockholders divided by weighted average diluted shares outstanding . Adjusted return on average assets is adjusted net income divided by average total assets . Adjusted return of average stockholders’ equity is adjusted net income divided by average total stockholders’ equity . Adjusted return of average common stockholders’ equity is adjusted net income divided by average common stockholders’ equity . The adjusted efficiency ratio is adjusted non - interest expense divided by the sum of adjusted net interest income and adjusted non - interest income . Our management and board use these non - GAAP measures for reporting financial performance to internal users for management purposes and externally as part of presentations to investors . We believe these non - GAAP financial measures provide useful information to management, our board and investors that is supplementary to our financial condition, results of operations and cash flows computed in accordance with GAAP ; however, we acknowledge that these non - GAAP financial measures have inherent limitations, are not audited and are not required to be uniformly applied . All amounts are in thousands, except share and per share data . 34
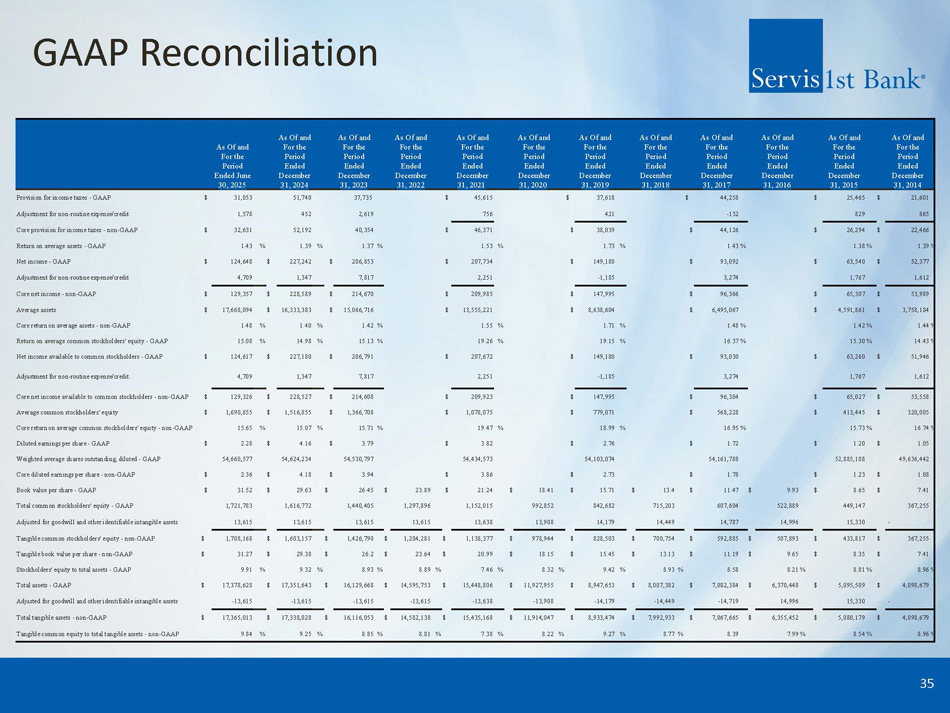
GAAP Reconciliation 35 As Of and For the Period Ended December 31, 2014 As Of and For the Period Ended December 31, 2015 As Of and For the Period Ended December 31, 2016 As Of and For the Period Ended December 31, 2017 As Of and For the Period Ended December 31, 2018 As Of and For the Period Ended December 31, 2019 As Of and For the Period Ended December 31, 2020 As Of and For the Period Ended December 31, 2021 As Of and For the Period Ended December 31, 2022 As Of and For the Period Ended December 31, 2023 As Of and For the Period Ended December 31, 2024 As Of and For the Period Ended June 30, 2025 21,601 $ 25,465 $ 44,258 $ 37,618 $ 45,615 $ 37,735 51,740 31,053 $ Provision for income taxes - GAAP 865 829 - 132 421 756 2,619 452 1,578 Adjustment for non - routine expense/credit 22,466 $ 26,294 $ 44,126 $ 38,039 $ 46,371 $ 40,354 52,192 32,631 $ Core provision for income taxes - non - GAAP % 1.39 % 1.38 % 1.43 % 1.73 % 1.53 % 1.37 % 1.39 % 1.43 Return on average assets - GAAP 52,377 $ 63,540 $ 93,092 $ 149,180 $ 207,734 $ 206,853 $ 227,242 $ 124,648 $ Net income - GAAP 1,612 1,767 3,274 - 1,185 2,251 7,817 1,347 4,709 Adjustment for non - routine expense/credit 53,989 $ 65,307 $ 96,366 $ 147,995 $ 209,985 $ 214,670 $ 228,589 $ 129,357 $ Core net income - non - GAAP 3,758,184 $ 4,591,861 $ 6,495,067 $ 8,638,604 $ 13,555,221 $ 15,066,716 $ 16,333,383 $ 17,668,094 $ Average assets % 1.44 % 1.42 % 1.48 % 1.71 % 1.55 % 1.42 % 1.40 % 1.48 Core return on average assets - non - GAAP % 14.43 % 15.30 % 16.37 % 19.15 % 19.26 % 15.13 % 14.98 % 15.08 Return on average common stockholders' equity - GAAP 51,946 $ 63,260 $ 93,030 $ 149,180 $ 207,672 $ 206,791 $ 227,180 $ 124,617 $ Net income available to common stockholders - GAAP 1,612 1,767 3,274 - 1,185 2,251 7,817 1,347 4,709 Adjustment for non - routine expense/credit 53,558 $ 65,027 $ 96,304 $ 147,995 $ 209,923 $ 214,608 $ 228,527 $ 129,326 $ Core net income available to common stockholders - non - GAAP 320,005 $ 413,445 $ 568,228 $ 779,071 $ 1,078,075 $ 1,366,708 $ 1,516,855 $ 1,690,855 $ Average common stockholders' equity % 16.74 % 15.73 % 16.95 % 18.99 % 19.47 % 15.71 % 15.07 % 15.65 Core return on average common stockholders' equity - non - GAAP 1.05 $ 1.20 $ 1.72 $ 2.76 $ 3.82 $ 3.79 $ 4.16 $ 2.28 $ Diluted earnings per share - GAAP 49,636,442 52,885,108 54,161,788 54,103,074 54,434,573 54,530,797 54,624,234 54,660,577 Weighted average shares outstanding, diluted - GAAP 1.08 $ 1.23 $ 1.78 $ 2.73 $ 3.86 $ 3.94 $ 4.18 $ 2.36 $ Core diluted earnings per share - non - GAAP 7.41 $ 8.65 $ 9.93 $ 11.47 $ 13.4 $ 15.71 $ 18.41 $ 21.24 $ 23.89 $ 26.45 $ 29.63 $ 31.52 $ Book value per share - GAAP 367,255 449,147 522,889 607,604 715,203 842,682 992,852 1,152,015 1,297,896 1,440,405 1,616,772 1,721,783 Total common stockholders' equity - GAAP - 15,330 14,996 14,787 14,449 14,179 13,908 13,638 13,615 13,615 13,615 13,615 Adjusted for goodwill and other identifiable intangible assets 367,255 $ 433,817 $ 507,893 $ 592,885 $ 700,754 $ 828,503 $ 978,944 $ 1,138,377 $ 1,284,281 $ 1,426,790 $ 1,603,157 $ 1,708,168 $ Tangible common stockholders' equity - non - GAAP 7.41 $ 8.35 $ 9.65 $ 11.19 $ 13.13 $ 15.45 $ 18.15 $ 20.99 $ 23.64 $ 26.2 $ 29.38 $ 31.27 $ Tangible book value per share - non - GAAP % 8.96 % 8.81 % 8.21 8.58 % 8.93 % 9.42 % 8.32 % 7.46 % 8.89 % 8.93 % 9.32 % 9.91 Stockholders' equity to total assets - GAAP 4,098,679 $ 5,095,509 $ 6,370,448 $ 7,082,384 $ 8,007,382 $ 8,947,653 $ 11,927,955 $ 15,448,806 $ 14,595,753 $ 16,129,668 $ 17,351,643 $ 17,378,628 $ Total assets - GAAP - 15,330 14,996 - 14,719 - 14,449 - 14,179 - 13,908 - 13,638 - 13,615 - 13,615 - 13,615 - 13,615 Adjusted for goodwill and other identifiable intangible assets 4,098,679 $ 5,080,179 $ 6,355,452 $ 7,067,665 $ 7,992,933 $ 8,933,474 $ 11,914,047 $ 15,435,168 $ 14,582,138 $ 16,116,053 $ 17,338,028 $ 17,365,013 $ Total tangible assets - non - GAAP % 8.96 % 8.54 % 7.99 8.39 % 8.77 % 9.27 % 8.22 % 7.38 % 8.81 % 8.85 % 9.25 % 9.84 Tangible common equity to total tangible assets - non - GAAP