Exhibit 99.2
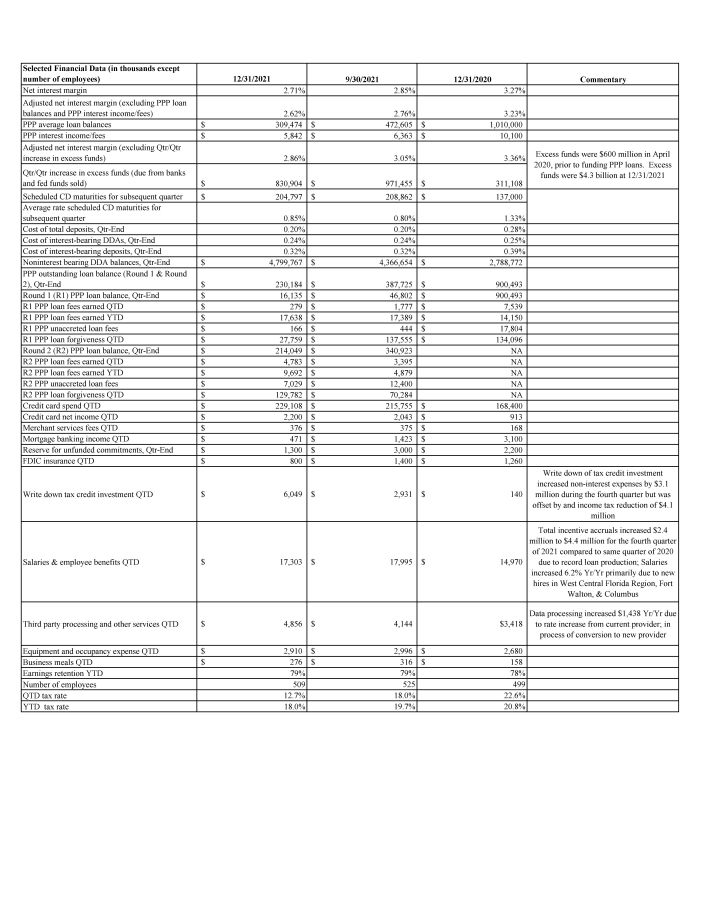
Selected Financial Data (in thousands except number of employees) 12/31/2021 9/30/2021 12/31/2020 Commentary Net interest margin 2.71% 2.85% 3.27% Adjusted net interest margin (excluding PPP loan balances and PPP interest income/fees) 2.62% 2.76% 3.23% PPP average loan balances $ 309,474 $ 472,605 $ 1,010,000 PPP interest income/fees $ 5,842 $ 6,363 $ 10,100 Adjusted net interest margin (excluding Qtr/Qtr increase in excess funds) 2.86% 3.05% 3.36% Excess funds were $600 million in April 2020, prior to funding PPP loans. Excess funds were $4.3 billion at 12/31/2021 Qtr/Qtr increase in excess funds (due from banks and fed funds sold) $ 830,904 $ 971,455 $ 311,108 Scheduled CD maturities for subsequent quarter $ 204,797 $ 208,862 $ 137,000 Average rate scheduled CD maturities for subsequent quarter 0.85% 0.80% 1.33% Cost of total deposits, Qtr - End 0.20% 0.20% 0.28% Cost of interest - bearing DDAs, Qtr - End 0.24% 0.24% 0.25% Cost of interest - bearing deposits, Qtr - End 0.32% 0.32% 0.39% Noninterest bearing DDA balances, Qtr - End $ 4,799,767 $ 4,366,654 $ 2,788,772 PPP outstanding loan balance (Round 1 & Round 2), Qtr - End $ 230,184 $ 387,725 $ 900,493 Round 1 (R1) PPP loan balance, Qtr - End $ 16,135 $ 46,802 $ 900,493 R1 PPP loan fees earned QTD $ 279 $ 1,777 $ 7,539 R1 PPP loan fees earned YTD $ 17,638 $ 17,389 $ 14,150 R1 PPP unaccreted loan fees $ 166 $ 444 $ 17,804 R1 PPP loan forgiveness QTD $ 27,759 $ 137,555 $ 134,096 Round 2 (R2) PPP loan balance, Qtr - End $ 214,049 $ 340,923 NA R2 PPP loan fees earned QTD $ 4,783 $ 3,395 NA R2 PPP loan fees earned YTD $ 9,692 $ 4,879 NA R2 PPP unaccreted loan fees $ 7,029 $ 12,400 NA R2 PPP loan forgiveness QTD $ 129,782 $ 70,284 NA Credit card spend QTD $ 229,108 $ 215,755 $ 168,400 Credit card net income QTD $ 2,200 $ 2,043 $ 913 Merchant services fees QTD $ 376 $ 375 $ 168 Mortgage banking income QTD $ 471 $ 1,423 $ 3,100 Reserve for unfunded commitments, Qtr - End $ 1,300 $ 3,000 $ 2,200 FDIC insurance QTD $ 800 $ 1,400 $ 1,260 Write down tax credit investment QTD $ 6,049 $ 2,931 $ 140 Write down of tax credit investment increased non - interest expenses by $3.1 million during the fourth quarter but was offset by and income tax reduction of $4.1 million Salaries & employee benefits QTD $ 17,303 $ 17,995 $ 14,970 Total incentive accruals increased $2.4 million to $4.4 million for the fourth quarter of 2021 compared to same quarter of 2020 due to record loan production; Salaries increased 6.2% Yr/Yr primarily due to new hires in West Central Florida Region, Fort Walton, & Columbus Third party processing and other services QTD $ 4,856 $ 4,144 $3,418 Data processing increased $1,438 Yr/Yr due to rate increase from current provider; in process of conversion to new provider Equipment and occupancy expense QTD $ 2,910 $ 2,996 $ 2,680 Business meals QTD $ 276 $ 316 $ 158 Earnings retention YTD 79% 79% 78% Number of employees 509 525 499 QTD tax rate 12.7% 18.0% 22.6% YTD tax rate 18.0% 19.7% 20.8%
GAAP Reconciliation and Management Explanation of Non-GAAP Financial Measures
This supplemental financial data contains two measures of adjusted net interest margin. Both are non-GAAP measures. We provide net interest
margin adjusted to exclude PPP balances, PPP interest income, and PPP fees, and we provide net interest margin adjusted to exclude increases
in excess funds over the past quarter. We believe these non-GAAP financial measures provide useful information to management and
investors that is supplementary to our financial condition, results of operations and cash flows computed in accordance with GAAP; however,
we acknowledge that these non-GAAP financial measures have a number of limitations. As such, you should not view these disclosures
as a substitute for results determined in accordance with GAAP, and they are not necessarily comparable to non-GAAP financial measures
that other companies, including those in our industry, use. The following reconciliation table provides a more detailed analysis
of the non-GAAP financial measures as of and for the comparative periods presented in this press release. Dollars are in thousands.
| At December 31, 2021 | At September 30, 2021 | At December 31, 2020 | ||||||||||
| Net Interest Margin - GAAP | 2.71 | % | 2.85 | % | 3.27 | % | ||||||
| Net Interest Income - GAAP | $ | 101,150 | $ | 96,320 | $ | 92,081 | ||||||
| Adjustments: | ||||||||||||
| PPP Interest Income | (780 | ) | (1,191 | ) | (2,539 | ) | ||||||
| PPP Fee Accretion | (5,062 | ) | (5,172 | ) | (7,539 | ) | ||||||
| Adjusted Net Interest Income - non-GAAP | 95,308 | 89,957 | 82,003 | |||||||||
| Average interest-earning assets | 14,806,241 | 13,439,524 | 11,225,519 | |||||||||
| Adjustments: | ||||||||||||
| Average PPP loan balances | (309,474 | ) | (472,605 | ) | (1,006,131 | ) | ||||||
| Adjusted average interest-earning assets | $ | 14,496,767 | $ | 12,966,919 | $ | 10,219,388 | ||||||
| Adjusted Net Interest Margin - non-GAAP | 2.62 | % | 2.76 | % | 3.23 | % | ||||||
| Net Interest Margin - GAAP | 2.71 | % | 2.85 | % | 3.27 | % | ||||||
| Net Interest Income - GAAP | $ | 101,150 | $ | 96,320 | $ | 92,081 | ||||||
| Adjustments: | ||||||||||||
| Interest earned on excess funds | (1,485 | ) | (1,121 | ) | (488 | ) | ||||||
| Adjusted Net Interest Income - non-GAAP | 99,665 | 95,199 | 91,593 | |||||||||
| Average interest-earning assets | 14,806,241 | 13,439,524 | 11,225,519 | |||||||||
| Adjustments: | ||||||||||||
| Increase in quarterly average excess funds | (830,904 | ) | (971,455 | ) | (311,108 | ) | ||||||
| Adjusted average interest-earning assets | $ | 13,975,337 | $ | 12,468,069 | $ | 10,914,411 | ||||||
| Adjusted Net Interest Margin - non-GAAP | 2.86 | % | 3.05 | % | 3.36 | % | ||||||