
Exhibit 99.1
ServisFirst Bancshares, Inc. NYSE: SFBS November 2021
Forward - Looking Statements ▪ Statements in this presentation that are not historical facts, including, but not limited to, statements concerning future operations, results or performance, are hereby identified as "forward - looking statements" for the purpose of the safe harbor provided by Section 21 E of the Securities Exchange Act of 1934 and Section 27 A of the Securities Act of 1933 . The words "believe," "expect," "anticipate," "project," “plan,” “intend,” “will,” “would,” “might,” “could” and similar expressions often signify forward - looking statements . Such statements involve inherent risks and uncertainties . ServisFirst Bancshares, Inc . cautions that such forward - looking statements, wherever they occur in this presentation or in other statements attributable to ServisFirst Bancshares, Inc . , are necessarily estimates reflecting the judgment of ServisFirst Bancshares, Inc . ’s senior management and involve a number of risks and uncertainties that could cause actual results to differ materially from those suggested by the forward - looking statements . Such forward - looking statements should, therefore, be considered in light of various factors that could affect the accuracy of such forward - looking statements, including : the global health and economic crisis precipitated by the COVID - 19 outbreak ; general economic conditions, especially in the credit markets and in the Southeast ; the performance of the capital markets ; changes in interest rates, yield curves and interest rate spread relationships ; changes in accounting and tax principles, policies or guidelines ; changes in legislation or regulatory requirements ; changes in our loan portfolio and the deposit base ; economic crises and associated credit issues in industries most impacted by the COVID - 19 outbreak, including the restaurant, hospitality and retail sectors ; possible changes in laws and regulations and governmental monetary and fiscal policies, including, but not limited to, economic stimulus initiatives ; the cost and other effects of legal and administrative cases and similar contingencies ; possible changes in the creditworthiness of customers and the possible impairment of the collectability of loans and the value of collateral ; the effect of natural disasters, such as hurricanes and tornados, in our geographic markets ; and increased competition from both banks and non - bank financial institutions . The foregoing list of factors is not exhaustive . For discussion of these and other risks that may cause actual results to differ from expectations, please refer to “Cautionary Note Regarding Forward - looking Statements” and “Risk Factors” in our most recent Annual Report on Form 10 - K and our other SEC filings . If one or more of the factors affecting our forward - looking information and statements proves incorrect, then our actual results, performance or achievements could differ materially from those expressed in, or implied by, forward - looking information and statements contained herein . Accordingly, you should not place undue reliance on any forward - looking statements, which speak only as of the date made . ServisFirst Bancshares, Inc . assumes no obligation to update or revise any forward - looking statements that are made from time to time . ▪ Non - GAAP Financial Measures - This presentation includes non - GAAP financial measures . Information about any such non - GAAP financial measures, including a reconciliation of those measures to GAAP, can be found in the presentation . 2
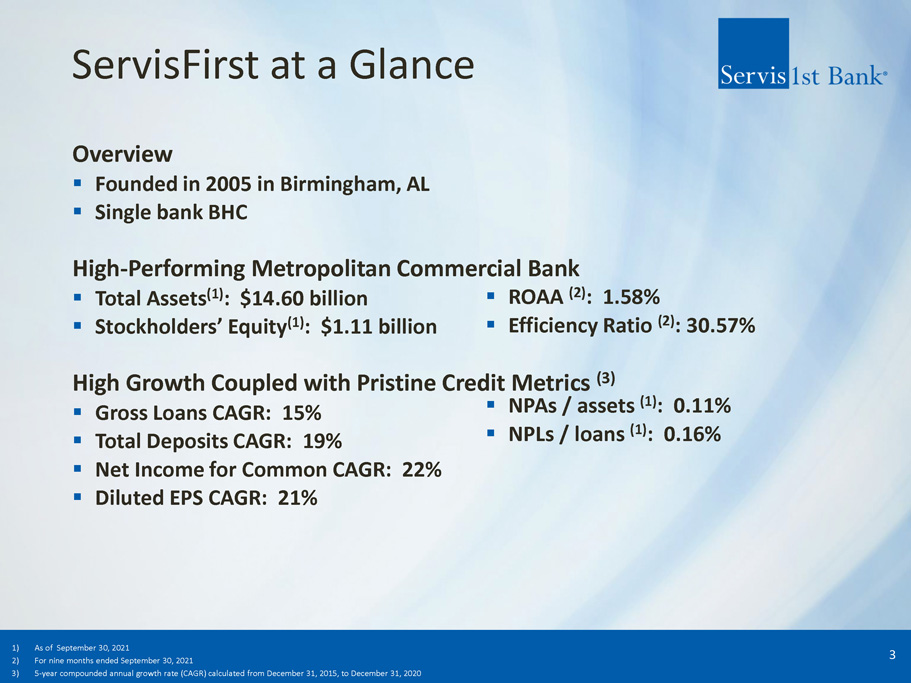
ServisFirst at a Glance Overview ▪ Founded in 2005 in Birmingham, AL ▪ Single bank BHC High - Performing Metropolitan Commercial Bank ▪ Total Assets (1) : $14.60 billion ▪ Stockholders’ Equity (1) : $1.11 billion High Growth Coupled with Pristine Credit Metrics (3) ▪ Gross Loans CAGR: 15% ▪ Total Deposits CAGR: 19% ▪ Net Income for Common CAGR: 22% ▪ Diluted EPS CAGR: 21% ▪ ROAA (2) : 1.58% ▪ Efficiency Ratio (2) : 30.57% 1) As of September 30, 2021 2) For nine months ended September 30, 2021 3) 5 - year compounded annual growth rate (CAGR) calculated from December 31, 2015, to December 31, 2020 ▪ NPAs / assets (1) : 0.11% ▪ NPLs / loans (1) : 0.16% 3
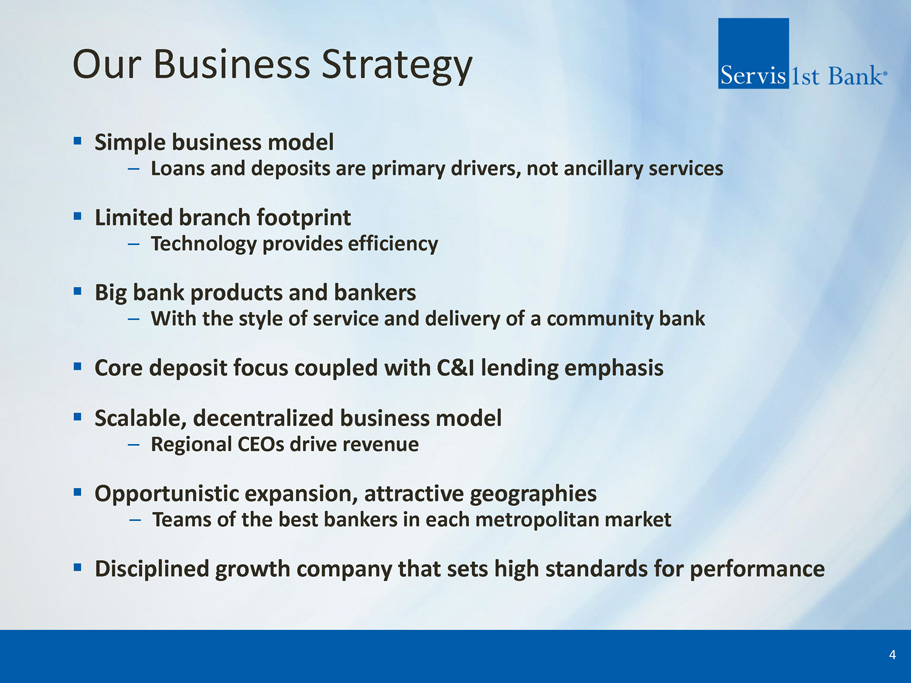
Our Business Strategy ▪ Simple business model – Loans and deposits are primary drivers, not ancillary services ▪ Limited branch footprint – Technology provides efficiency ▪ Big bank products and bankers – With the style of service and delivery of a community bank ▪ Core deposit focus coupled with C&I lending emphasis ▪ Scalable, decentralized business model – Regional CEOs drive revenue ▪ Opportunistic expansion, attractive geographies – Teams of the best bankers in each metropolitan market ▪ Disciplined growth company that sets high standards for performance 4
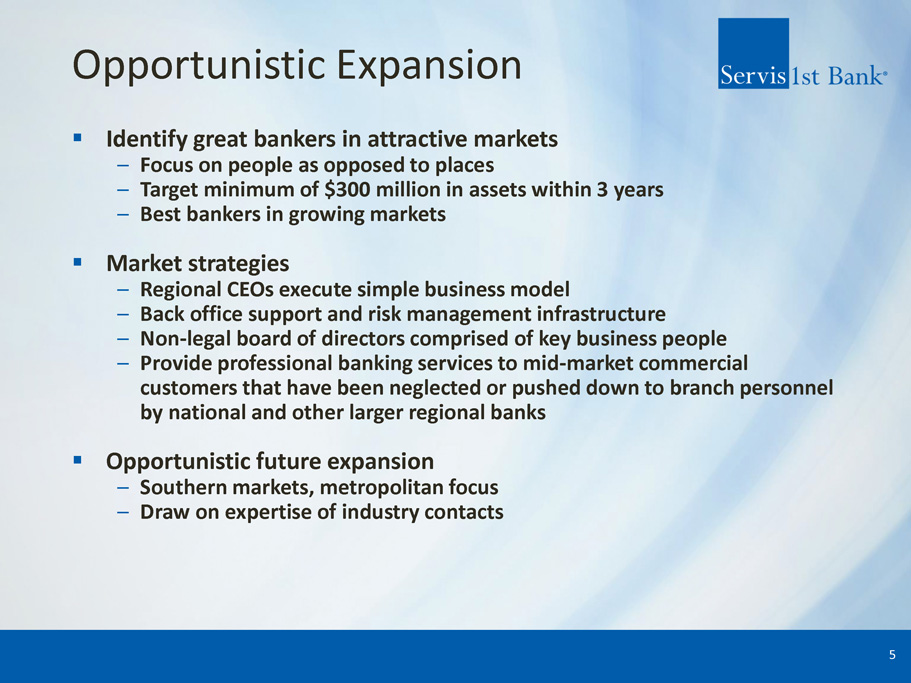
Opportunistic Expansion ▪ Identify great bankers in attractive markets – Focus on people as opposed to places – Target minimum of $300 million in assets within 3 years – Best bankers in growing markets ▪ Market strategies – Regional CEOs execute simple business model – Back office support and risk management infrastructure – Non - legal board of directors comprised of key business people – Provide professional banking services to mid - market commercial customers that have been neglected or pushed down to branch personnel by national and other larger regional banks ▪ Opportunistic future expansion – Southern markets, metropolitan focus – Draw on expertise of industry contacts 5
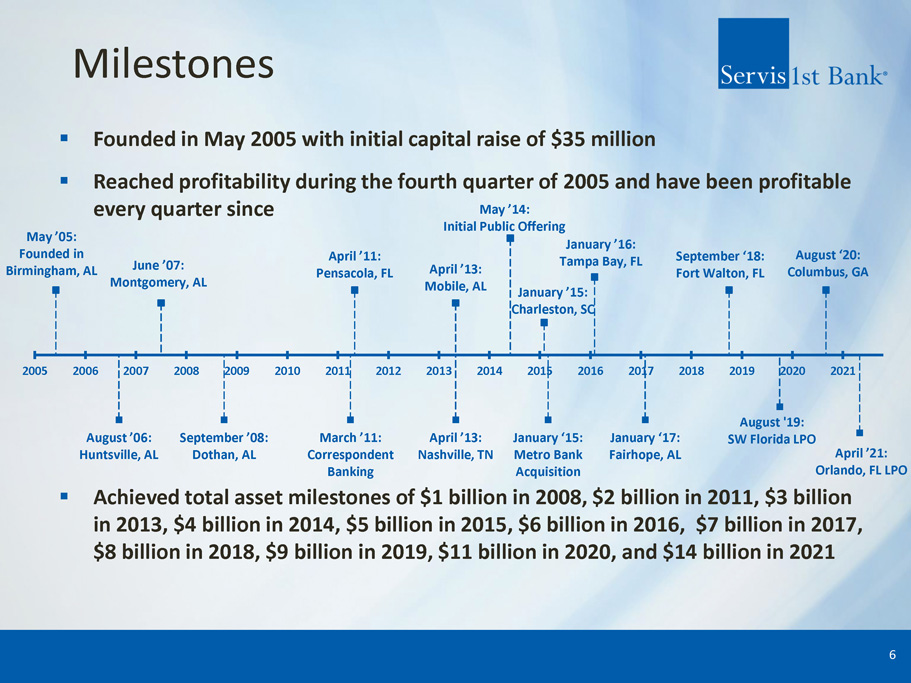
March ’11: Correspondent Banking April ’13: Nashville, TN January ‘15: Metro Bank Acquisition August ’06: Huntsville, AL September ’08: Dothan, AL January ‘17: Fairhope, AL August '19: SW Florida LPO April ’21: Orlando, FL LPO May ’05: Founded in Birmingham, AL June ’07: Montgomery, AL April ’11: Pensacola, FL April ’13: Mobile, AL May ’14: Initial Public Offering January ’15: Charleston, SC January ’16: Tampa Bay, FL September ‘18: Fort Walton, FL August ‘20: Columbus, GA 2005 2006 2007 2008 2009 2010 2011 2012 2013 2014 2015 2016 2017 2018 2019 2020 2021 Milestones 6 ▪ Founded in May 2005 with initial capital raise of $35 million ▪ Reached profitability during the fourth quarter of 2005 and have been profitable every quarter since ▪ Achieved total asset milestones of $1 billion in 2008, $2 billion in 2011, $3 billion in 2013, $4 billion in 2014, $5 billion in 2015, $6 billion in 2016, $7 billion in 2017, $8 billion in 2018, $9 billion in 2019, $11 billion in 2020, and $14 billion in 2021
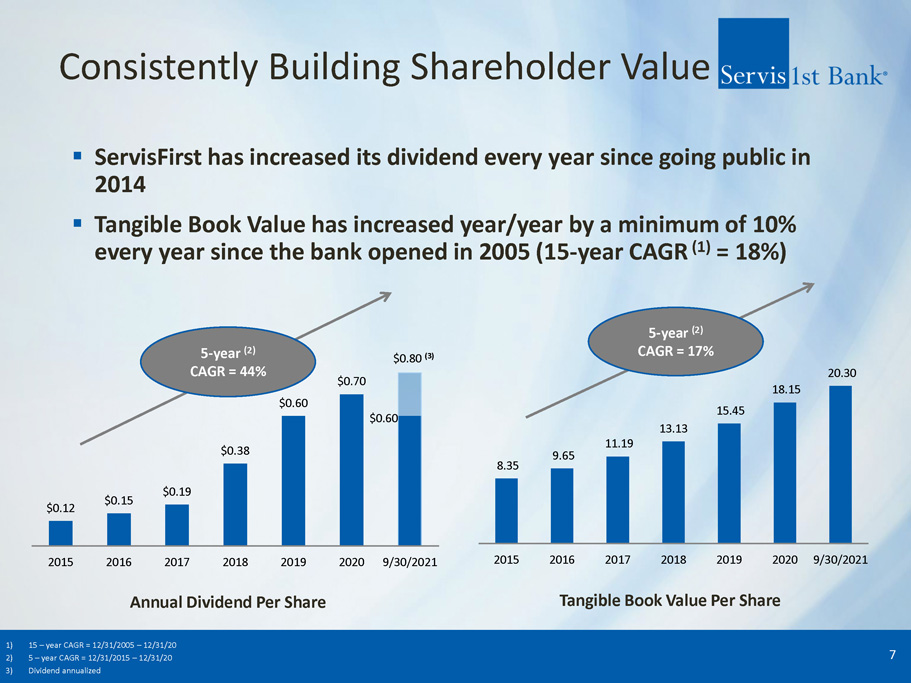
8.35 9.65 11.19 13.13 15.45 18.15 20.30 2015 2016 2017 2018 2019 2020 9/30/2021 $0.12 $0.15 $0.19 $0.38 $0.60 $0.70 $0.60 $ 0.8 0 (3) 2015 2016 2017 2018 2019 2020 9/30/2021 Consistently Building Shareholder Value ▪ ServisFirst has increased its dividend every year since going public in 2014 ▪ Tangible Book Value has increased year/year by a minimum of 10% every year since the bank opened in 2005 (15 - year CAGR (1) = 18%) 7 5 - year (2) CAGR = 44% 5 - year (2) CAGR = 17% Annual Dividend Per Share Tangible Book Value Per Share 1) 15 – year CAGR = 12/31/2005 – 12/31/20 2) 5 – year CAGR = 12/31/2015 – 12/31/20 3) Dividend annualized
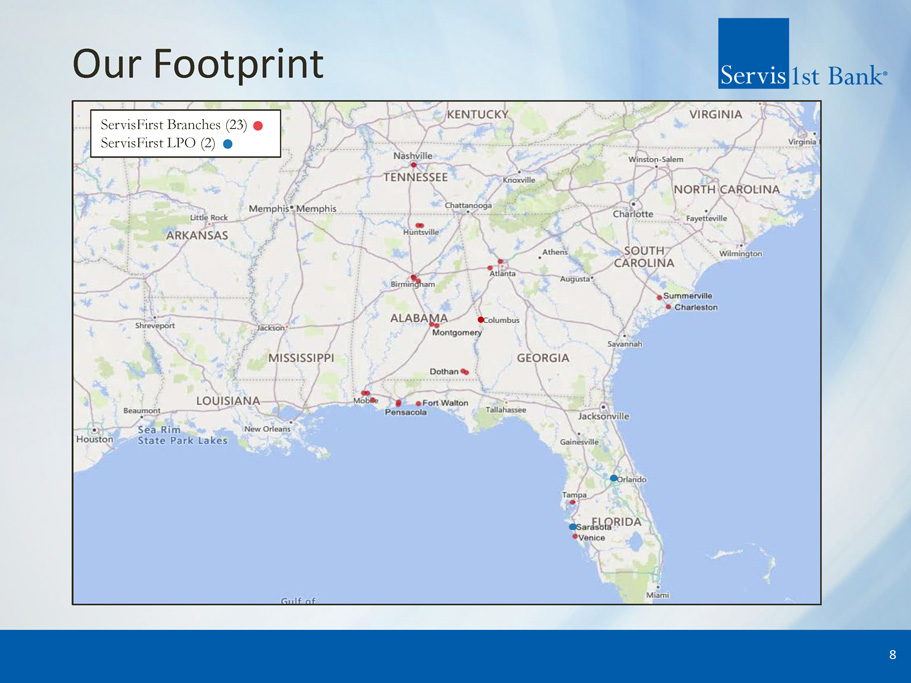
Our Footprint 8 ServisFirst Branches (23) ServisFirst LPO (2)
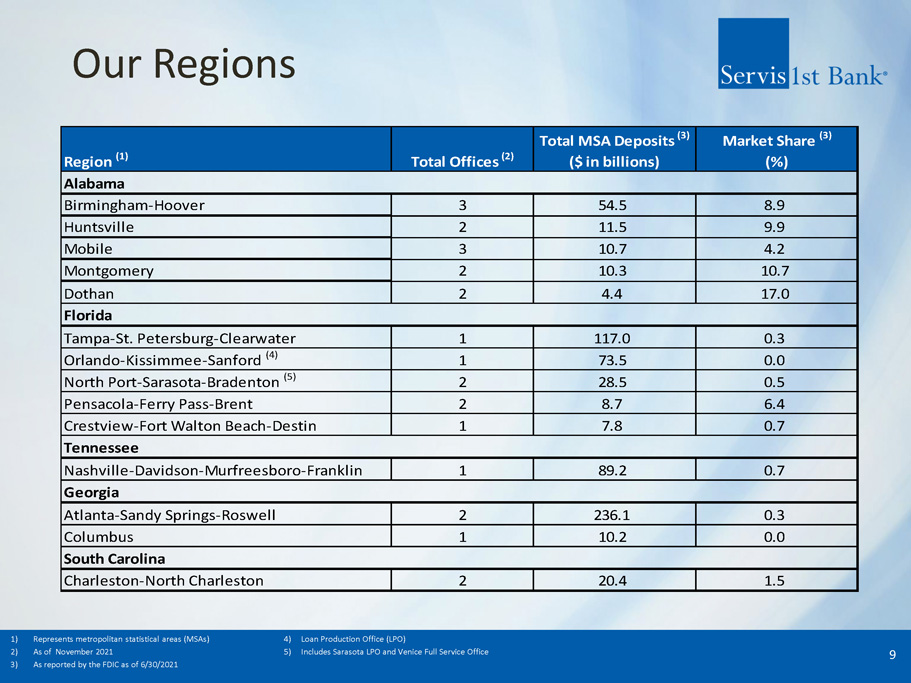
Our Regions 9 Total Offices (2) Total MSA Deposits (3) ($ in billions) Market Share (3) (%) 3 54.5 8.9 2 11.5 9.9 3 10.7 4.2 2 10.3 10.7 2 4.4 17.0 1 117.0 0.3 Orlando-Kissimmee-Sanford (4) 1 73.5 0.0 North Port-Sarasota-Bradenton (5) 2 28.5 0.5 2 8.7 6.4 Crestview-Fort Walton Beach-Destin 1 7.8 0.7 1 89.2 0.7 Atlanta-Sandy Springs-Roswell 2 236.1 0.3 Columbus 1 10.2 0.0 Charleston-North Charleston 2 20.4 1.5 Tampa-St. Petersburg-Clearwater Region (1) Birmingham-Hoover Huntsville Alabama Florida Mobile Dothan Montgomery Pensacola-Ferry Pass-Brent Tennessee Georgia South Carolina Nashville-Davidson-Murfreesboro-Franklin 1) Represents metropolitan statistical areas (MSAs) 4) Loan Production Office (LPO) 2) As of November 2021 5) Includes Sarasota LPO and Venice Full Service Office 3) As reported by the FDIC as of 6/30/2021
Our Business Model ▪ “Loan making and deposit taking” – Traditional commercial banking services – No emphasis on non - traditional business lines ▪ Culture of cost control – “Branch light,” with $575.2 million average deposits per banking center – Leverage technology and centralized infrastructure – Headcount focused on production and risk management – Key products; including remote deposit capture, cash management, remote currency manager – Outsource selected functions ▪ C&I lending expertise – 33% of gross loans – Target customers: privately held businesses $2 to $250 million in annual sales, professionals, affluent consumers 10
Scalable, Decentralized Structure ▪ Local decision - making – Emphasize local decision - making to drive customer revenue – Centralized, uniform risk management and support – Conservative local lending authorities, covers most lending decisions – Geographic organizational structure (as opposed to line of business structure) ▪ Regional CEOs empowered and held accountable – Utilize stock based compensation to align goals ▪ Top - down sales culture – Senior management actively involved in customer acquisition 11
Capacity For Growth ▪ Potential for significant growth in loan book size of current calling officers – Approximately 90% of the bank’s loan book is managed by approximately 50% of the bank’s calling officers – Average outstanding loan balances per officer as of 09/30/21 was $65 million – Strive for a minimum of $50 million in outstanding loans for every calling officer, resulting in approximately $2.7 billion in potential loan balances – Approximately 41% of calling officers manage loan books in excess of $50 million ▪ Focused on identifying motivated, customer service oriented bankers – Regularly meet with potential new bankers – Sustainable growth achieved through exceptional customer service which builds client loyalty and leads to customer referrals 12
Risk Management ▪ Manage risk centrally while delivering products and services by each Regional Bank ▪ Centralized/Consistent: operations, compliance, risk, accounting, audit, information technology, and credit administration ▪ Investing resources in Risk Management Group – Hired CRO in 2017; implemented enterprise risk management program – Invested in new technologies (BSA, information security, credit administration) – Enhanced staff and resources for risk, compliance, BSA, and credit administration – Increased scope of internal audits and independent loan reviews ▪ Management committees identify, monitor, and mitigate risks across enterprise ▪ Healthy Regulatory relations ▪ Independent loan portfolio stress testing performed regularly ▪ Correspondent Banking Division provides additional stable funding source 13
Risk Management Credit Process ▪ Lending focuses on middle market clients with Regional CEO and credit officers approving secured loan relationship up to $5MM; relationships greater than $5MM are approved by the CCO and/or members of executive management ▪ Centralized monitoring of ABL relationships greater than $2MM and centralized monitoring of commercial construction projects greater than $3MM ▪ Independent loan review examines 35% of the committed balances annually to affirm risk rating accuracy and proper documentation ▪ The top three industry exposures as of 9/30/21 are: Real Estate (28%), Healthcare & Social Assistance (11%) and Service Industry (10%). – The top three C&I portfolio industries are: Manufacturing (12%), Construction (11%), and Health Care & Social Assistance (10%) – C&I loans account for 33% of the total loan portfolio 14
Risk Management Credit Process ▪ The Bank does not lead any Share National Credits (SNCs); the Bank does participate in 10 relationships that are classified as SNCs with current balances of $100.8MM as of 9/30/21 ▪ As of 9/30/21, CRE as a percent of capital was 250% and AD&C as a percent of capital was 70% ▪ Approximately 88% of the Bank’s CRE loans are located in Bank’s five state footprint ▪ As of 9/30/21, variable rate loans account for 36% of the loan portfolio, excluding loans from the Paycheck Protection Program (PPP) – 42% of variable rate loans have a floor and the average floor rate is 4.06% ▪ The Bank’s average net credit loss from 2008 through 2010 was 52 basis points compared to a peer (1) average of 121 basis points 15 1) Peer Group 4 as defined by The Uniform Bank Performance Report (UBPR)
Impact From Crossing $10 Billion Asset Threshold ▪ Anticipate relatively small economic and regulatory impact due to our commercial banking focus and the staffing infrastructure put in place in recent years – The Durbin Amendment will limit debit card interchange fees ▪ Durbin Amendment will take effect on July 1, 2022 ▪ Anticipated loss of annual revenue is approximately $950,000 – Increased regulatory scrutiny and enhanced supervisory standards ▪ Recently adopted a formal enterprise risk management policy ▪ Ramped up compliance related staffing in recent years ▪ Increased capacity for asset/liability modeling and stress testing 16
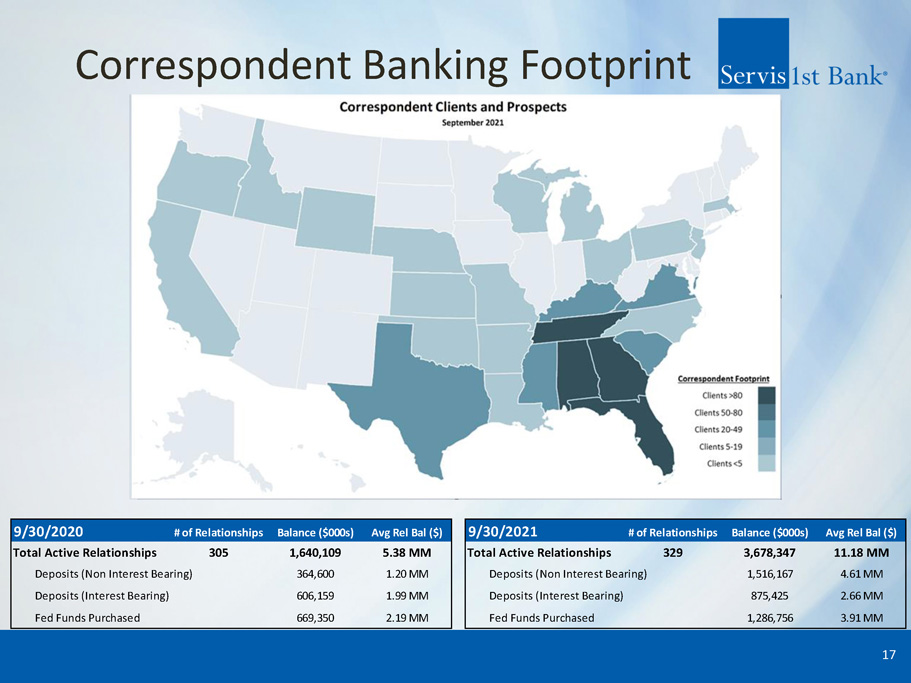
Correspondent Banking Footprint 17 9/30/2020 # of Relationships Balance ($000s) Avg Rel Bal ($) 9/30/2021 # of Relationships Balance ($000s) Avg Rel Bal ($) Total Active Relationships 305 1,640,109 5.38 MM Total Active Relationships 329 3,678,347 11.18 MM Deposits (Non Interest Bearing) 364,600 1.20 MM Deposits (Non Interest Bearing) 1,516,167 4.61 MM Deposits (Interest Bearing) 606,159 1.99 MM Deposits (Interest Bearing) 875,425 2.66 MM Fed Funds Purchased 669,350 2.19 MM Fed Funds Purchased 1,286,756 3.91 MM
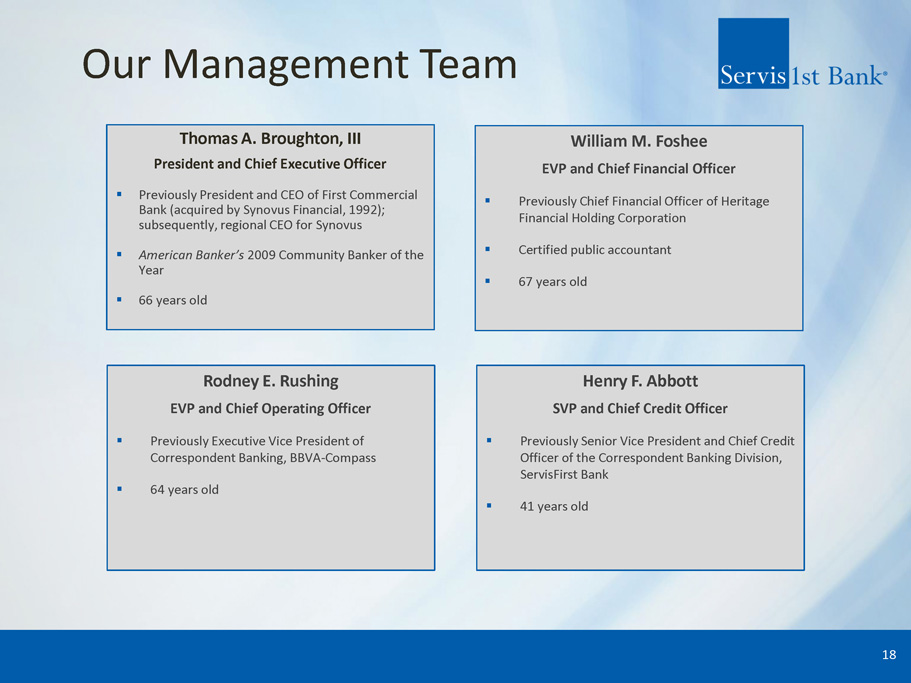
Our Management Team Thomas A. Broughton, III President and Chief Executive Officer ▪ Previously President and CEO of First Commercial Bank (acquired by Synovus Financial, 1992); subsequently, regional CEO for Synovus ▪ American Banker’s 2009 Community Banker of the Year ▪ 66 years old William M. Foshee EVP and Chief Financial Officer ▪ Previously Chief Financial Officer of Heritage Financial Holding Corporation ▪ Certified public accountant ▪ 67 years old Rodney E. Rushing EVP and Chief Operating Officer ▪ Previously Executive Vice President of Correspondent Banking, BBVA - Compass ▪ 64 years old Henry F. Abbott SVP and Chief Credit Officer ▪ Previously Senior Vice President and Chief Credit Officer of the Correspondent Banking Division, ServisFirst Bank ▪ 41 years old 18
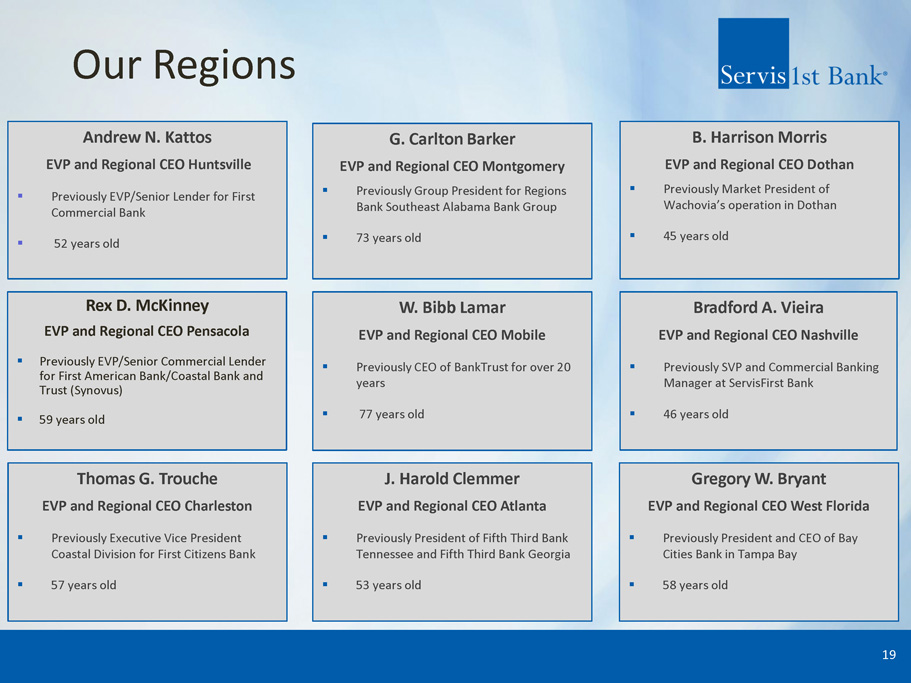
Our Regions Rex D. McKinney EVP and Regional CEO Pensacola ▪ Previously EVP/Senior Commercial Lender for First American Bank/Coastal Bank and Trust ( Synovus ) ▪ 59 years old Andrew N. Kattos EVP and Regional CEO Huntsville ▪ Previously EVP/Senior Lender for First Commercial Bank ▪ 52 years old J. Harold Clemmer EVP and Regional CEO Atlanta ▪ Previously President of Fifth Third Bank Tennessee and Fifth Third Bank Georgia ▪ 53 years old W. Bibb Lamar EVP and Regional CEO Mobile ▪ Previously CEO of BankTrust for over 20 years ▪ 77 years old G. Carlton Barker EVP and Regional CEO Montgomery ▪ Previously Group President for Regions Bank Southeast Alabama Bank Group ▪ 73 years old B. Harrison Morris EVP and Regional CEO Dothan ▪ Previously Market President of Wachovia’s operation in Dothan ▪ 45 years old Gregory W. Bryant EVP and Regional CEO West Florida ▪ Previously President and CEO of Bay Cities Bank in Tampa Bay ▪ 58 years old Thomas G. Trouche EVP and Regional CEO Charleston ▪ Previously Executive Vice President Coastal Division for First Citizens Bank ▪ 57 years old Bradford A. Vieira EVP and Regional CEO Nashville ▪ Previously SVP and Commercial Banking Manager at ServisFirst Bank ▪ 46 years old 19

Financial Results
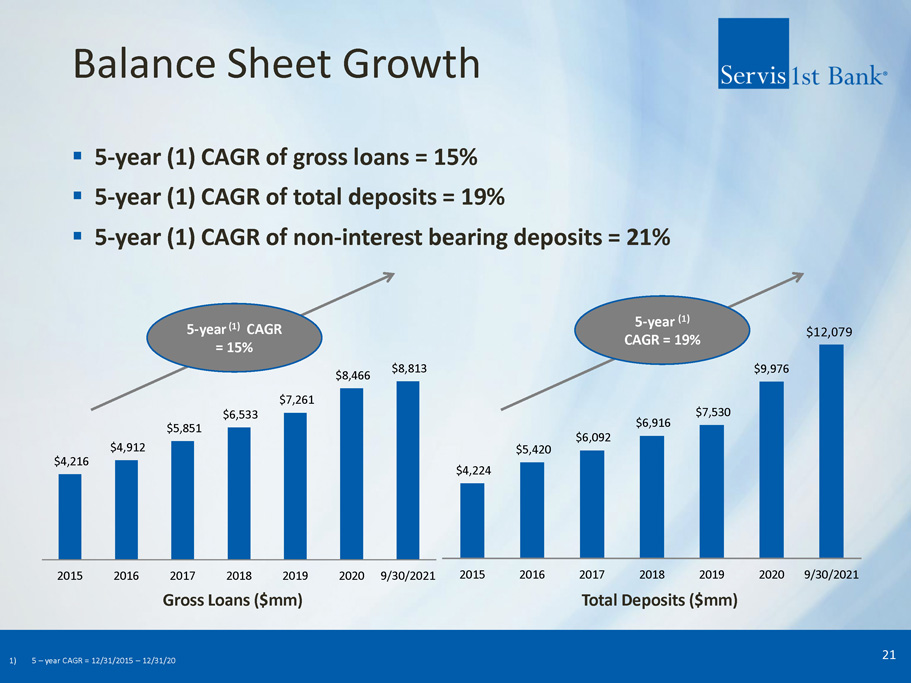
$4,224 $5,420 $6,092 $6,916 $7,530 $9,976 2015 2016 2017 2018 2019 2020 9/30/2021 $12,079 Balance Sheet Growth ▪ 5 - year (1) CAGR of gross loans = 15% ▪ 5 - year (1) CAGR of total deposits = 19% ▪ 5 - year (1) CAGR of non - interest bearing deposits = 21% 21 5 - year (1) CAGR = 15% 5 - year (1) CAGR = 19% Gross Loans ($mm) Total Deposits ($mm) $4,216 $4,912 $5,851 $6,533 $7,261 $8,466 $8,813 2015 2016 2017 2018 2019 2020 9/30/2021 1) 5 – year CAGR = 12/31/2015 – 12/31/20
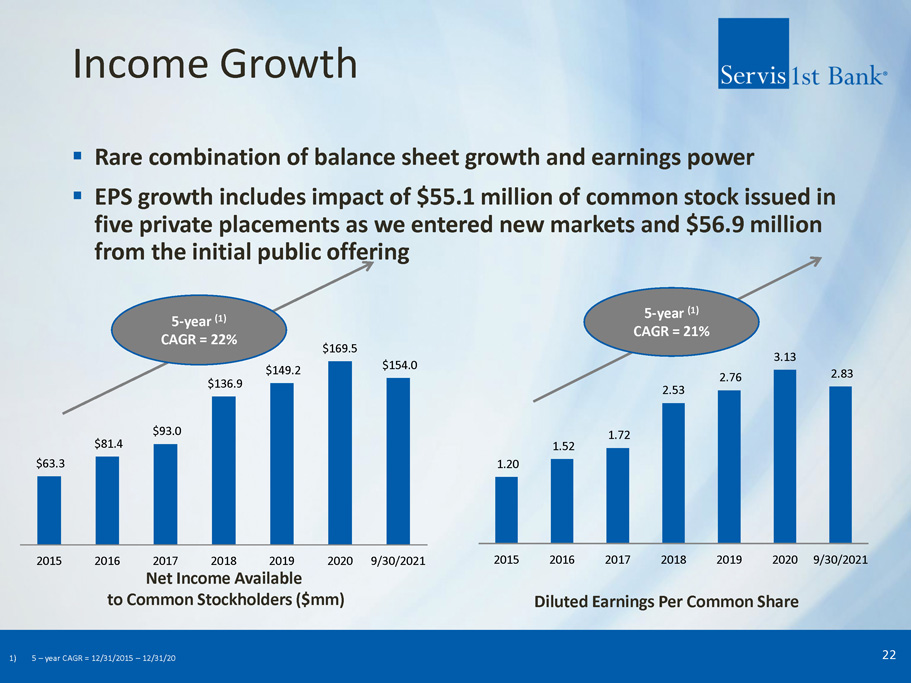
1.20 1.52 1.72 2.53 2.76 3.13 2.83 2015 2016 2017 2018 2019 2020 9/30/2021 $63.3 $81.4 $93.0 $136.9 $149.2 $169.5 $154.0 2015 2016 2017 2018 2019 2020 9/30/2021 Income Growth ▪ Rare combination of balance sheet growth and earnings power ▪ EPS growth includes impact of $55.1 million of common stock issued in five private placements as we entered new markets and $56.9 million from the initial public offering 22 5 - year (1) CAGR = 22% 5 - year (1) CAGR = 21% Net Income Available to Common Stockholders ($mm) Diluted Earnings Per Common Share 1) 5 – year CAGR = 12/31/2015 – 12/31/20
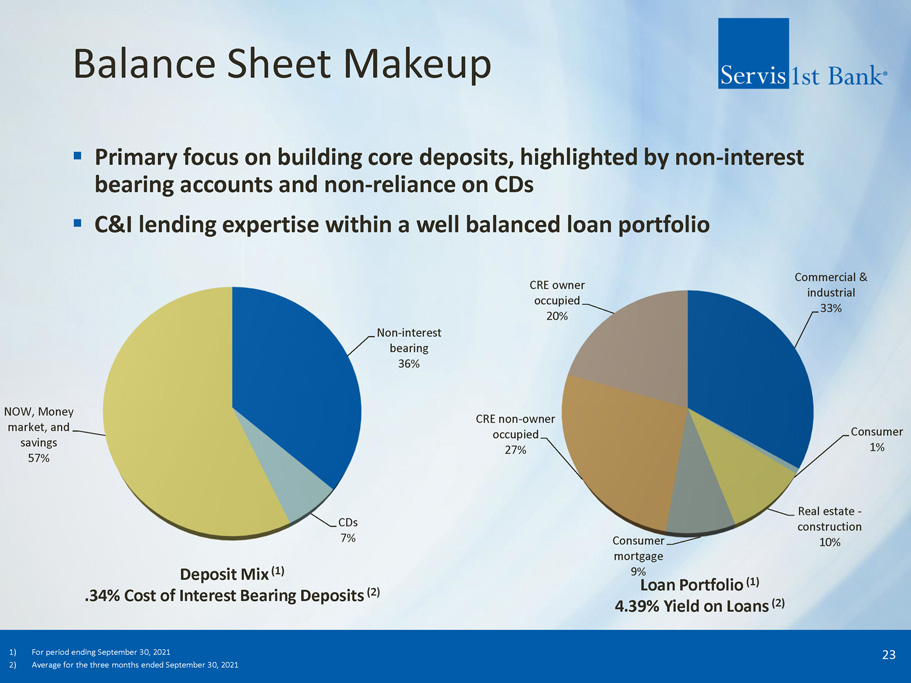
Balance Sheet Makeup ▪ Primary focus on building core deposits, highlighted by non - interest bearing accounts and non - reliance on CDs ▪ C&I lending expertise within a well balanced loan portfolio 23 Deposit Mix (1) .34% Cost of Interest Bearing Deposits (2 ) Loan Portfolio (1) 4.39% Yield on Loans (2) 1) For period ending September 30, 2021 2) Average for the three months ended September 30, 2021 Non - interest bearing 36% CDs 7% NOW, Money market, and savings 57% Commercial & industrial 33% Consumer 1% Real estate - construction 10% Consumer mortgage 9% CRE non - owner occupied 27% CRE owner occupied 20%
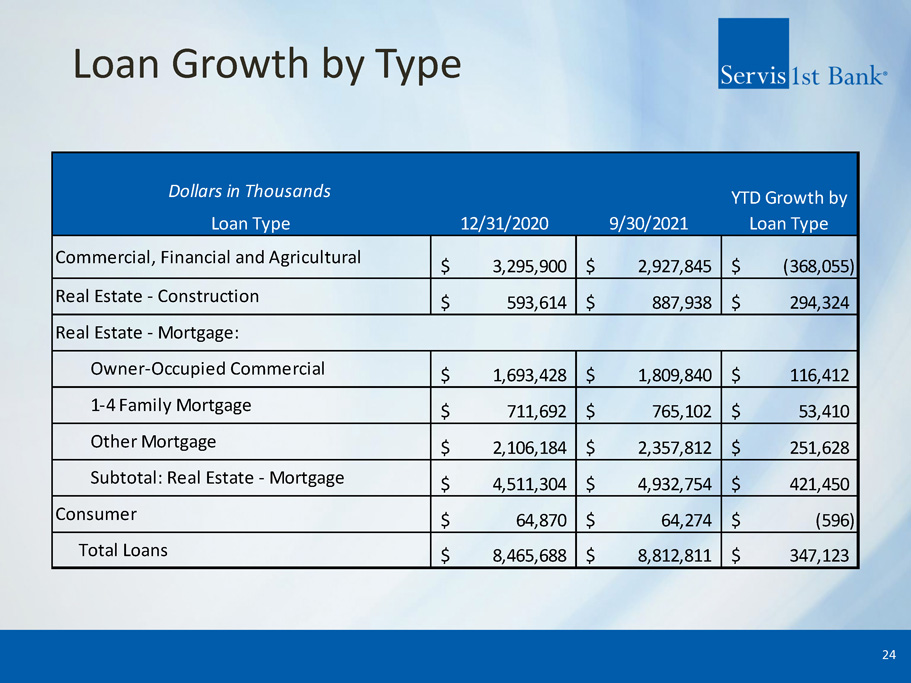
Loan Growth by Type 24 Dollars in Thousands Loan Type 12/31/2020 9/30/2021 3,295,900$ 2,927,845$ (368,055)$ 593,614$ 887,938$ 294,324$ 1,693,428$ 1,809,840$ 116,412$ 711,692$ 765,102$ 53,410$ 2,106,184$ 2,357,812$ 251,628$ 4,511,304$ 4,932,754$ 421,450$ 64,870$ 64,274$ (596)$ 8,465,688$ 8,812,811$ 347,123$ Total Loans YTD Growth by Loan Type Commercial, Financial and Agricultural Real Estate - Construction Consumer Owner-Occupied Commercial 1-4 Family Mortgage Other Mortgage Subtotal: Real Estate - Mortgage Real Estate - Mortgage:
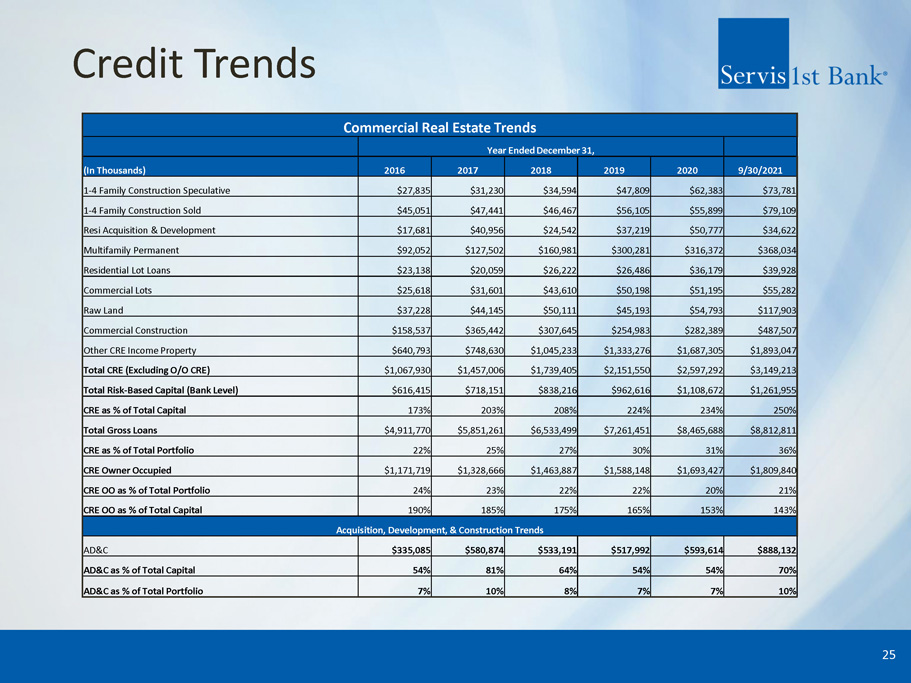
Credit Trends 25 Commercial Real Estate Trends Year Ended December 31, (In Thousands) 2016 2017 2018 2019 2020 9/30/2021 1 - 4 Family Construction Speculative $27,835 $31,230 $34,594 $47,809 $62,383 $73,781 1 - 4 Family Construction Sold $45,051 $47,441 $46,467 $56,105 $55,899 $79,109 Resi Acquisition & Development $17,681 $40,956 $24,542 $37,219 $50,777 $34,622 Multifamily Permanent $92,052 $127,502 $160,981 $300,281 $316,372 $368,034 Residential Lot Loans $23,138 $20,059 $26,222 $26,486 $36,179 $39,928 Commercial Lots $25,618 $31,601 $43,610 $50,198 $51,195 $55,282 Raw Land $37,228 $44,145 $50,111 $45,193 $54,793 $117,903 Commercial Construction $158,537 $365,442 $307,645 $254,983 $282,389 $487,507 Other CRE Income Property $640,793 $748,630 $1,045,233 $1,333,276 $1,687,305 $1,893,047 Total CRE (Excluding O/O CRE) $1,067,930 $1,457,006 $1,739,405 $2,151,550 $2,597,292 $3,149,213 Total Risk - Based Capital (Bank Level) $616,415 $718,151 $838,216 $962,616 $1,108,672 $1,261,955 CRE as % of Total Capital 173% 203% 208% 224% 234% 250% Total Gross Loans $4,911,770 $5,851,261 $6,533,499 $7,261,451 $8,465,688 $8,812,811 CRE as % of Total Portfolio 22% 25% 27% 30% 31% 36% CRE Owner Occupied $1,171,719 $1,328,666 $1,463,887 $1,588,148 $1,693,427 $1,809,840 CRE OO as % of Total Portfolio 24% 23% 22% 22% 20% 21% CRE OO as % of Total Capital 190% 185% 175% 165% 153% 143% Acquisition, Development, & Construction Trends AD&C $335,085 $580,874 $533,191 $517,992 $593,614 $888,132 AD&C as % of Total Capital 54% 81% 64% 54% 54% 70% AD&C as % of Total Portfolio 7% 10% 8% 7% 7% 10%
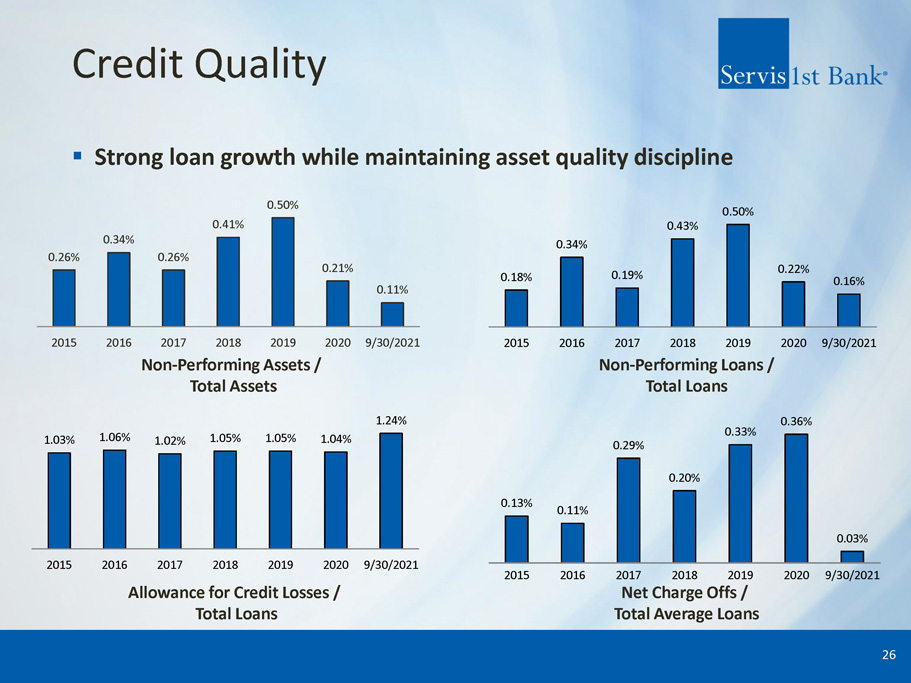
Credit Quality ▪ Strong loan growth while maintaining asset quality discipline 26 Allowance for Credit Losses / Total Loans Net Charge Offs / Total Average Loans Non - Performing Assets / Total Assets Non - Performing Loans / Total Loans 0.26% 0.34% 0.26% 0.41% 0.50% 0.21% 0.11% 2015 2016 2017 2018 2019 2020 9/30/2021 0.18% 0.34% 0.19% 0.43% 0.50% 0.22% 0.16% 2015 2016 2017 2018 2019 2020 9/30/2021 0.13% 0.11% 0.29% 0.20% 0.33% 0.36% 0.03% 2015 2016 2017 2018 2019 2020 9/30/2021 1.03% 1.06% 1.02% 1.05% 1.05% 1.04% 1.24% 2015 2016 2017 2018 2019 2020 9/30/2021
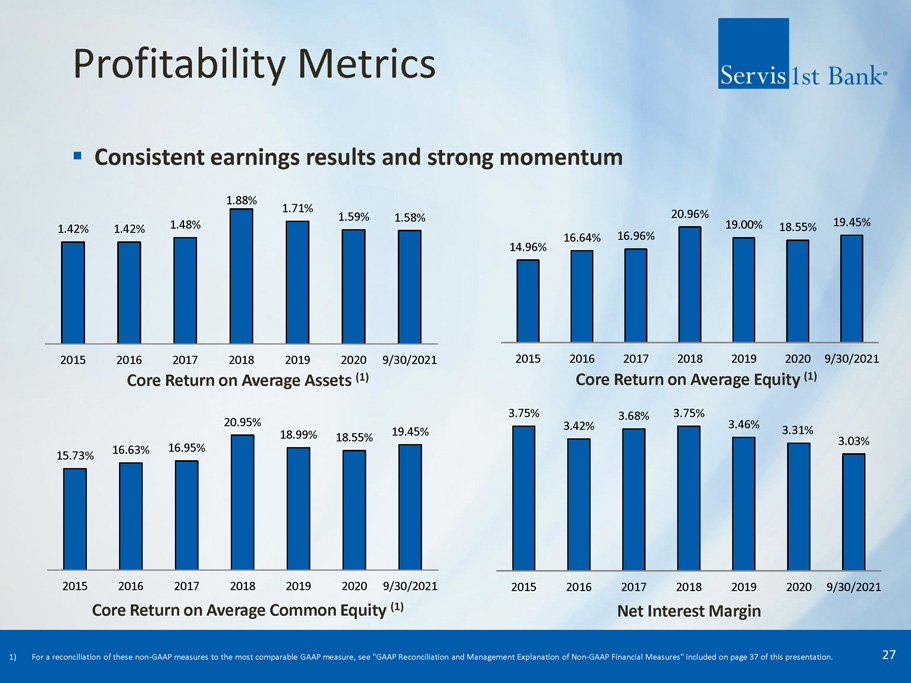
Profitability Metrics ▪ Consistent earnings results and strong momentum 27 Core Return on Average Assets (1) Core Return on Average Equity (1) Core Return on Average Common Equity (1) Net Interest Margin 1) For a reconciliation of these non - GAAP measures to the most comparable GAAP measure, see "GAAP Reconciliation and Management Exp lanation of Non - GAAP Financial Measures" included on page 37 of this presentation. 1.42% 1.42% 1.48% 1.88% 1.71% 1.59% 1.58% 2015 2016 2017 2018 2019 2020 9/30/2021 15.73% 16.63% 16.95% 20.95% 18.99% 18.55% 19.45% 2015 2016 2017 2018 2019 2020 9/30/2021 3.75% 3.42% 3.68% 3.75% 3.46% 3.31% 3.03% 2015 2016 2017 2018 2019 2020 9/30/2021 14.96% 16.64% 16.96% 20.96% 19.00% 18.55% 19.45% 2015 2016 2017 2018 2019 2020 9/30/2021
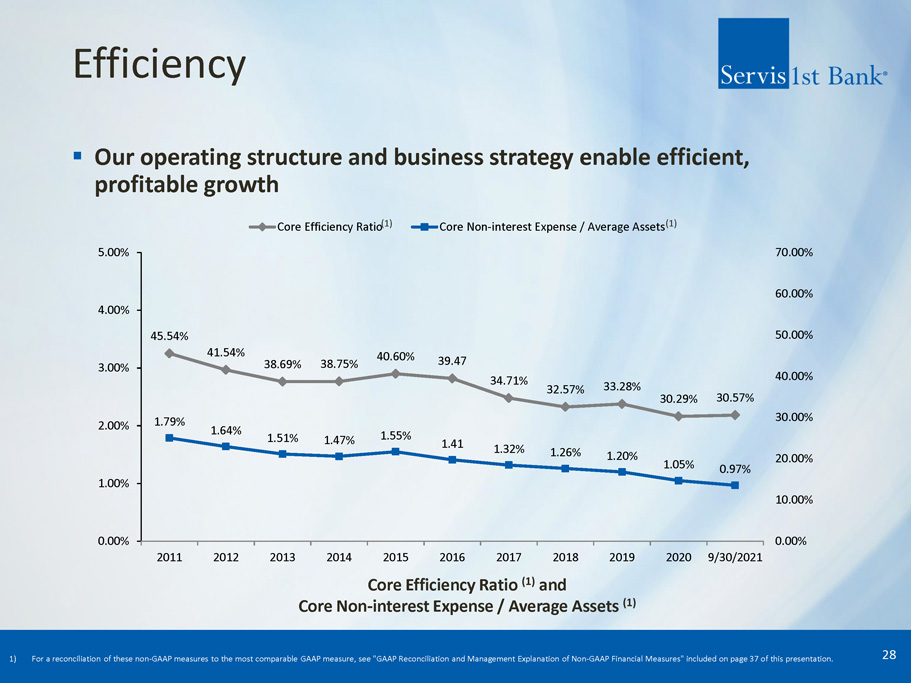
45.54% 41.54% 38.69% 38.75% 40.60% 39.47 34.71% 32.57% 33.28% 30.29% 30.57% 1.79% 1.64% 1.51% 1.47% 1.55% 1.41 1.32% 1.26% 1.20% 1.05% 0.97% 0.00% 1.00% 2.00% 3.00% 4.00% 5.00% 2011 2012 2013 2014 2015 2016 2017 2018 2019 2020 9/30/2021 0.00% 10.00% 20.00% 30.00% 40.00% 50.00% 60.00% 70.00% Core Efficiency Ratio Core Non-interest Expense / Average Assets Efficiency ▪ Our operating structure and business strategy enable efficient, profitable growth 28 Core Efficiency Ratio (1) and Core Non - interest Expense / Average Assets (1) (1) (1) 1) For a reconciliation of these non - GAAP measures to the most comparable GAAP measure, see "GAAP Reconciliation and Management Explanation of Non - GAAP Financial Measures" included on page 37 of this presentation .
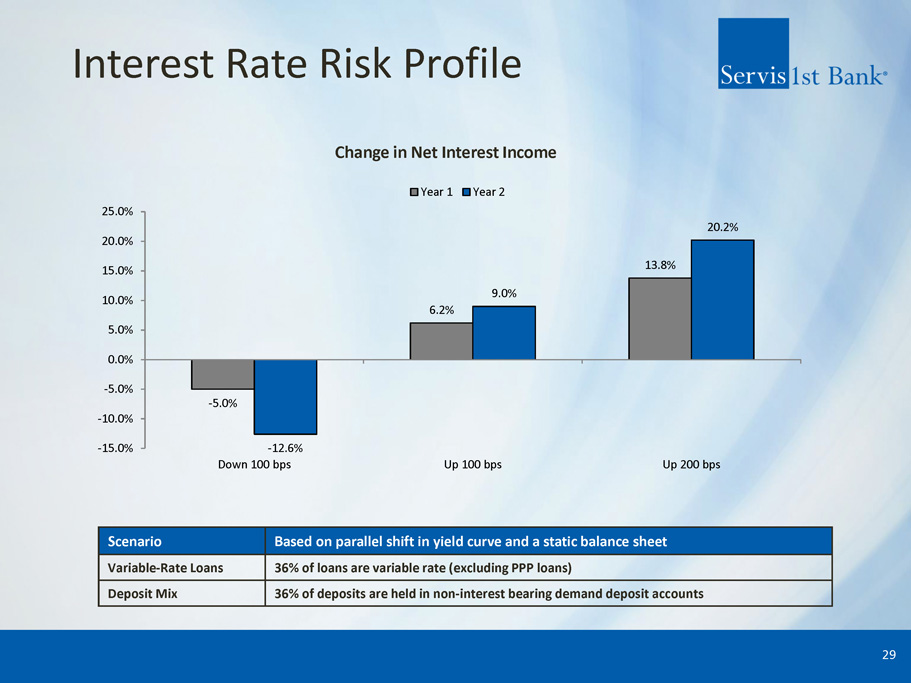
Interest Rate Risk Profile 29 Change in Net Interest Income Scenario Based on parallel shift in yield curve and a static balance sheet Variable - Rate Loans 36% of loans are variable rate (excluding PPP loans) Deposit Mix 36% of deposits are held in non - interest bearing demand deposit accounts - 5.0% 6.2% 13.8% - 12.6% 9.0% 20.2% -15.0% -10.0% -5.0% 0.0% 5.0% 10.0% 15.0% 20.0% 25.0% Down 100 bps Up 100 bps Up 200 bps Year 1 Year 2

Appendix
Our Regions: Centers for Continued Growth ▪ Birmingham, Alabama – Key Industries : Metals manufacturing, finance, insurance, healthcare services and distribution – Key Employers : Protective Life, Encompass Health, Vulcan Materials Company, AT&T, American Cast Iron Pipe Company, Southern Company, and University of Alabama at Birmingham ▪ Huntsville, Alabama – Key Industries : U.S. government, aerospace/defense, commercial and university research – Key Employers : U.S. Army/Redstone Arsenal, Boeing Company, NASA/Marshall Space Flight Center, Intergraph Corporation, ADTRAN, Northrop Grumman, Technicolor, SAIC, DirecTV, Lockheed Martin, and Toyota Motor Manufacturing ▪ Montgomery, Alabama – Key Industries : U.S. and state government, U.S. Air Force , automotive manufacturing – Key Employers : Maxwell Gunter Air Force Base, State of Alabama, Baptist Health Systems, Hyundai Motor Manufacturing, and MOBIS Alabama 31
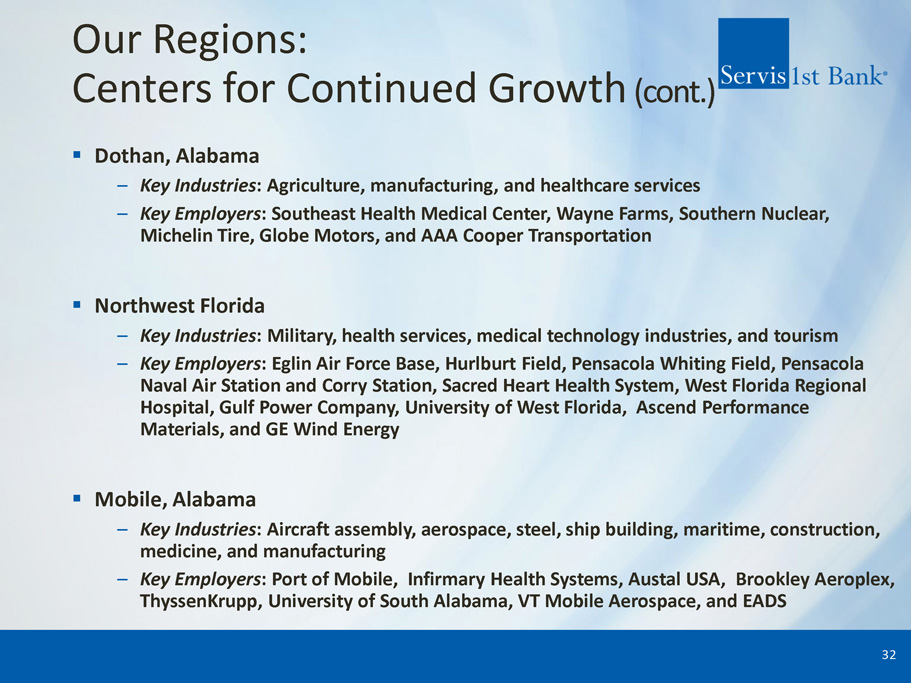
Our Regions: Centers for Continued Growth (cont.) ▪ Dothan, Alabama – Key Industries : Agriculture, manufacturing, and healthcare services – Key Employers : Southeast Health Medical Center, Wayne Farms, Southern Nuclear, Michelin Tire, Globe Motors, and AAA Cooper Transportation ▪ Northwest Florida – Key Industries : Military, health services, medical technology industries, and tourism – Key Employers : Eglin Air Force Base, Hurlburt Field, Pensacola Whiting Field, Pensacola Naval Air Station and Corry Station, Sacred Heart Health System, West Florida Regional Hospital, Gulf Power Company, University of West Florida, Ascend Performance Materials, and GE Wind Energy ▪ Mobile, Alabama – Key Industries : Aircraft assembly, aerospace, steel, ship building, maritime, construction, medicine, and manufacturing – Key Employers : Port of Mobile, Infirmary Health Systems, Austal USA, Brookley Aeroplex , ThyssenKrupp, University of South Alabama, VT Mobile Aerospace, and EADS 32
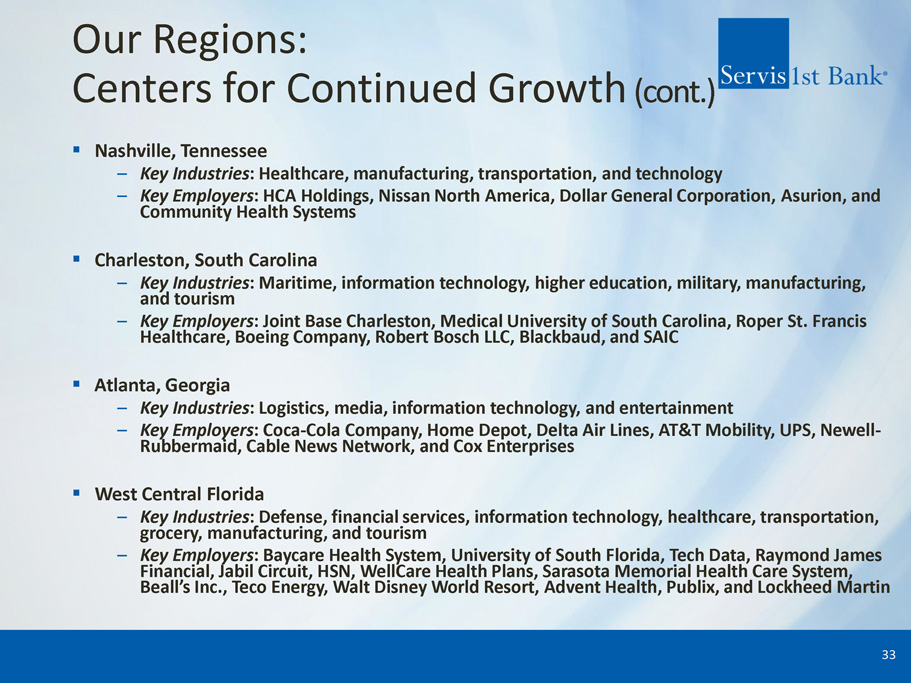
Our Regions: Centers for Continued Growth (cont.) ▪ Nashville, Tennessee – Key Industries : Healthcare, manufacturing, transportation, and technology – Key Employers : HCA Holdings, Nissan North America, Dollar General Corporation, Asurion , and Community Health Systems ▪ Charleston, South Carolina – Key Industries : Maritime, information technology, higher education, military, manufacturing, and tourism – Key Employers : Joint Base Charleston, Medical University of South Carolina, Roper St. Francis Healthcare, Boeing Company, Robert Bosch LLC, Blackbaud , and SAIC ▪ Atlanta, Georgia – Key Industries : Logistics, media, information technology, and entertainment – Key Employers : Coca - Cola Company, Home Depot, Delta Air Lines, AT&T Mobility, UPS, Newell - Rubbermaid, Cable News Network, and Cox Enterprises ▪ West Central Florida – Key Industries : Defense, financial services, information technology, healthcare, transportation, grocery, manufacturing, and tourism – Key Employers : Baycare Health System, University of South Florida, Tech Data, Raymond James Financial, Jabil Circuit, HSN, WellCare Health Plans, Sarasota Memorial Health Care System, Beall’s Inc., Teco Energy, Walt Disney World Resort, Advent Health, Publix, and Lockheed Martin 33
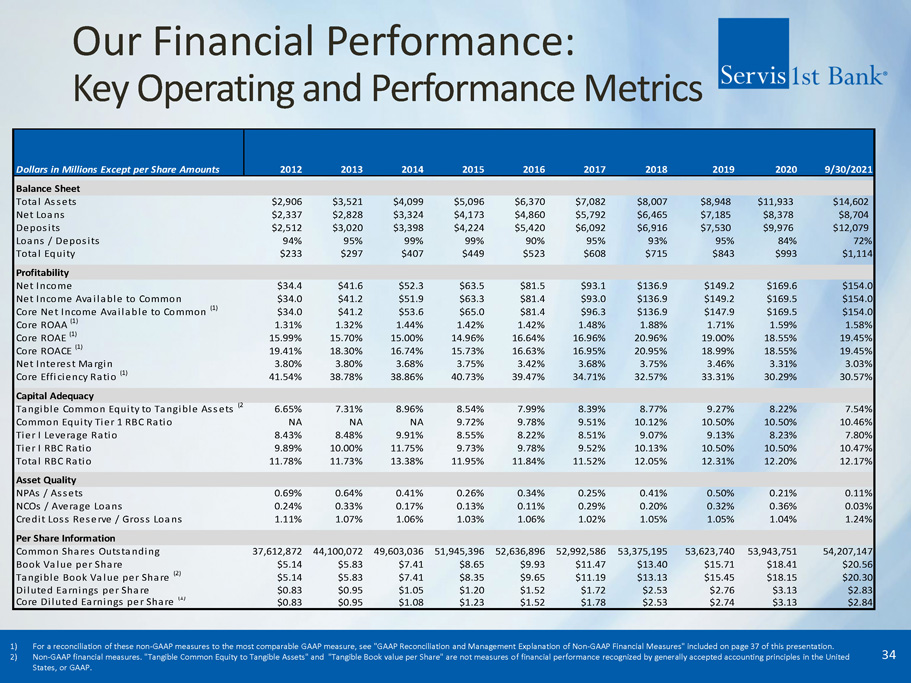
Our Financial Performance: Key Operating and Performance Metrics 34 1) For a reconciliation of these non - GAAP measures to the most comparable GAAP measure, see "GAAP Reconciliation and Management Exp lanation of Non - GAAP Financial Measures" included on page 37 of this presentation. 2) Non - GAAP financial measures. "Tangible Common Equity to Tangible Assets" and "Tangible Book value per Share" are not measures o f financial performance recognized by generally accepted accounting principles in the United States, or GAAP. 2012 2013 2014 2015 2016 2017 2018 2019 2020 9/30/2021 Balance Sheet Total Assets $2,906 $3,521 $4,099 $5,096 $6,370 $7,082 $8,007 $8,948 $11,933 $14,602 Net Loans $2,337 $2,828 $3,324 $4,173 $4,860 $5,792 $6,465 $7,185 $8,378 $8,704 Deposits $2,512 $3,020 $3,398 $4,224 $5,420 $6,092 $6,916 $7,530 $9,976 $12,079 Loans / Deposits 94% 95% 99% 99% 90% 95% 93% 95% 84% 72% Total Equity $233 $297 $407 $449 $523 $608 $715 $843 $993 $1,114 Profitability Net Income $34.4 $41.6 $52.3 $63.5 $81.5 $93.1 $136.9 $149.2 $169.6 $154.0 Net Income Available to Common $34.0 $41.2 $51.9 $63.3 $81.4 $93.0 $136.9 $149.2 $169.5 $154.0 Core Net Income Available to Common (1) $34.0 $41.2 $53.6 $65.0 $81.4 $96.3 $136.9 $147.9 $169.5 $154.0 Core ROAA (1) 1.31% 1.32% 1.44% 1.42% 1.42% 1.48% 1.88% 1.71% 1.59% 1.58% Core ROAE (1) 15.99% 15.70% 15.00% 14.96% 16.64% 16.96% 20.96% 19.00% 18.55% 19.45% Core ROACE (1) 19.41% 18.30% 16.74% 15.73% 16.63% 16.95% 20.95% 18.99% 18.55% 19.45% Net Interest Margin 3.80% 3.80% 3.68% 3.75% 3.42% 3.68% 3.75% 3.46% 3.31% 3.03% Core Efficiency Ratio (1) 41.54% 38.78% 38.86% 40.73% 39.47% 34.71% 32.57% 33.31% 30.29% 30.57% Capital Adequacy Tangible Common Equity to Tangible Assets (2) 6.65% 7.31% 8.96% 8.54% 7.99% 8.39% 8.77% 9.27% 8.22% 7.54% Common Equity Tier 1 RBC Ratio NA NA NA 9.72% 9.78% 9.51% 10.12% 10.50% 10.50% 10.46% Tier I Leverage Ratio 8.43% 8.48% 9.91% 8.55% 8.22% 8.51% 9.07% 9.13% 8.23% 7.80% Tier I RBC Ratio 9.89% 10.00% 11.75% 9.73% 9.78% 9.52% 10.13% 10.50% 10.50% 10.47% Total RBC Ratio 11.78% 11.73% 13.38% 11.95% 11.84% 11.52% 12.05% 12.31% 12.20% 12.17% Asset Quality NPAs / Assets 0.69% 0.64% 0.41% 0.26% 0.34% 0.25% 0.41% 0.50% 0.21% 0.11% NCOs / Average Loans 0.24% 0.33% 0.17% 0.13% 0.11% 0.29% 0.20% 0.32% 0.36% 0.03% Credit Loss Reserve / Gross Loans 1.11% 1.07% 1.06% 1.03% 1.06% 1.02% 1.05% 1.05% 1.04% 1.24% Per Share Information Common Shares Outstanding 37,612,872 44,100,072 49,603,036 51,945,396 52,636,896 52,992,586 53,375,195 53,623,740 53,943,751 54,207,147 Book Value per Share $5.14 $5.83 $7.41 $8.65 $9.93 $11.47 $13.40 $15.71 $18.41 $20.56 Tangible Book Value per Share (2) $5.14 $5.83 $7.41 $8.35 $9.65 $11.19 $13.13 $15.45 $18.15 $20.30 Diluted Earnings per Share $0.83 $0.95 $1.05 $1.20 $1.52 $1.72 $2.53 $2.76 $3.13 $2.83 Core Diluted Earnings per Share (1) $0.83 $0.95 $1.08 $1.23 $1.52 $1.78 $2.53 $2.74 $3.13 $2.84 Dollars in Millions Except per Share Amounts
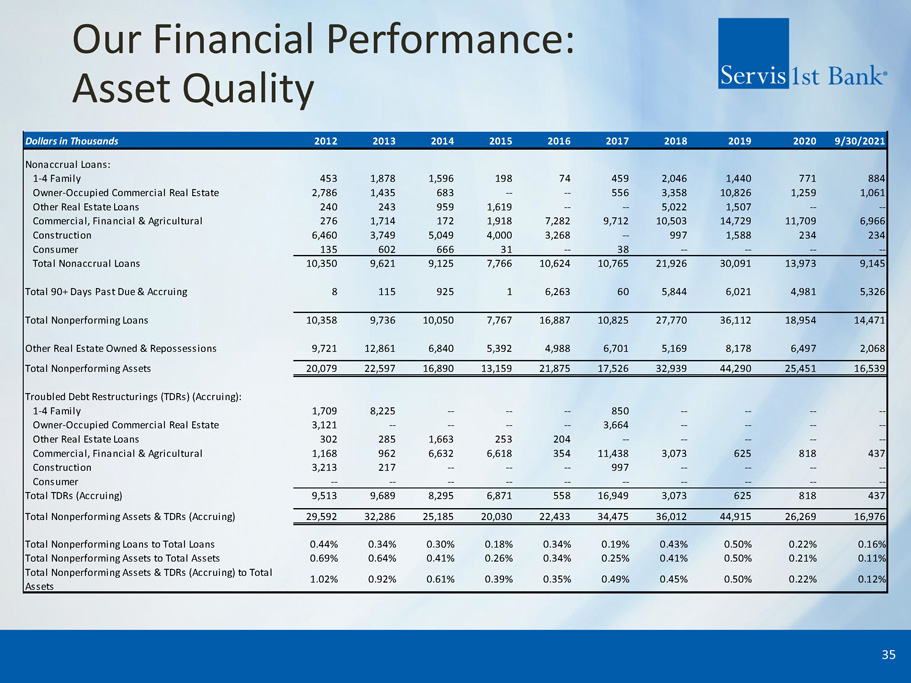
Our Financial Performance: Asset Quality 35 Dollars in Thousands 2012 2013 2014 2015 2016 2017 2018 2019 2020 9/30/2021 Nonaccrual Loans: 1-4 Family 453 1,878 1,596 198 74 459 2,046 1,440 771 884 Owner-Occupied Commercial Real Estate 2,786 1,435 683 -- -- 556 3,358 10,826 1,259 1,061 Other Real Estate Loans 240 243 959 1,619 -- -- 5,022 1,507 -- -- Commercial, Financial & Agricultural 276 1,714 172 1,918 7,282 9,712 10,503 14,729 11,709 6,966 Construction 6,460 3,749 5,049 4,000 3,268 -- 997 1,588 234 234 Consumer 135 602 666 31 -- 38 -- -- -- -- Total Nonaccrual Loans 10,350 9,621 9,125 7,766 10,624 10,765 21,926 30,091 13,973 9,145 Total 90+ Days Past Due & Accruing 8 115 925 1 6,263 60 5,844 6,021 4,981 5,326 Total Nonperforming Loans 10,358 9,736 10,050 7,767 16,887 10,825 27,770 36,112 18,954 14,471 Other Real Estate Owned & Repossessions 9,721 12,861 6,840 5,392 4,988 6,701 5,169 8,178 6,497 2,068 Total Nonperforming Assets 20,079 22,597 16,890 13,159 21,875 17,526 32,939 44,290 25,451 16,539 Troubled Debt Restructurings (TDRs) (Accruing): 1-4 Family 1,709 8,225 -- -- -- 850 -- -- -- -- Owner-Occupied Commercial Real Estate 3,121 -- -- -- -- 3,664 -- -- -- -- Other Real Estate Loans 302 285 1,663 253 204 -- -- -- -- -- Commercial, Financial & Agricultural 1,168 962 6,632 6,618 354 11,438 3,073 625 818 437 Construction 3,213 217 -- -- -- 997 -- -- -- -- Consumer -- -- -- -- -- -- -- -- -- -- Total TDRs (Accruing) 9,513 9,689 8,295 6,871 558 16,949 3,073 625 818 437 Total Nonperforming Assets & TDRs (Accruing) 29,592 32,286 25,185 20,030 22,433 34,475 36,012 44,915 26,269 16,976 Total Nonperforming Loans to Total Loans 0.44% 0.34% 0.30% 0.18% 0.34% 0.19% 0.43% 0.50% 0.22% 0.16% Total Nonperforming Assets to Total Assets 0.69% 0.64% 0.41% 0.26% 0.34% 0.25% 0.41% 0.50% 0.21% 0.11% Total Nonperforming Assets & TDRs (Accruing) to Total Assets 1.02% 0.92% 0.61% 0.39% 0.35% 0.49% 0.45% 0.50% 0.22% 0.12%
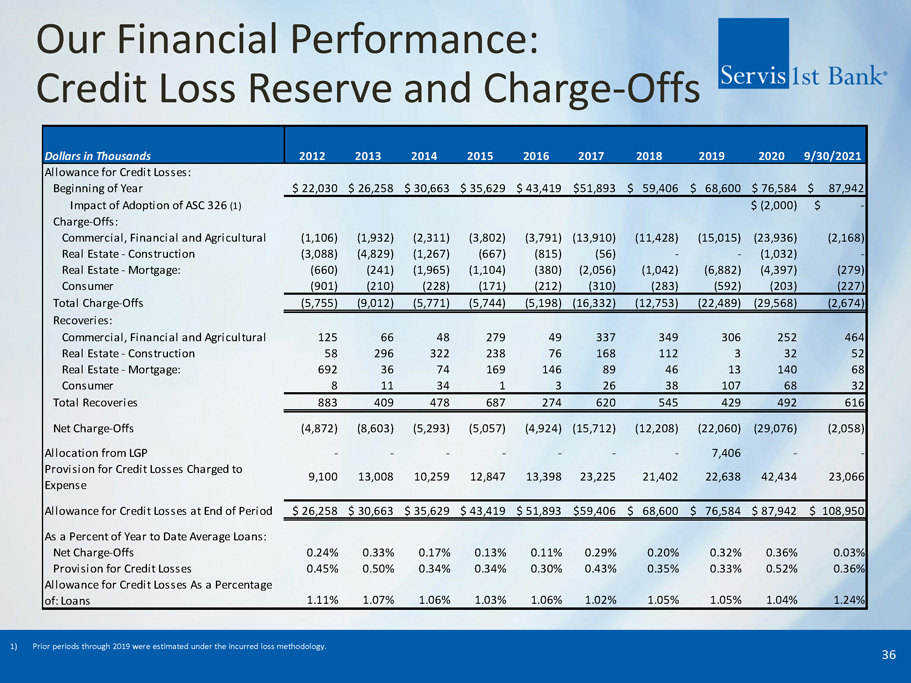
Our Financial Performance: Credit Loss Reserve and Charge - Offs 36 1) Prior periods through 2019 were estimated under the incurred loss methodology. Dollars in Thousands 2017 2018 2019 2020 9/30/2021 Allowance for Credit Losses: Beginning of Year $ 22,030 $ 26,258 $ 30,663 $ 35,629 $ 43,419 $51,893 $ 59,406 $ 68,600 $ 76,584 $ 87,942 Impact of Adoption of ASC 326 (1) $ (2,000) $ - Charge-Offs: Commercial, Financial and Agricultural (1,106) (1,932) (2,311) (3,802) (3,791) (13,910) (11,428) (15,015) (23,936) (2,168) Real Estate - Construction (3,088) (4,829) (1,267) (667) (815) (56) - - (1,032) - Real Estate - Mortgage: (660) (241) (1,965) (1,104) (380) (2,056) (1,042) (6,882) (4,397) (279) Consumer (901) (210) (228) (171) (212) (310) (283) (592) (203) (227) Total Charge-Offs (5,755) (9,012) (5,771) (5,744) (5,198) (16,332) (12,753) (22,489) (29,568) (2,674) Recoveries: Commercial, Financial and Agricultural 125 66 48 279 49 337 349 306 252 464 Real Estate - Construction 58 296 322 238 76 168 112 3 32 52 Real Estate - Mortgage: 692 36 74 169 146 89 46 13 140 68 Consumer 8 11 34 1 3 26 38 107 68 32 Total Recoveries 883 409 478 687 274 620 545 429 492 616 Net Charge-Offs (4,872) (8,603) (5,293) (5,057) (4,924) (15,712) (12,208) (22,060) (29,076) (2,058) Allocation from LGP - - - - - - - 7,406 - - Provision for Credit Losses Charged to Expense 9,100 13,008 10,259 12,847 13,398 23,225 21,402 22,638 42,434 23,066 Allowance for Credit Losses at End of Period $ 26,258 $ 30,663 $ 35,629 $ 43,419 $ 51,893 $59,406 $ 68,600 $ 76,584 $ 87,942 $ 108,950 As a Percent of Year to Date Average Loans: Net Charge-Offs 0.24% 0.33% 0.17% 0.13% 0.11% 0.29% 0.20% 0.32% 0.36% 0.03% Provision for Credit Losses 0.45% 0.50% 0.34% 0.34% 0.30% 0.43% 0.35% 0.33% 0.52% 0.36% Allowance for Credit Losses As a Percentage of: Loans 1.11% 1.07% 1.06% 1.03% 1.06% 1.02% 1.05% 1.05% 1.04% 1.24% 20142013 2012 2015 2016
GAAP Reconciliation and Management Explanation of Non - GAAP Financial Measures We recorded a $ 1 . 7 million credit to our FDIC and other regulatory assessments expense in 2019 as a result of the FDIC’s Small Bank Assessment Credit . We recorded $ 3 . 1 million of additional tax expense as a result of revaluing our net deferred tax assets at December 31 , 2017 due to lower corporate income tax rates provided by the Tax Cuts and Jobs Act passed into law in December 2017 . The revaluation adjustment of our net deferred tax asset position was impacted by a number of factors, including increased loan charge - offs in the fourth quarter of 2017 , increases in deferred tax liabilities relating to depreciation expense on our new headquarters building, and dividends from our captive real estate investment trusts . In 2017 we also recorded expenses of $ 347 , 000 related to terminating the lease agreement on our previous headquarters building in Birmingham, Alabama and expenses of moving into our new headquarters building . We recorded expenses of $ 2 . 1 million in 2015 related to the acquisition of Metro Bancshares, Inc . and the merger of Metro Bank with and into the bank, and recorded an expense of $ 500 , 000 resulting from the initial funding of reserves for unfunded loan commitments, consistent with guidance provided in the Federal Reserve Bank’s Interagency Policy Statement SR 06 - 17 . We recorded a non - routine expense of $ 703 , 000 for the first quarter of 2014 resulting from the correction of our accounting for vested stock options previously granted to members of our advisory boards in our Dothan, Huntsville and Montgomery, Alabama markets . The table below presents computations of earnings and certain other financial measures which exclude the significant adjustments discussed above . These non - GAAP financial measures include “adjusted net income available to common stockholders,” “adjusted earnings per share, basic,” “adjusted earnings per share, diluted,” “adjusted return on average assets,” “adjusted return on average stockholders’ equity,” “adjusted return on average common stockholders’ equity” and “adjusted efficiency ratio . ” Adjusted earnings per share, basic is adjusted net income available to common stockholders divided by weighted average shares outstanding . Adjusted earnings per share, diluted is adjusted net income available to common stockholders divided by weighted average diluted shares outstanding . Adjusted return on average assets is adjusted net income divided by average total assets . Adjusted return of average stockholders’ equity is adjusted net income divided by average total stockholders’ equity . Adjusted return of average common stockholders’ equity is adjusted net income divided by average common stockholders’ equity . The adjusted efficiency ratio is adjusted non - interest expense divided by the sum of adjusted net interest income and adjusted non - interest income . Our management and board use these non - GAAP measures for reporting financial performance to internal users for management purposes and externally as part of presentations to investors . We believe these non - GAAP financial measures provide useful information to management, our board and investors that is supplementary to our financial condition, results of operations and cash flows computed in accordance with GAAP ; however, we acknowledge that these non - GAAP financial measures have inherent limitations, are not audited and are not required to be uniformly applied . All amounts are in thousands, except share and per share data . 37
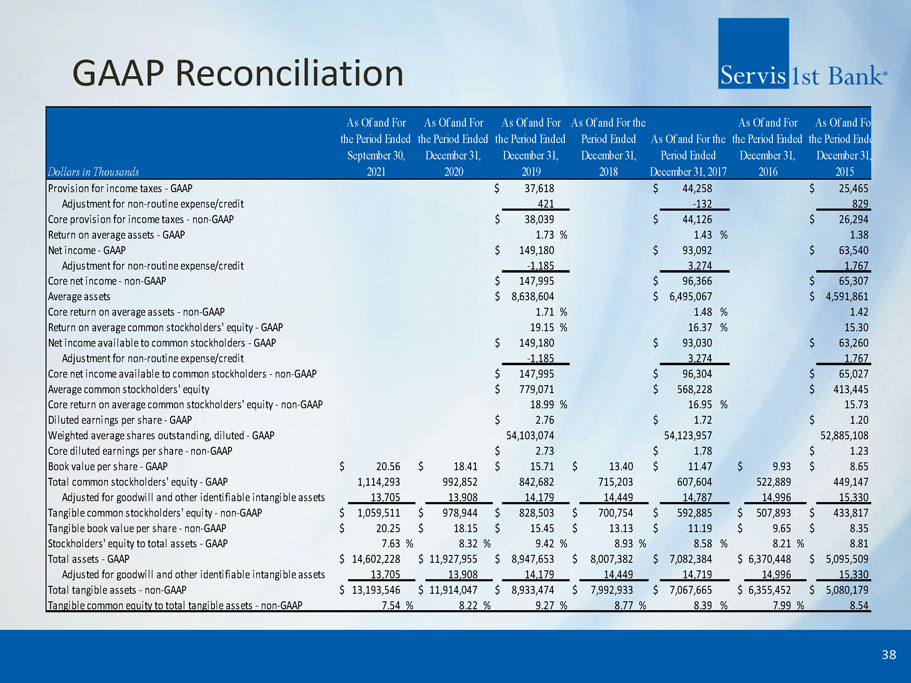
GAAP Reconciliation 38 Dollars in Thousands Provision for income taxes - GAAP $ 37,618 $ 44,258 $ 25,465 Adjustment for non-routine expense/credit 421 -132 829 Core provision for income taxes - non-GAAP $ 38,039 $ 44,126 $ 26,294 Return on average assets - GAAP 1.73% 1.43 % 1.38 Net income - GAAP $ 149,180 $ 93,092 $ 63,540 Adjustment for non-routine expense/credit -1,185 3,274 1,767 Core net income - non-GAAP $ 147,995 $ 96,366 $ 65,307 Average assets $ 8,638,604 $ 6,495,067 $ 4,591,861 Core return on average assets - non-GAAP 1.71% 1.48 % 1.42 Return on average common stockholders' equity - GAAP 19.15% 16.37 % 15.30 Net income available to common stockholders - GAAP $ 149,180 $ 93,030 $ 63,260 Adjustment for non-routine expense/credit -1,185 3,274 1,767 Core net income available to common stockholders - non-GAAP $ 147,995 $ 96,304 $ 65,027 Average common stockholders' equity $ 779,071 $ 568,228 $ 413,445 Core return on average common stockholders' equity - non-GAAP 18.99% 16.95 % 15.73 Diluted earnings per share - GAAP $ 2.76 $ 1.72 $ 1.20 Weighted average shares outstanding, diluted - GAAP 54,103,074 54,123,957 52,885,108 Core diluted earnings per share - non-GAAP $ 2.73 $ 1.78 $ 1.23 Book value per share - GAAP $ 20.56 $ 18.41 $ 15.71 $ 13.40 $ 11.47 $ 9.93 $ 8.65 Total common stockholders' equity - GAAP 1,114,293 992,852 842,682 715,203 607,604 522,889 449,147 Adjusted for goodwill and other identifiable intangible assets 13,705 13,908 14,179 14,449 14,787 14,996 15,330 Tangible common stockholders' equity - non-GAAP $ 1,059,511 $ 978,944 $ 828,503 $ 700,754 $ 592,885 $ 507,893 $ 433,817 Tangible book value per share - non-GAAP $ 20.25 $ 18.15 $ 15.45 $ 13.13 $ 11.19 $ 9.65 $ 8.35 Stockholders' equity to total assets - GAAP 7.63% 8.32% 9.42% 8.93% 8.58 % 8.21% 8.81 Total assets - GAAP $ 14,602,228 $11,927,955 $ 8,947,653 $ 8,007,382 $ 7,082,384 $6,370,448 $ 5,095,509 Adjusted for goodwill and other identifiable intangible assets 13,705 13,908 14,179 14,449 14,719 14,996 15,330 Total tangible assets - non-GAAP $ 13,193,546 $11,914,047 $ 8,933,474 $ 7,992,933 $ 7,067,665 $6,355,452 $ 5,080,179 Tangible common equity to total tangible assets - non-GAAP 7.54% 8.22% 9.27% 8.77% 8.39 % 7.99% 8.54 As Of and For the Period Ended September 30, 2021 As Of and For the Period Ended December 31, 2020 As Of and For the Period Ended December 31, 2019 As Of and For the Period Ended December 31, 2015 As Of and For the Period Ended December 31, 2016 As Of and For the Period Ended December 31, 2017 As Of and For the Period Ended December 31, 2018