
ServisFirst Bancshares, Inc. NYSE: SFBS May 2023
Forward-Looking Statements Statements in this press release that are not
historical facts, including, but not limited to, statements concerning future operations, results or performance, are hereby identified as "forward-looking statements" for the purpose of the safe harbor provided by Section 21E of the Securities
Exchange Act of 1934 and Section 27A of the Securities Act of 1933. The words "believe," "expect," "anticipate," "project," “plan,” “intend,” “will,” “could,” “would,” “might” and similar expressions often signify forward-looking statements.
Such statements involve inherent risks and uncertainties. ServisFirst Bancshares, Inc. cautions that such forward-looking statements, wherever they occur in this press release or in other statements attributable to ServisFirst Bancshares, Inc.,
are necessarily estimates reflecting the judgment of ServisFirst Bancshares, Inc.’s senior management and involve a number of risks and uncertainties that could cause actual results to differ materially from those suggested by the
forward-looking statements. Such forward-looking statements should, therefore, be considered in light of various factors that could affect the accuracy of such forward-looking statements, including, but not limited to: the global health and
economic crisis precipitated by the COVID-19 outbreak; general economic conditions, especially in the credit markets and in the Southeast; the performance of the capital markets; changes in interest rates, yield curves and interest rate spread
relationships, including in light of the continuing high rate of domestic inflation; changes in accounting and tax principles, policies or guidelines; changes in legislation or regulatory requirements; changes in our loan portfolio and the
deposit base; economic crisis and associated credit issues in industries most impacted by the COVID-19 outbreak; possible changes in laws and regulations and governmental monetary and fiscal policies, including, but not limited to, economic
measures intended to curb rising inflation; the cost and other effects of legal and administrative cases and similar contingencies; possible changes in the creditworthiness of customers and the possible impairment of the collectability of loans
and the value of collateral; the effect of natural disasters, such as hurricanes and tornados, in our geographic markets; and increased competition from both banks and non-bank financial institutions. The foregoing list of factors is not
exhaustive. For discussion of these and other risks that may cause actual results to differ from expectations, please refer to “Cautionary Note Regarding Forward-looking Statements” and “Risk Factors” in our most recent Annual Report on Form
10-K, in our Quarterly Reports on Form 10-Q, and our other SEC filings. If one or more of the factors affecting our forward-looking information and statements proves incorrect, then our actual results, performance or achievements could differ
materially from those expressed in, or implied by, forward-looking information and statements contained herein. Accordingly, you should not place undue reliance on any forward-looking statements, which speak only as of the date made.
ServisFirst Bancshares, Inc. assumes no obligation to update or revise any forward-looking statements that are made from time to time. Non-GAAP Financial Measures - This presentation includes non-GAAP financial measures. Information about any
such non-GAAP financial measures, including a reconciliation of those measures to GAAP, can be found in the presentation. 2
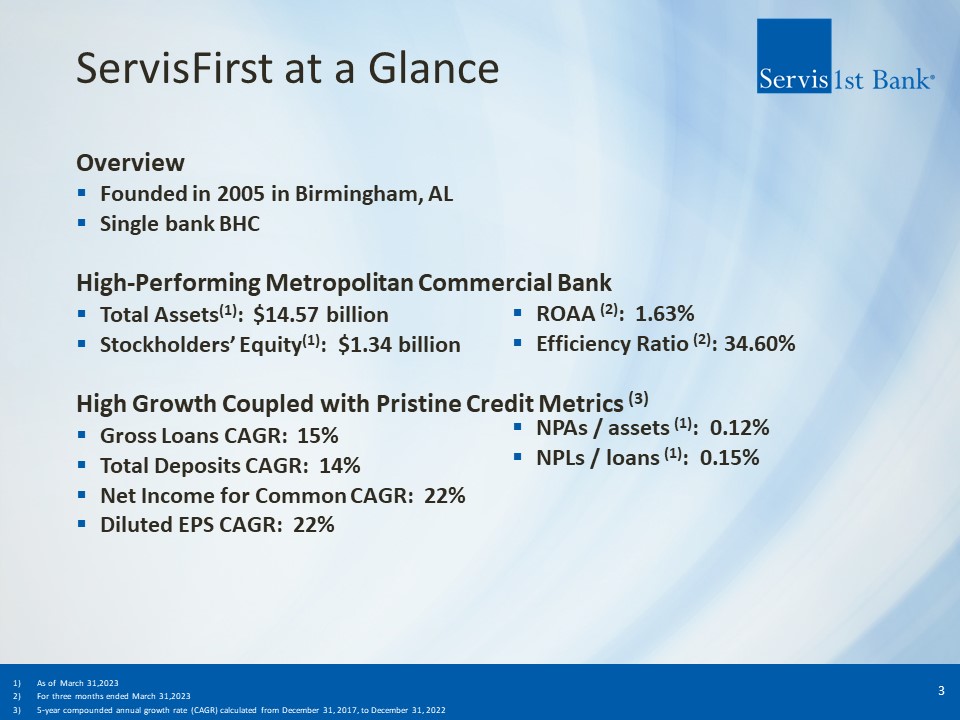
ServisFirst at a Glance Overview Founded in 2005 in Birmingham, AL Single bank
BHC High-Performing Metropolitan Commercial Bank Total Assets(1): $14.57 billion Stockholders’ Equity(1): $1.34 billion High Growth Coupled with Pristine Credit Metrics (3) Gross Loans CAGR: 15% Total Deposits CAGR: 14% Net Income for
Common CAGR: 22% Diluted EPS CAGR: 22% ROAA (2): 1.63% Efficiency Ratio (2): 34.60% As of March 31,2023 For three months ended March 31,2023 5-year compounded annual growth rate (CAGR) calculated from December 31, 2017, to December 31,
2022 NPAs / assets (1): 0.12% NPLs / loans (1): 0.15% 3
Our Business Strategy Simple business model Loans and deposits are primary
drivers, not ancillary services Limited branch footprint Technology provides efficiency Big bank products and bankers With the style of service and delivery of a community bank Core deposit focus coupled with C&I lending
emphasis Scalable, decentralized business model Regional CEOs drive revenue Opportunistic expansion, attractive geographies Teams of the best bankers in each metropolitan market Disciplined growth company that sets high standards for
performance 4
Opportunistic Expansion Identify great bankers in attractive markets Focus on
people as opposed to places Target minimum of $300 million in assets within 3 years Best bankers in growing markets Market strategies Regional CEOs execute simple business model Back office support and risk management
infrastructure Non-legal board of directors comprised of key business people Provide professional banking services to mid-market commercial customers that have been neglected or pushed down to branch personnel by national and other larger
regional banks Opportunistic future expansion Southern markets, metropolitan focus Draw on expertise of industry contacts 5
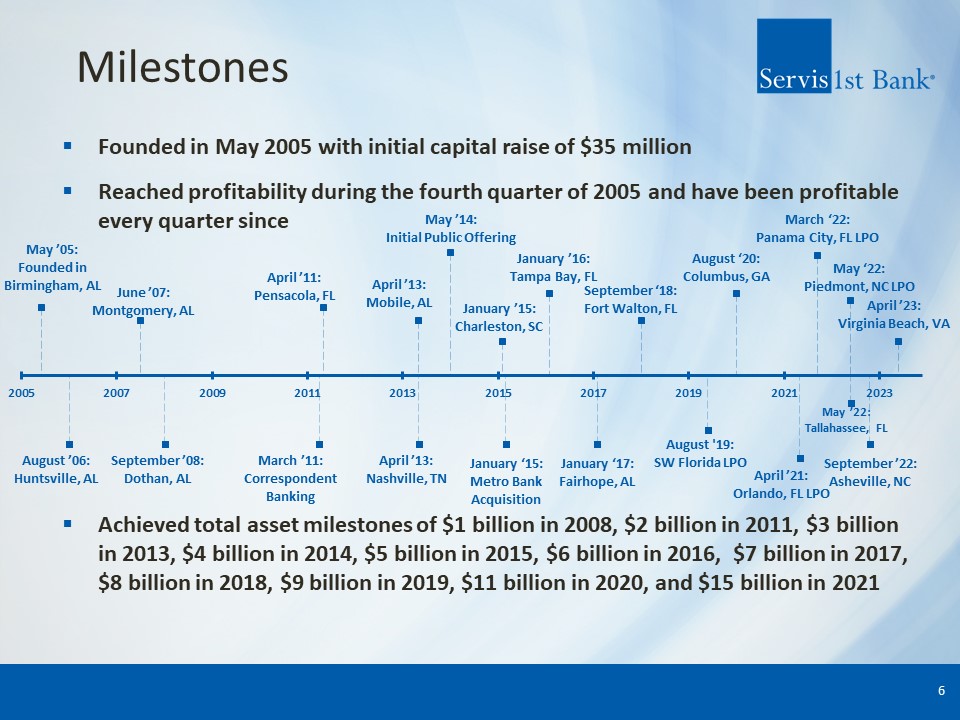
Milestones 6 Founded in May 2005 with initial capital raise of $35
million Reached profitability during the fourth quarter of 2005 and have been profitable every quarter since Achieved total asset milestones of $1 billion in 2008, $2 billion in 2011, $3 billion in 2013, $4 billion in 2014, $5 billion in
2015, $6 billion in 2016, $7 billion in 2017, $8 billion in 2018, $9 billion in 2019, $11 billion in 2020, and $15 billion in 2021
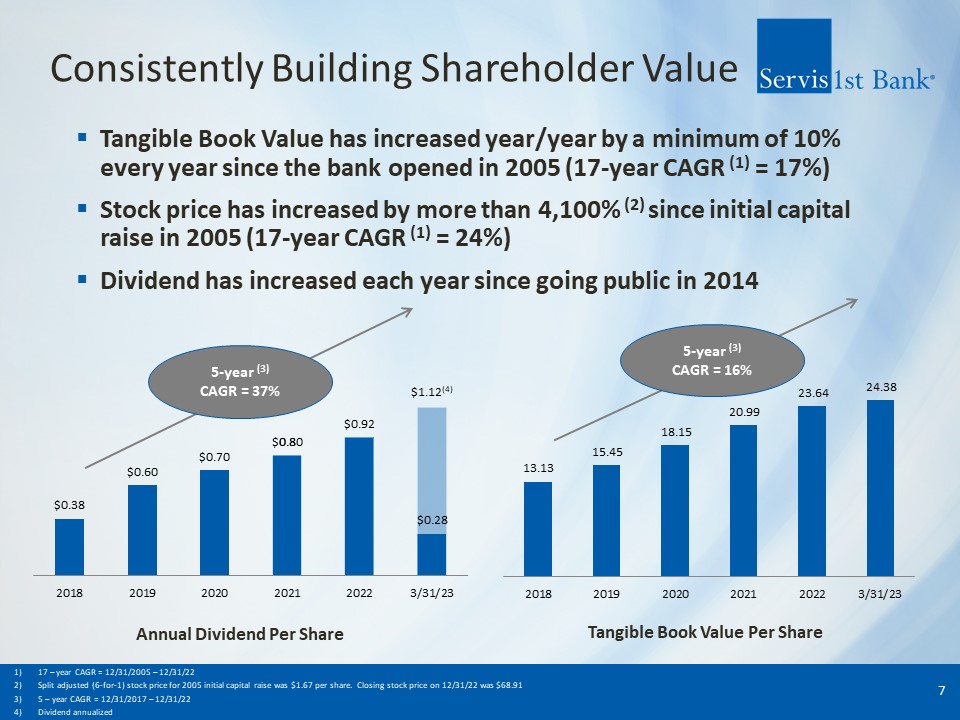
Consistently Building Shareholder Value Tangible Book Value has increased
year/year by a minimum of 10% every year since the bank opened in 2005 (17-year CAGR (1) = 17%) Stock price has increased by more than 4,100% (2) since initial capital raise in 2005 (17-year CAGR (1) = 24%) Dividend has increased each year
since going public in 2014 7 5-year (3) CAGR = 37% 5-year (3) CAGR = 16% Annual Dividend Per Share Tangible Book Value Per Share 17 – year CAGR = 12/31/2005 – 12/31/22 Split adjusted (6-for-1) stock price for 2005 initial capital
raise was $1.67 per share. Closing stock price on 12/31/22 was $68.91 5 – year CAGR = 12/31/2017 – 12/31/22 Dividend annualized
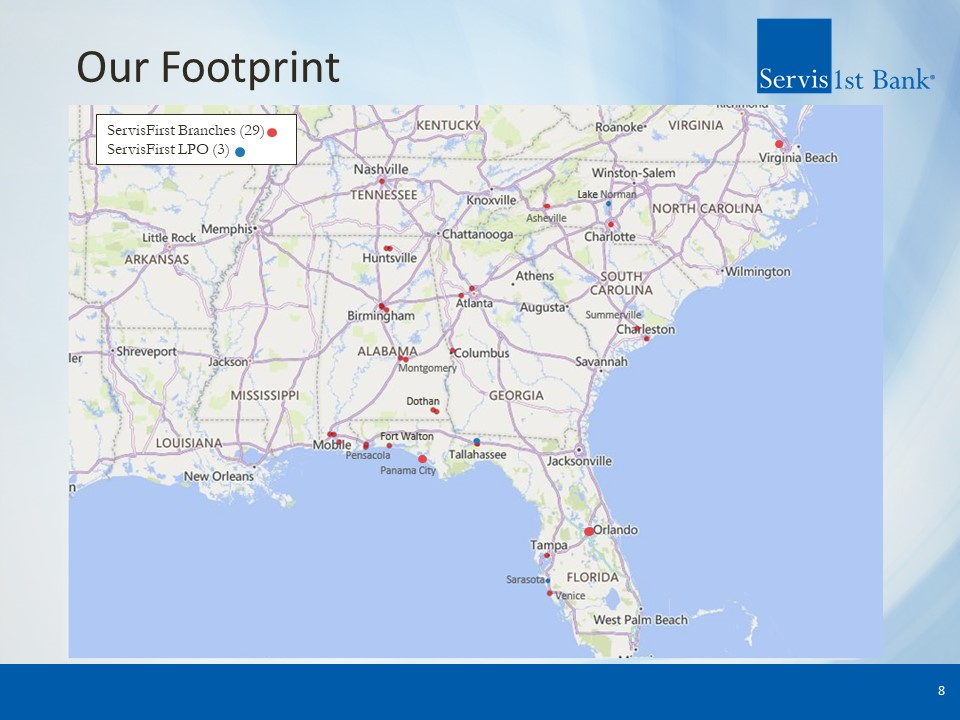
Our Footprint 8 ServisFirst Branches (29) ServisFirst LPO (3)
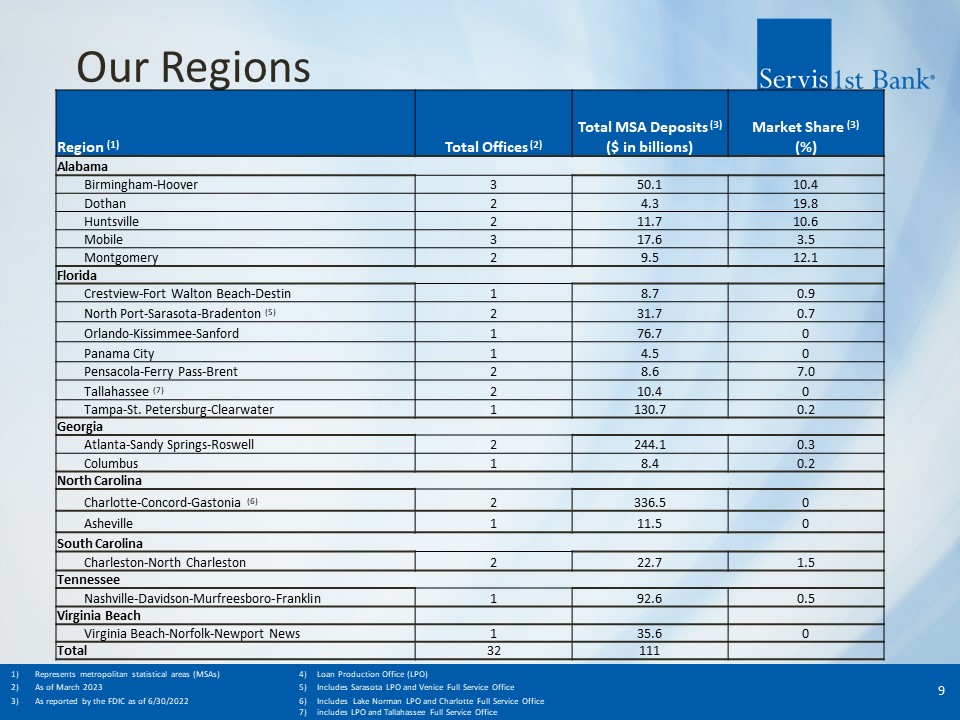
Our Regions 9 Represents metropolitan statistical areas (MSAs) 4) Loan
Production Office (LPO) As of March 2023 5) Includes Sarasota LPO and Venice Full Service Office As reported by the FDIC as of 6/30/2022 6) Includes Lake Norman LPO and Charlotte Full Service Office 7) includes LPO and Tallahassee Full
Service Office Region (1) Total Offices (2) Total MSA Deposits (3) Market Share (3) ($ in
billions) (%) Alabama Birmingham-Hoover 3 50.1 10.4 Dothan 2 4.3 19.8 Huntsville 2 11.7 10.6 Mobile 3 17.6 3.5 Montgomery 2 9.5 12.1 Florida Crestview-Fort Walton Beach-Destin 1 8.7 0.9 North
Port-Sarasota-Bradenton (5) 2 31.7 0.7 Orlando-Kissimmee-Sanford 1 76.7 0 Panama City 1 4.5 0 Pensacola-Ferry Pass-Brent 2 8.6 7.0 Tallahassee (7) 2 10.4 0 Tampa-St.
Petersburg-Clearwater 1 130.7 0.2 Georgia Atlanta-Sandy Springs-Roswell 2 244.1 0.3 Columbus 1 8.4 0.2 North Carolina Charlotte-Concord-Gastonia (6) 2 336.5 0 Asheville 1 11.5 0 South
Carolina Charleston-North Charleston 2 22.7 1.5 Tennessee Nashville-Davidson-Murfreesboro-Franklin 1 92.6 0.5 Virginia Beach Virginia Beach-Norfolk-Newport News 1 35.6 0 Total 32 111
Our Business Model “Loan making and deposit taking” Traditional commercial
banking services No emphasis on non-traditional business lines Culture of cost control “Branch light,” with $446.7 million average deposits per banking center Leverage technology and centralized infrastructure Headcount focused on
production and risk management Key products; including remote deposit capture (64% of dollars deposited in 2023 were via RDC), cash management, remote currency manager Outsource selected functions C&I and Owner Occupied CRE lending
expertise 46% of gross loans Target customers: privately held businesses $2 to $250 million in annual sales, professionals, affluent consumers 10
Scalable, Decentralized Structure Local decision-making Emphasize local
decision-making to drive customer revenue Centralized, uniform risk management and support Conservative local lending authorities, covers most lending decisions Geographic organizational structure (as opposed to line of business
structure) Regional CEOs empowered and held accountable Utilize stock based compensation to align goals Top-down sales culture Senior management actively involved in customer acquisition 11
Capacity For Growth Potential for significant growth in both loan and deposit
book size of current calling officers Approximately 93% of the bank’s loan book is managed by approximately 50% of the bank’s calling officers and approximately 78% of the bank’s deposits is managed by approximately 50% of the bank’s calling
officers Average outstanding loan balances per officer as of 3/31/23 was $78 million and average deposit balances per officer was $91 million Strive for a minimum of $75 million in outstanding loans and deposits for every calling officer,
resulting in approximately $3.5 billion in potential additional loan balances and $5.2 billion in potential additional deposits balances Approximately 48% of calling officers manage loan books in excess of $50 million while 38% of calling
officers manage deposit books in excess of $50 million Focused on identifying motivated, customer service oriented bankers Regularly meet with potential new bankers Sustainable growth achieved through exceptional customer service which
builds client loyalty and leads to customer referrals 12
Risk Management Manage risk centrally while delivering products and services by
each Regional Bank Centralized/Consistent: operations, compliance, risk, accounting, audit, information technology, and credit administration Investing resources in Risk Management Group Hired CRO in 2017; implemented enterprise risk
management program Invested in new technologies (BSA, information security, credit administration) Enhanced staff and resources for risk, compliance, BSA, and credit administration Increased scope of internal audits and independent loan
reviews Management committees identify, monitor, and mitigate risks across enterprise Healthy Regulatory relations Independent loan portfolio stress testing performed regularly Correspondent Banking Division provides additional stable
funding source 13
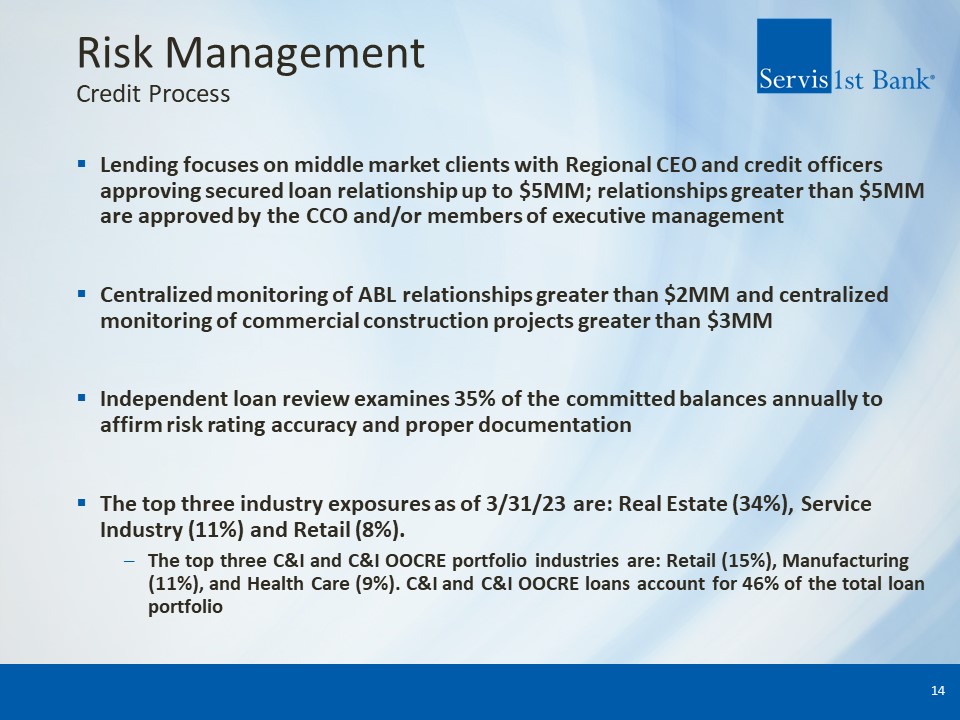
Risk ManagementCredit Process Lending focuses on middle market clients with
Regional CEO and credit officers approving secured loan relationship up to $5MM; relationships greater than $5MM are approved by the CCO and/or members of executive management Centralized monitoring of ABL relationships greater than $2MM and
centralized monitoring of commercial construction projects greater than $3MM Independent loan review examines 35% of the committed balances annually to affirm risk rating accuracy and proper documentation The top three industry exposures as
of 3/31/23 are: Real Estate (34%), Service Industry (11%) and Retail (8%). The top three C&I and C&I OOCRE portfolio industries are: Retail (15%), Manufacturing (11%), and Health Care (9%). C&I and C&I OOCRE loans account for
46% of the total loan portfolio 14
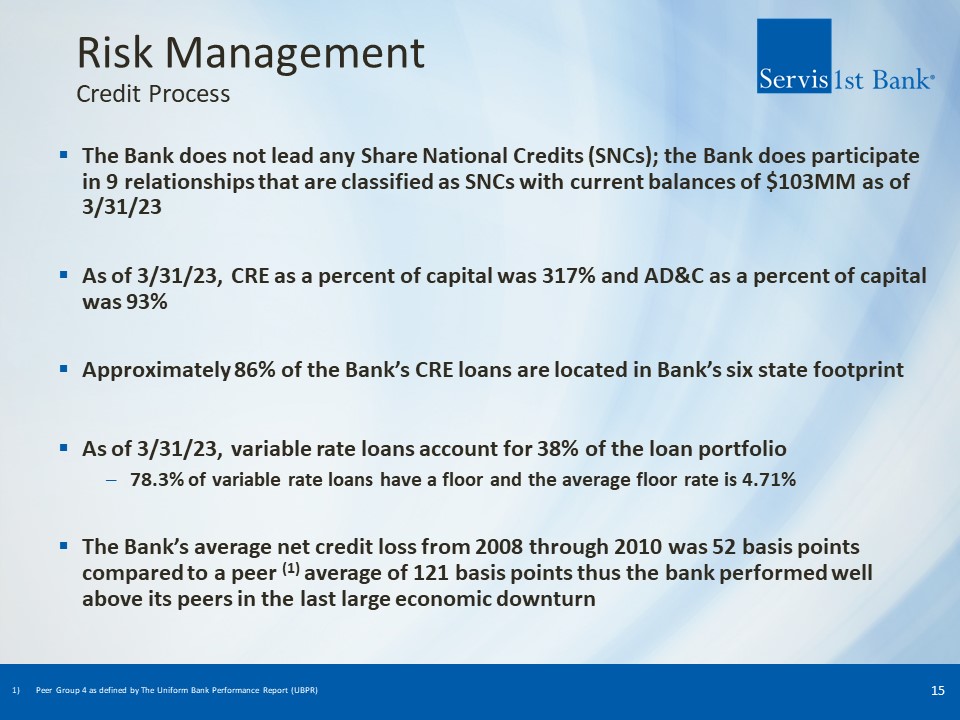
Risk ManagementCredit Process The Bank does not lead any Share National Credits
(SNCs); the Bank does participate in 9 relationships that are classified as SNCs with current balances of $103MM as of 3/31/23 As of 3/31/23, CRE as a percent of capital was 317% and AD&C as a percent of capital was 93% Approximately 86%
of the Bank’s CRE loans are located in Bank’s six state footprint As of 3/31/23, variable rate loans account for 38% of the loan portfolio 78.3% of variable rate loans have a floor and the average floor rate is 4.71% The Bank’s average net
credit loss from 2008 through 2010 was 52 basis points compared to a peer (1) average of 121 basis points thus the bank performed well above its peers in the last large economic downturn 15 Peer Group 4 as defined by The Uniform Bank
Performance Report (UBPR)
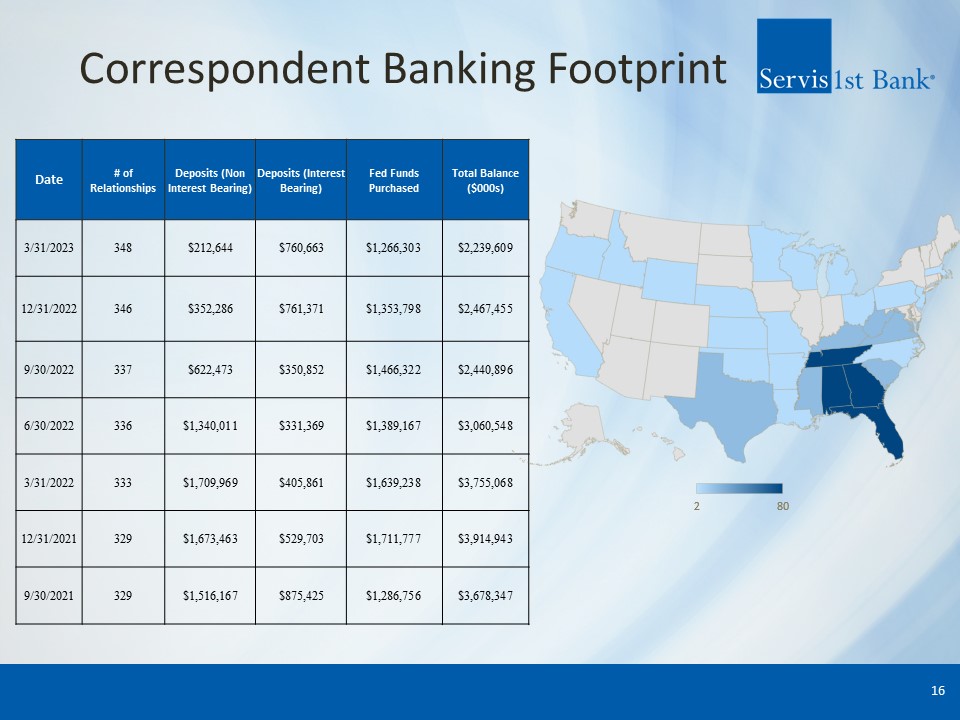
Correspondent Banking Footprint 16 Date # of Relationships Deposits (Non
Interest Bearing) Deposits (Interest Bearing) Fed Funds Purchased Total Balance
($000s) 3/31/2023 348 $212,644 $760,663 $1,266,303 $2,239,609 12/31/2022 346 $352,286 $761,371 $1,353,798 $2,467,455 9/30/2022 337 $622,473 $350,852 $1,466,322 $2,440,896 6/30/2022 336 $1,340,011 $331,369 $1,389,167 $3,060,548 3/31/2022 333 $1,709,969 $405,861 $1,639,238 $3,755,068 12/31/2021 329 $1,673,463 $529,703 $1,711,777 $3,914,943 9/30/2021 329 $1,516,167 $875,425 $1,286,756 $3,678,347
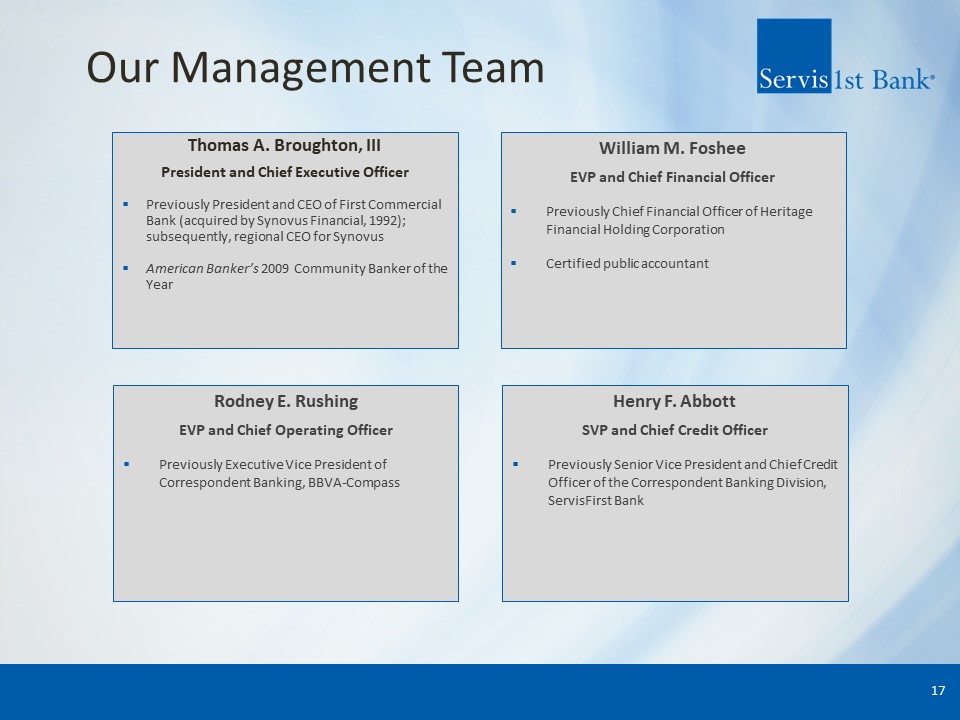
Our Management Team Thomas A. Broughton, III President and Chief Executive
Officer Previously President and CEO of First Commercial Bank (acquired by Synovus Financial, 1992); subsequently, regional CEO for Synovus American Banker’s 2009 Community Banker of the Year William M. Foshee EVP and Chief Financial
Officer Previously Chief Financial Officer of Heritage Financial Holding Corporation Certified public accountant Rodney E. Rushing EVP and Chief Operating Officer Previously Executive Vice President of Correspondent Banking,
BBVA-Compass Henry F. Abbott SVP and Chief Credit Officer Previously Senior Vice President and Chief Credit Officer of the Correspondent Banking Division, ServisFirst Bank 17
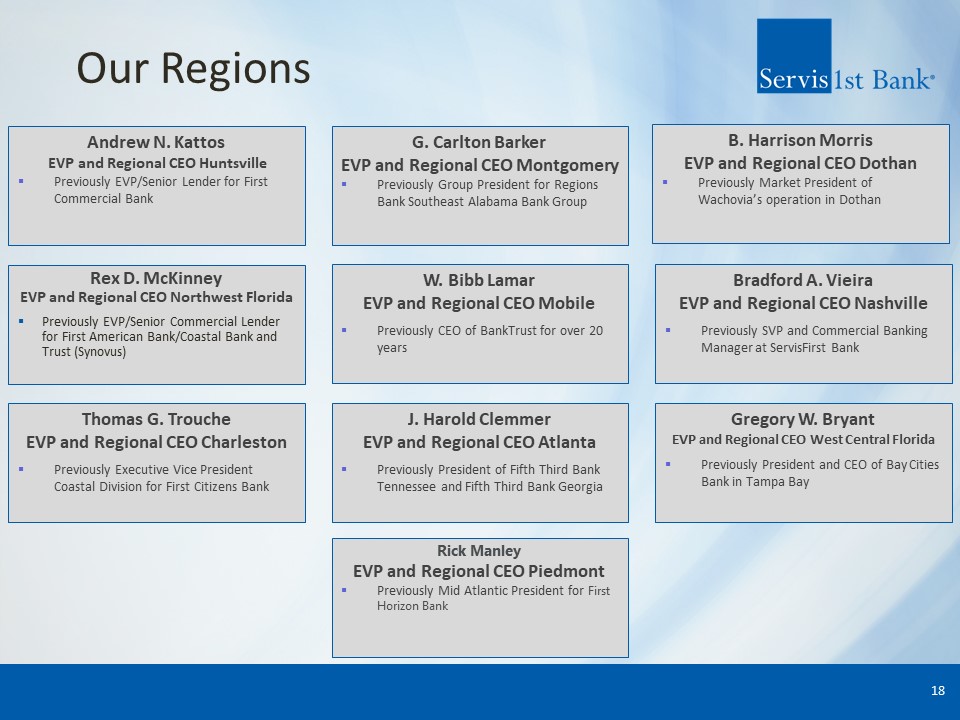
Our Regions Rex D. McKinney EVP and Regional CEO Northwest Florida Previously
EVP/Senior Commercial Lender for First American Bank/Coastal Bank and Trust (Synovus) Andrew N. Kattos EVP and Regional CEO Huntsville Previously EVP/Senior Lender for First Commercial Bank J. Harold Clemmer EVP and Regional CEO
Atlanta Previously President of Fifth Third Bank Tennessee and Fifth Third Bank Georgia W. Bibb Lamar EVP and Regional CEO Mobile Previously CEO of BankTrust for over 20 years G. Carlton Barker EVP and Regional CEO
Montgomery Previously Group President for Regions Bank Southeast Alabama Bank Group B. Harrison Morris EVP and Regional CEO Dothan Previously Market President of Wachovia’s operation in Dothan Gregory W. Bryant EVP and Regional CEO West
Central Florida Previously President and CEO of Bay Cities Bank in Tampa Bay Thomas G. Trouche EVP and Regional CEO Charleston Previously Executive Vice President Coastal Division for First Citizens Bank Bradford A. Vieira EVP and
Regional CEO Nashville Previously SVP and Commercial Banking Manager at ServisFirst Bank 18 Rick Manley EVP and Regional CEO Piedmont Previously Mid Atlantic President for First Horizon Bank

Financial Results
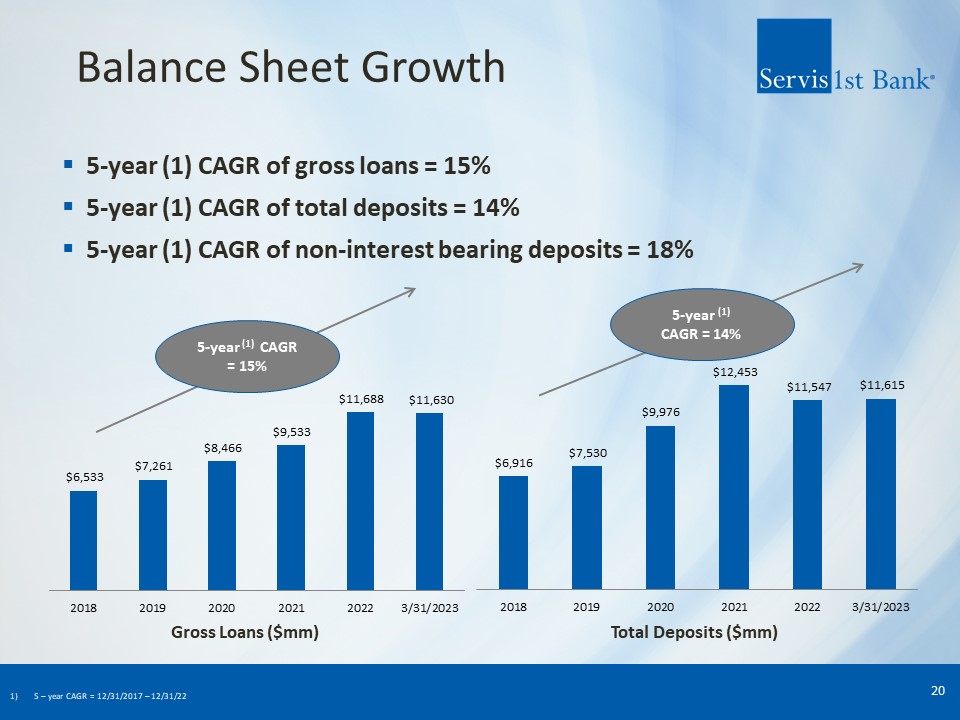
Balance Sheet Growth 5-year (1) CAGR of gross loans = 15% 5-year (1) CAGR of
total deposits = 14% 5-year (1) CAGR of non-interest bearing deposits = 18% 20 5-year (1) CAGR = 15% 5-year (1) CAGR = 14% Gross Loans ($mm) Total Deposits ($mm) 5 – year CAGR = 12/31/2017 – 12/31/22
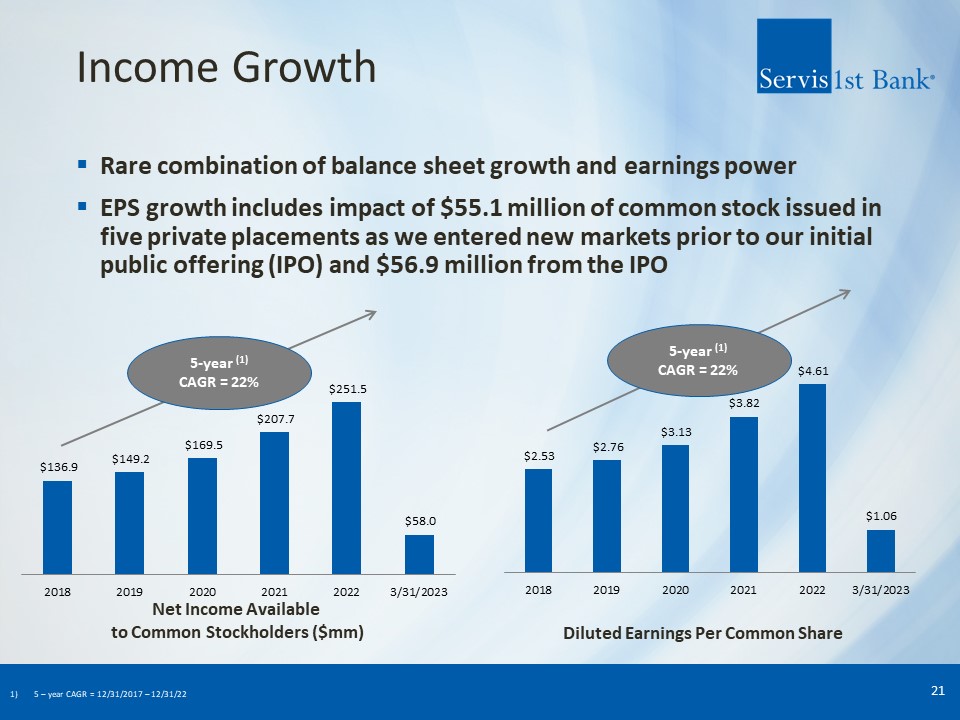
Income Growth Rare combination of balance sheet growth and earnings power EPS
growth includes impact of $55.1 million of common stock issued in five private placements as we entered new markets prior to our initial public offering (IPO) and $56.9 million from the IPO 21 5-year (1) CAGR = 22% 5-year (1) CAGR =
22% Net Income Available to Common Stockholders ($mm) Diluted Earnings Per Common Share 5 – year CAGR = 12/31/2017 – 12/31/22
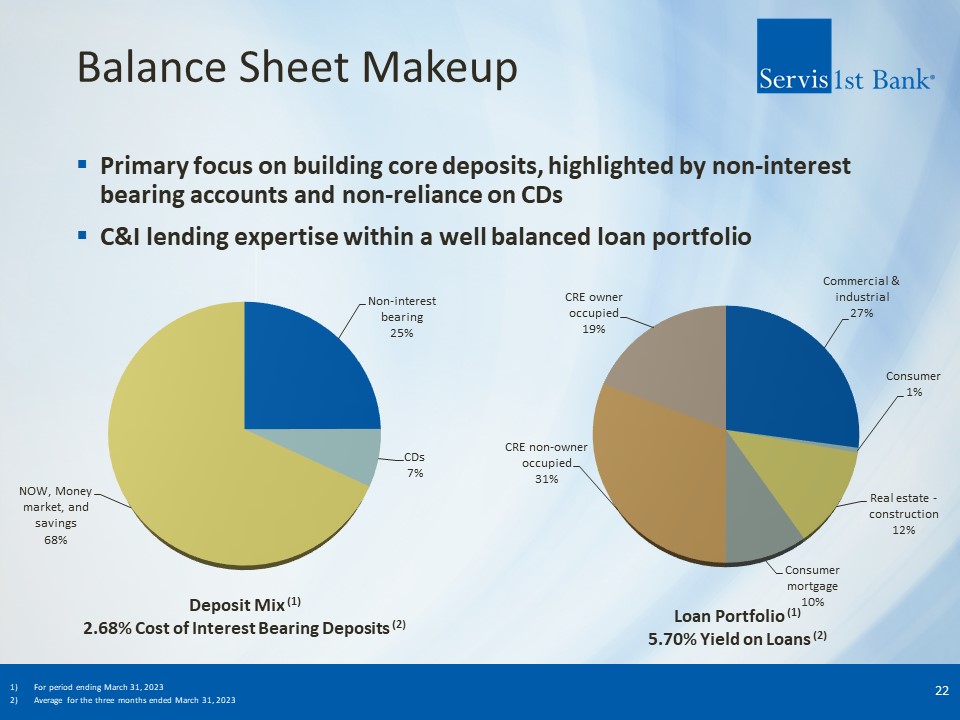
Balance Sheet Makeup Primary focus on building core deposits, highlighted by
non-interest bearing accounts and non-reliance on CDs C&I lending expertise within a well balanced loan portfolio 22 Deposit Mix (1) 2.68% Cost of Interest Bearing Deposits (2) Loan Portfolio (1) 5.70% Yield on Loans (2) For period
ending March 31, 2023 Average for the three months ended March 31, 2023
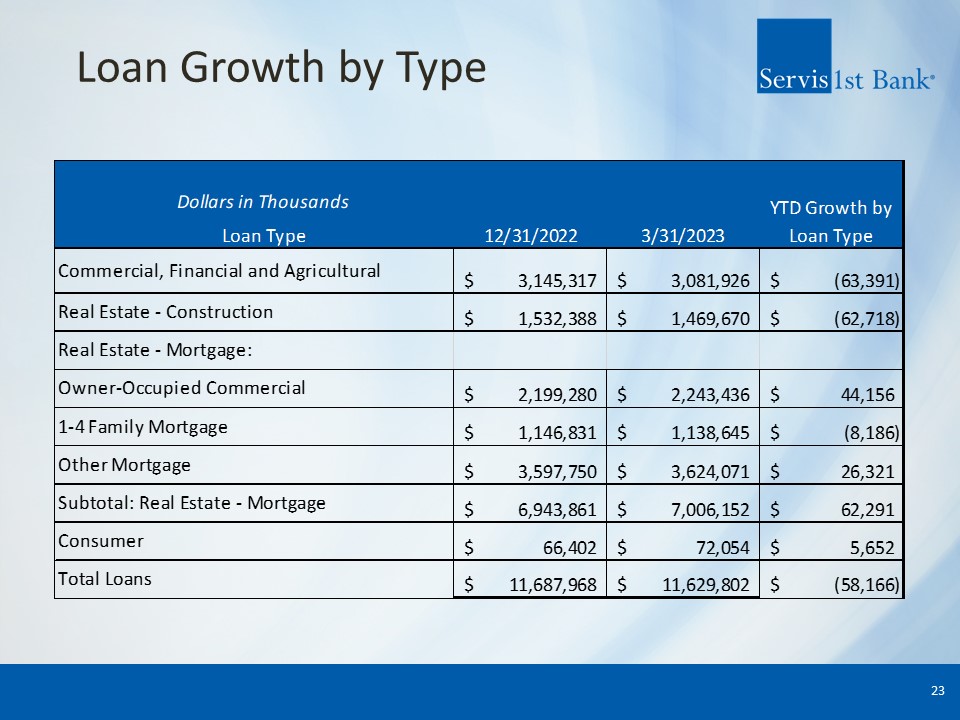
Loan Growth by Type 23
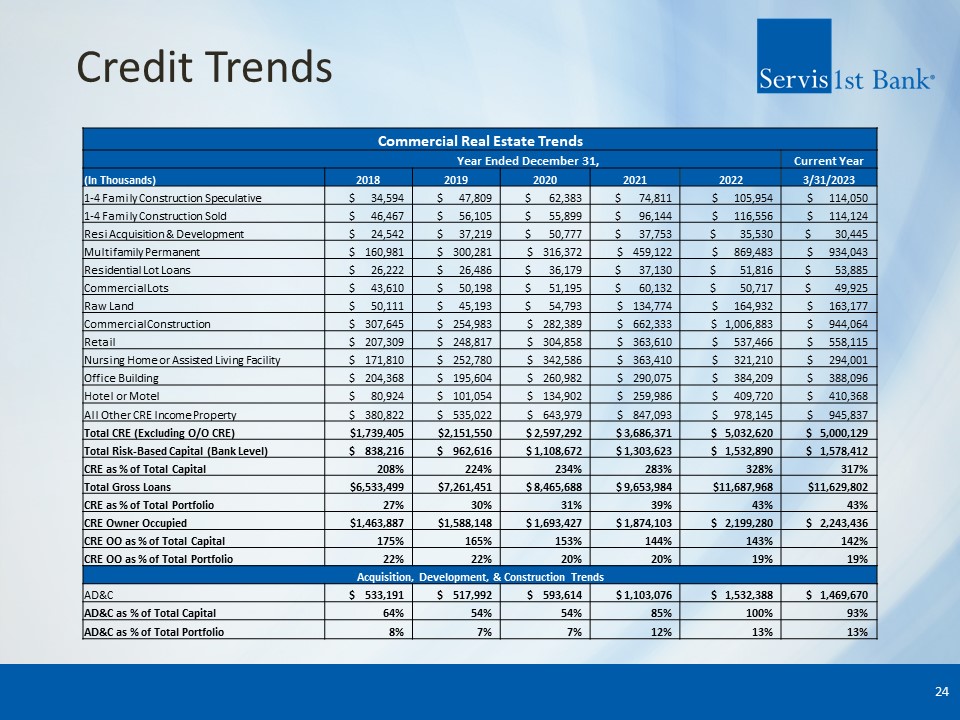
Credit Trends Commercial Real Estate Trends Year Ended December 31, Current
Year (In Thousands) 2018 2019 2020 2021 2022 3/31/2023 1-4 Family Construction Speculative $ 34,594 $ 47,809 $ 62,383 $ 74,811 $ 105,954 $ 114,050 1-4 Family Construction Sold $ 46,467 $ 56,105 $ 55,899 $
96,144 $ 116,556 $ 114,124 Resi Acquisition & Development $ 24,542 $ 37,219 $ 50,777 $ 37,753 $ 35,530 $ 30,445 Multifamily Permanent $ 160,981 $ 300,281 $ 316,372 $ 459,122 $ 869,483 $
934,043 Residential Lot Loans $ 26,222 $ 26,486 $ 36,179 $ 37,130 $ 51,816 $ 53,885 Commercial Lots $ 43,610 $ 50,198 $ 51,195 $ 60,132 $ 50,717 $ 49,925 Raw Land $ 50,111 $ 45,193 $ 54,793 $
134,774 $ 164,932 $ 163,177 Commercial Construction $ 307,645 $ 254,983 $ 282,389 $ 662,333 $ 1,006,883 $ 944,064 Retail $ 207,309 $ 248,817 $ 304,858 $ 363,610 $ 537,466 $ 558,115 Nursing Home or
Assisted Living Facility $ 171,810 $ 252,780 $ 342,586 $ 363,410 $ 321,210 $ 294,001 Office Building $ 204,368 $ 195,604 $ 260,982 $ 290,075 $ 384,209 $ 388,096 Hotel or Motel $ 80,924 $ 101,054 $
134,902 $ 259,986 $ 409,720 $ 410,368 All Other CRE Income Property $ 380,822 $ 535,022 $ 643,979 $ 847,093 $ 978,145 $ 945,837 Total CRE (Excluding O/O CRE) $1,739,405 $2,151,550 $ 2,597,292 $ 3,686,371
$ 5,032,620 $ 5,000,129 Total Risk-Based Capital (Bank Level) $ 838,216 $ 962,616 $ 1,108,672 $ 1,303,623 $ 1,532,890 $ 1,578,412 CRE as % of Total Capital 208% 224% 234% 283% 328% 317% Total Gross Loans
$6,533,499 $7,261,451 $ 8,465,688 $ 9,653,984 $11,687,968 $11,629,802 CRE as % of Total Portfolio 27% 30% 31% 39% 43% 43% CRE Owner Occupied $1,463,887 $1,588,148 $ 1,693,427 $ 1,874,103 $ 2,199,280 $
2,243,436 CRE OO as % of Total Capital 175% 165% 153% 144% 143% 142% CRE OO as % of Total Portfolio 22% 22% 20% 20% 19% 19% Acquisition, Development, & Construction Trends AD&C $ 533,191 $ 517,992 $ 593,614 $
1,103,076 $ 1,532,388 $ 1,469,670 AD&C as % of Total Capital 64% 54% 54% 85% 100% 93% AD&C as % of Total Portfolio 8% 7% 7% 12% 13% 13% 24
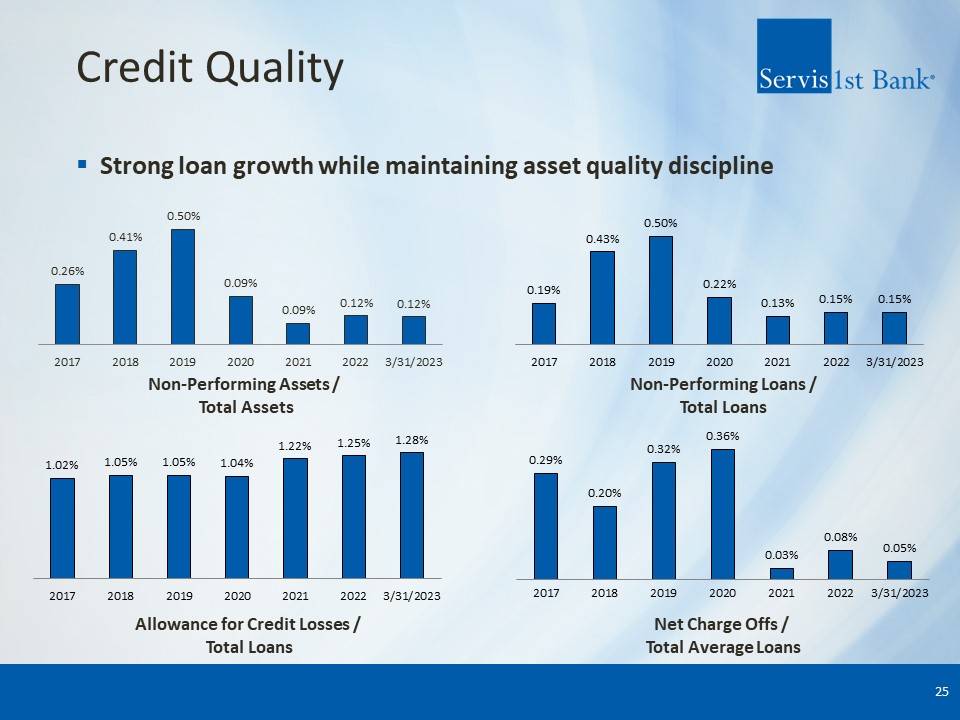
Credit Quality Strong loan growth while maintaining asset quality
discipline Allowance for Credit Losses / Total Loans Net Charge Offs / Total Average Loans Non-Performing Assets / Total Assets Non-Performing Loans / Total Loans 25
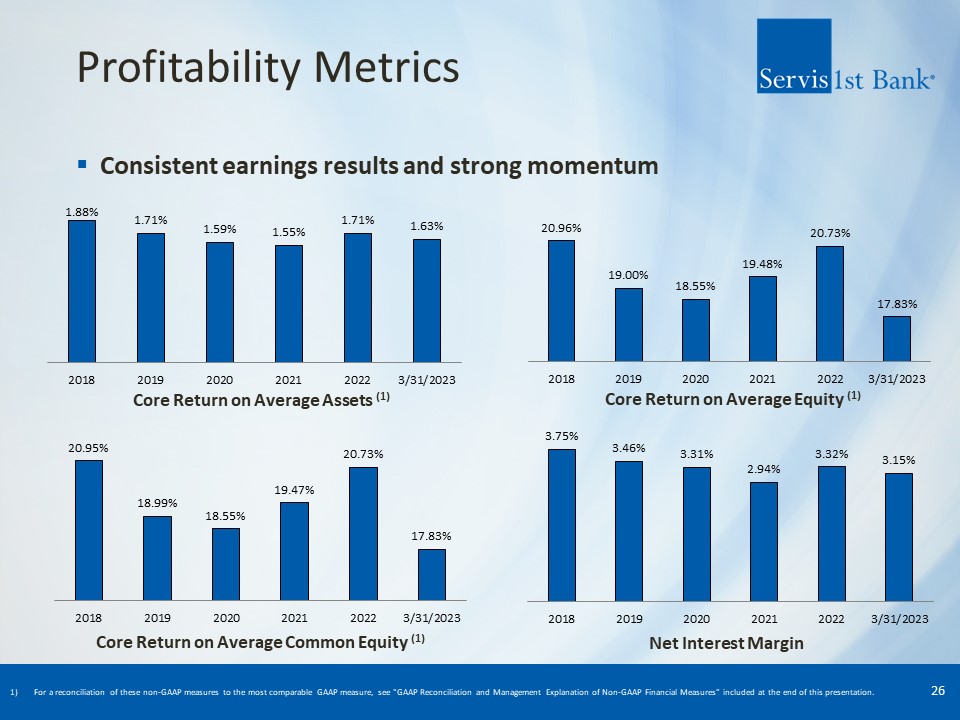
Profitability Metrics Consistent earnings results and strong momentum 26 Core
Return on Average Assets (1) Core Return on Average Equity (1) Core Return on Average Common Equity (1) Net Interest Margin For a reconciliation of these non-GAAP measures to the most comparable GAAP measure, see "GAAP Reconciliation and
Management Explanation of Non-GAAP Financial Measures" included at the end of this presentation.
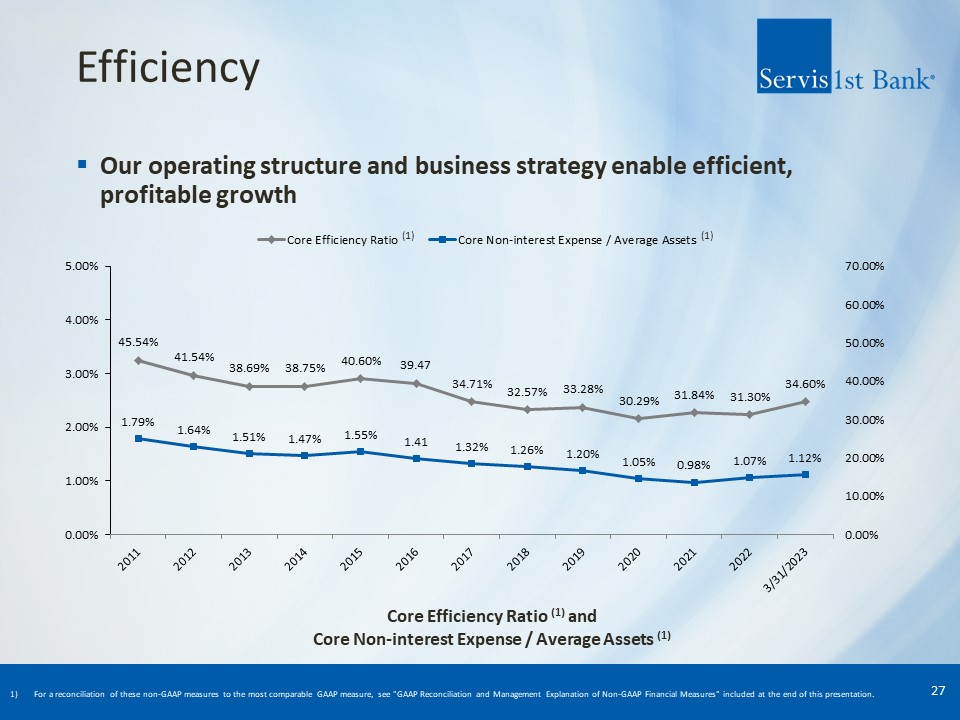
Efficiency Our operating structure and business strategy enable efficient,
profitable growth 27 Core Efficiency Ratio (1) and Core Non-interest Expense / Average Assets (1) (1) (1) For a reconciliation of these non-GAAP measures to the most comparable GAAP measure, see "GAAP Reconciliation and Management
Explanation of Non-GAAP Financial Measures" included at the end of this presentation.
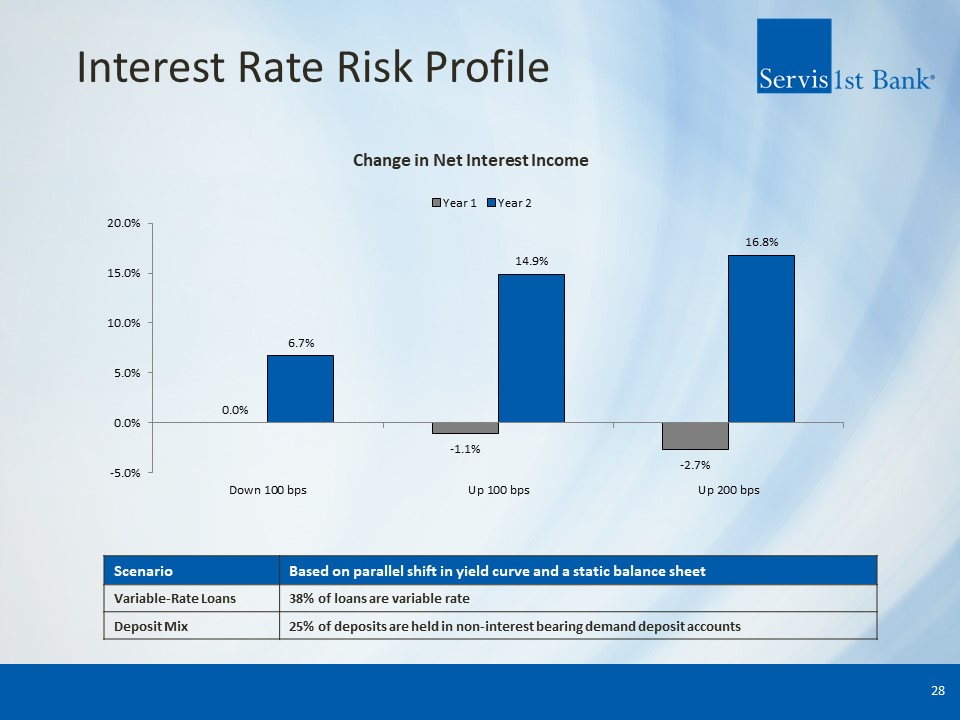
Interest Rate Risk Profile 28 Change in Net Interest Income Scenario Based on
parallel shift in yield curve and a static balance sheet Variable-Rate Loans 38% of loans are variable rate Deposit Mix 25% of deposits are held in non-interest bearing demand deposit accounts
Balance Sheet Stability
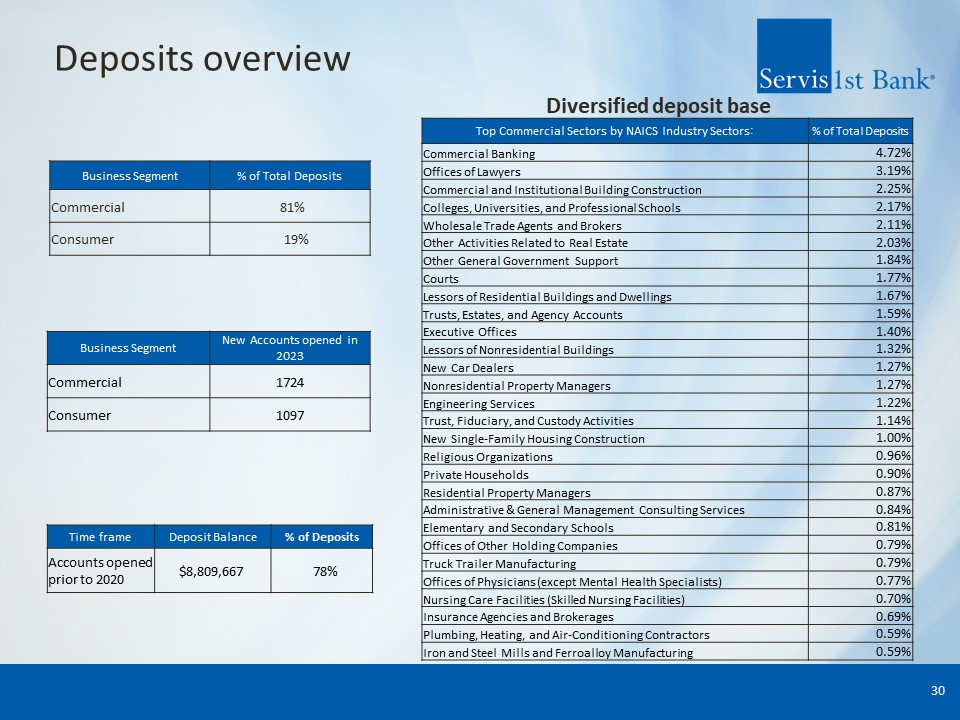
Deposits overview 30 Business Segment New Accounts opened in
2023 Commercial 1724 Consumer 1097 Diversified deposit base Top Commercial Sectors by NAICS Industry Sectors: % of Total Deposits Commercial Banking 4.72% Offices of Lawyers 3.19% Commercial and Institutional Building
Construction 2.25% Colleges, Universities, and Professional Schools 2.17% Wholesale Trade Agents and Brokers 2.11% Other Activities Related to Real Estate 2.03% Other General Government Support 1.84% Courts 1.77% Lessors of
Residential Buildings and Dwellings 1.67% Trusts, Estates, and Agency Accounts 1.59% Executive Offices 1.40% Lessors of Nonresidential Buildings 1.32% New Car Dealers 1.27% Nonresidential Property Managers 1.27% Engineering
Services 1.22% Trust, Fiduciary, and Custody Activities 1.14% New Single-Family Housing Construction 1.00% Religious Organizations 0.96% Private Households 0.90% Residential Property Managers 0.87% Administrative & General
Management Consulting Services 0.84% Elementary and Secondary Schools 0.81% Offices of Other Holding Companies 0.79% Truck Trailer Manufacturing 0.79% Offices of Physicians (except Mental Health Specialists) 0.77% Nursing Care
Facilities (Skilled Nursing Facilities) 0.70% Insurance Agencies and Brokerages 0.69% Plumbing, Heating, and Air-Conditioning Contractors 0.59% Iron and Steel Mills and Ferroalloy Manufacturing 0.59% Time frame Deposit Balance %
of Deposits Accounts opened prior to 2020 $8,809,667 78% Business Segment % of Total Deposits Commercial 81% Consumer 19%
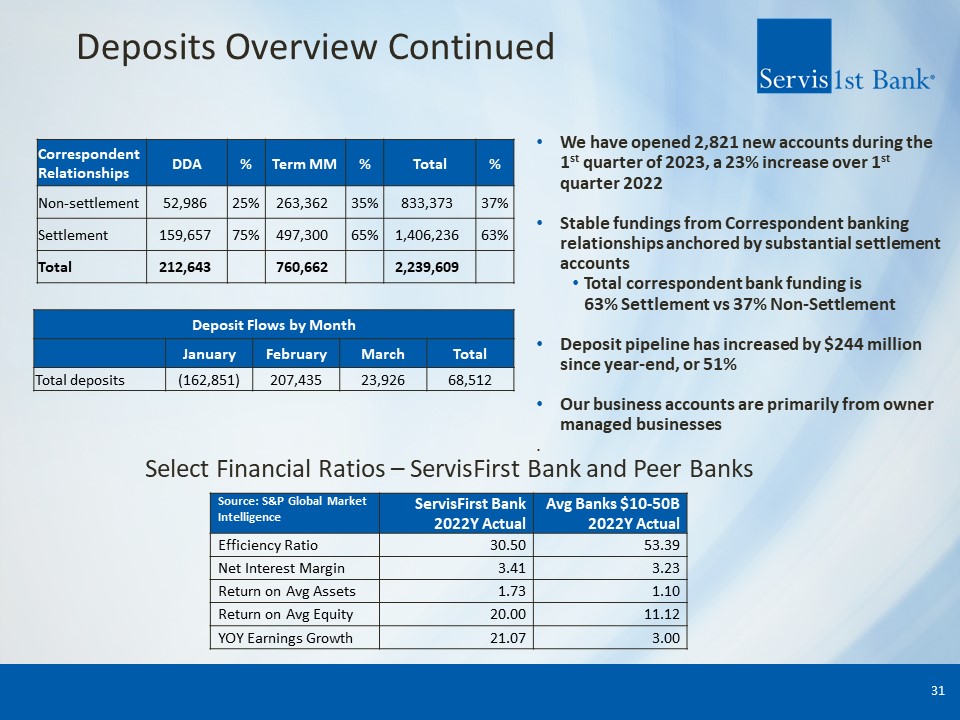
Deposits Overview Continued 31 Deposit Flows by Month Net deposit inflows
(outflows) January February March Total Total deposits (162,851) 207,435 23,926 68,512 Correspondent Relationships DDA % Term
MM % Total % Non-settlement 52,986 25% 263,362 35% 833,373 37% Settlement 159,657 75% 497,300 65% 1,406,236 63% Total 212,643 760,662 2,239,609 Select Financial Ratios – ServisFirst Bank and Peer Banks Source:
S&P Global Market Intelligence ServisFirst Bank 2022Y Actual Avg Banks $10-50B 2022Y Actual Efficiency Ratio 30.50 53.39 Net Interest Margin 3.41 3.23 Return on Avg Assets 1.73 1.10 Return on Avg Equity 20.00 11.12 YOY
Earnings Growth 21.07 3.00 We have opened 2,821 new accounts during the 1st quarter of 2023, a 23% increase over 1st quarter 2022 Stable fundings from Correspondent banking relationships anchored by substantial settlement accounts Total
correspondent bank funding is 63% Settlement vs 37% Non-Settlement Deposit pipeline has increased by $244 million since year-end, or 51% Our business accounts are primarily from owner managed businesses .
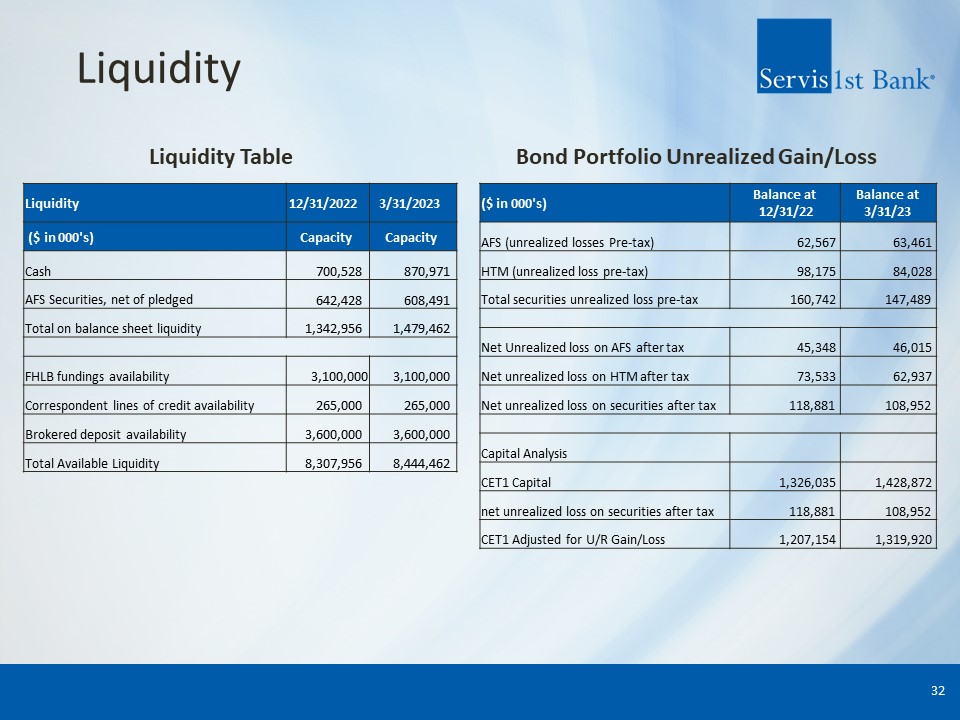
Liquidity 32 ($ in 000's) Balance at 12/31/22 Balance at 3/31/23 AFS
(unrealized losses Pre-tax) 62,567 63,461 HTM (unrealized loss pre-tax) 98,175 84,028 Total securities unrealized loss pre-tax 160,742 147,489 Net Unrealized loss on AFS after
tax 45,348 46,015 Net unrealized loss on HTM after tax 73,533 62,937 Net unrealized loss on securities after tax 118,881 108,952 Capital Analysis CET1 Capital 1,326,035 1,428,872 net unrealized loss on
securities after tax 118,881 108,952 CET1 Adjusted for U/R Gain/Loss 1,207,154 1,319,920 Liquidity Table Bond Portfolio Unrealized Gain/Loss Liquidity 12/31/2022 3/31/2023 ($ in
000's) Capacity Capacity Cash 700,528 870,971 AFS Securities, net of pledged 642,428 608,491 Total on balance sheet liquidity 1,342,956 1,479,462 FHLB fundings availability 3,100,000 3,100,000 Correspondent lines
of credit availability 265,000 265,000 Brokered deposit availability 3,600,000 3,600,000 Total Available Liquidity 8,307,956 8,444,462
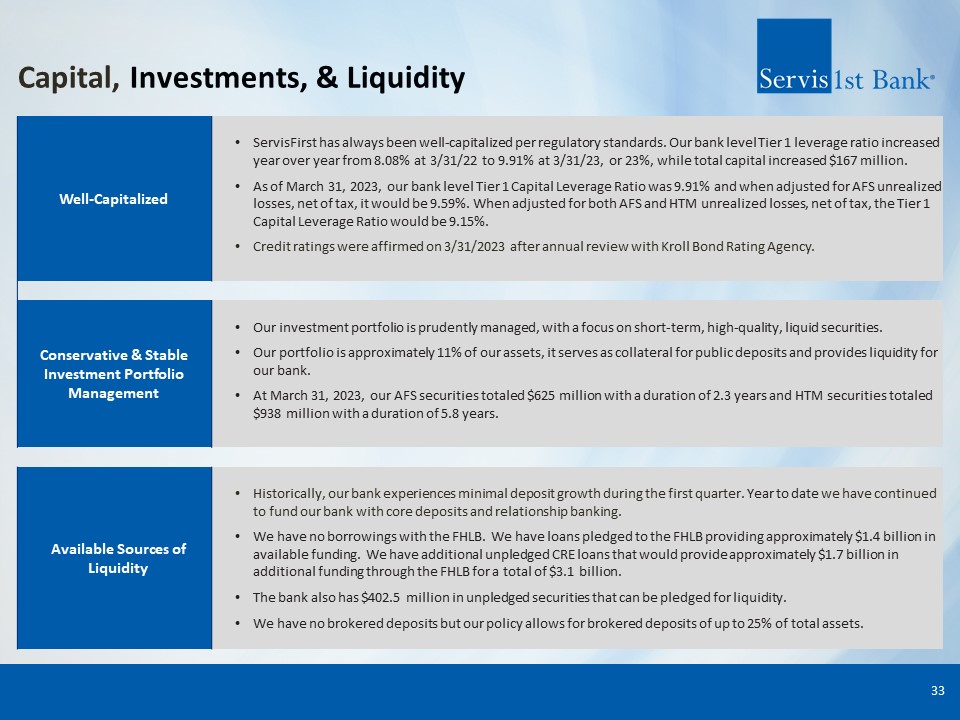
Capital, Investments, & Liquidity 33 Well-Capitalized ServisFirst has
always been well-capitalized per regulatory standards. Our bank level Tier 1 leverage ratio increased year over year from 8.08% at 3/31/22 to 9.91% at 3/31/23, or 23%, while total capital increased $167 million. As of March 31, 2023, our bank
level Tier 1 Capital Leverage Ratio was 9.91% and when adjusted for AFS unrealized losses, net of tax, it would be 9.59%. When adjusted for both AFS and HTM unrealized losses, net of tax, the Tier 1 Capital Leverage Ratio would be
9.15%. Credit ratings were affirmed on 3/31/2023 after annual review with Kroll Bond Rating Agency. Conservative & Stable Investment Portfolio Management Our investment portfolio is prudently managed, with a focus on short-term,
high-quality, liquid securities. Our portfolio is approximately 11% of our assets, it serves as collateral for public deposits and provides liquidity for our bank. At March 31, 2023, our AFS securities totaled $625 million with a duration of
2.3 years and HTM securities totaled $938 million with a duration of 5.8 years. Available Sources of Liquidity Historically, our bank experiences minimal deposit growth during the first quarter. Year to date we have continued to fund our bank
with core deposits and relationship banking. We have no borrowings with the FHLB. We have loans pledged to the FHLB providing approximately $1.4 billion in available funding. We have additional unpledged CRE loans that would provide
approximately $1.7 billion in additional funding through the FHLB for a total of $3.1 billion. The bank also has $402.5 million in unpledged securities that can be pledged for liquidity. We have no brokered deposits but our policy allows for
brokered deposits of up to 25% of total assets.
Credit Since the bank’s founding we have focused our calling efforts on owner
operated C&I companies in the Southeast. Almost half of our loan portfolio is comprised of C&I and Owner Occupied Real Estate loans, which is among the highest in our industry. The average remaining maturity of our commercial loan
portfolio is 3.5 years. Pristine Credit Quality Charge-offs for the first quarter were only $1.5MM or 5 basis points (bps) annualized. Non Performing Loans to Total Loans were 15bps which is near our historical lows. Past Dues to total
loans were 17bps for the quarter. Loan loss reserve was 1.28% of total loans at quarter-end, up from 1.25% at year end. Commercial Real Estate Office Exposure represents less than $388 million, or 3.3% of total loans with an average loan
size of $1.5MM and typically in suburban settings. Our largest office exposure credit is a $21 million suburban medical office building with a strong sponsor. Loans secured by multifamily properties total $1.36 billion or 11.7% of total loans.
These projects are focused in the Sun Belt and the bank generally has 30% - 35% equity upfront. Single family residential development represents $258 million in exposure, or 2.2% of total loans. Lot and Land exposure represents $267 million
in exposure, or 2.3% of total loans. AD&C loans as a percent of capital decreased to 93% at 3/31 down from 100% at year-end. 34

Appendix
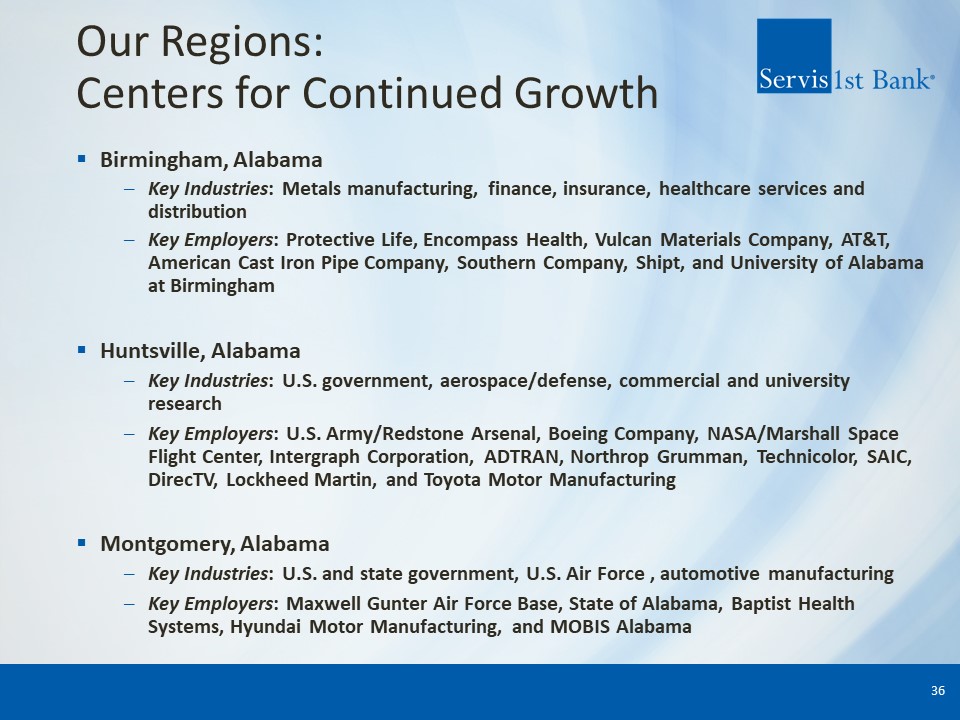
Our Regions: Centers for Continued Growth Birmingham, Alabama Key Industries:
Metals manufacturing, finance, insurance, healthcare services and distribution Key Employers: Protective Life, Encompass Health, Vulcan Materials Company, AT&T, American Cast Iron Pipe Company, Southern Company, Shipt, and University of
Alabama at Birmingham Huntsville, Alabama Key Industries: U.S. government, aerospace/defense, commercial and university research Key Employers: U.S. Army/Redstone Arsenal, Boeing Company, NASA/Marshall Space Flight Center, Intergraph
Corporation, ADTRAN, Northrop Grumman, Technicolor, SAIC, DirecTV, Lockheed Martin, and Toyota Motor Manufacturing Montgomery, Alabama Key Industries: U.S. and state government, U.S. Air Force , automotive manufacturing Key Employers:
Maxwell Gunter Air Force Base, State of Alabama, Baptist Health Systems, Hyundai Motor Manufacturing, and MOBIS Alabama 36
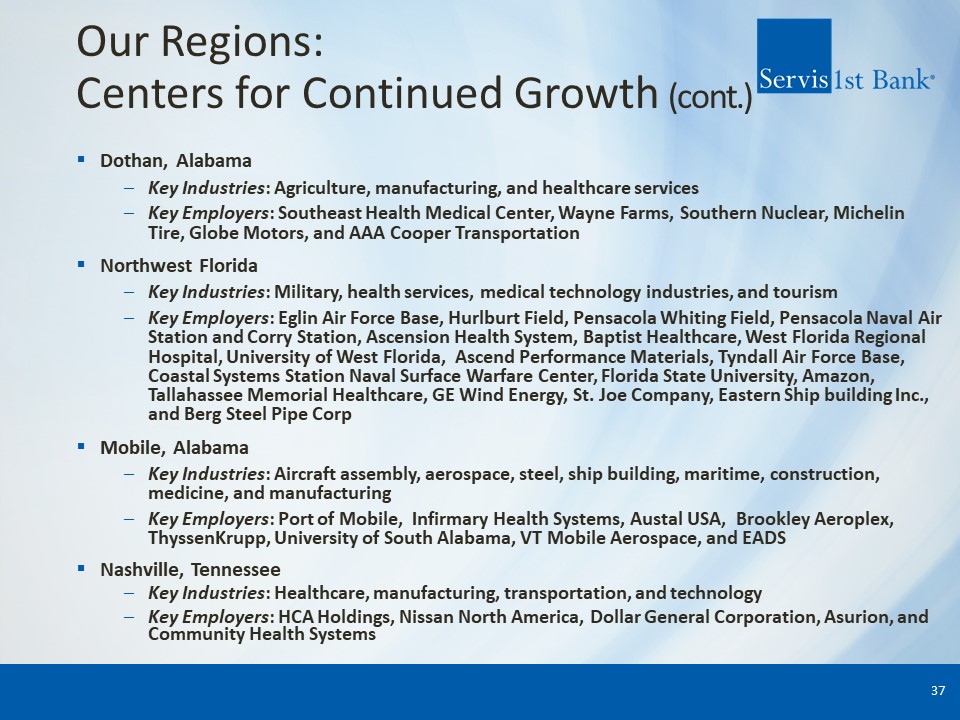
Our Regions: Centers for Continued Growth (cont.) Dothan, Alabama Key
Industries: Agriculture, manufacturing, and healthcare services Key Employers: Southeast Health Medical Center, Wayne Farms, Southern Nuclear, Michelin Tire, Globe Motors, and AAA Cooper Transportation Northwest Florida Key Industries:
Military, health services, medical technology industries, and tourism Key Employers: Eglin Air Force Base, Hurlburt Field, Pensacola Whiting Field, Pensacola Naval Air Station and Corry Station, Ascension Health System, Baptist Healthcare,
West Florida Regional Hospital, University of West Florida, Ascend Performance Materials, Tyndall Air Force Base, Coastal Systems Station Naval Surface Warfare Center, Florida State University, Amazon, Tallahassee Memorial Healthcare, GE Wind
Energy, St. Joe Company, Eastern Ship building Inc., and Berg Steel Pipe Corp Mobile, Alabama Key Industries: Aircraft assembly, aerospace, steel, ship building, maritime, construction, medicine, and manufacturing Key Employers: Port of
Mobile, Infirmary Health Systems, Austal USA, Brookley Aeroplex, ThyssenKrupp, University of South Alabama, VT Mobile Aerospace, and EADS Nashville, Tennessee Key Industries: Healthcare, manufacturing, transportation, and technology Key
Employers: HCA Holdings, Nissan North America, Dollar General Corporation, Asurion, and Community Health Systems 37
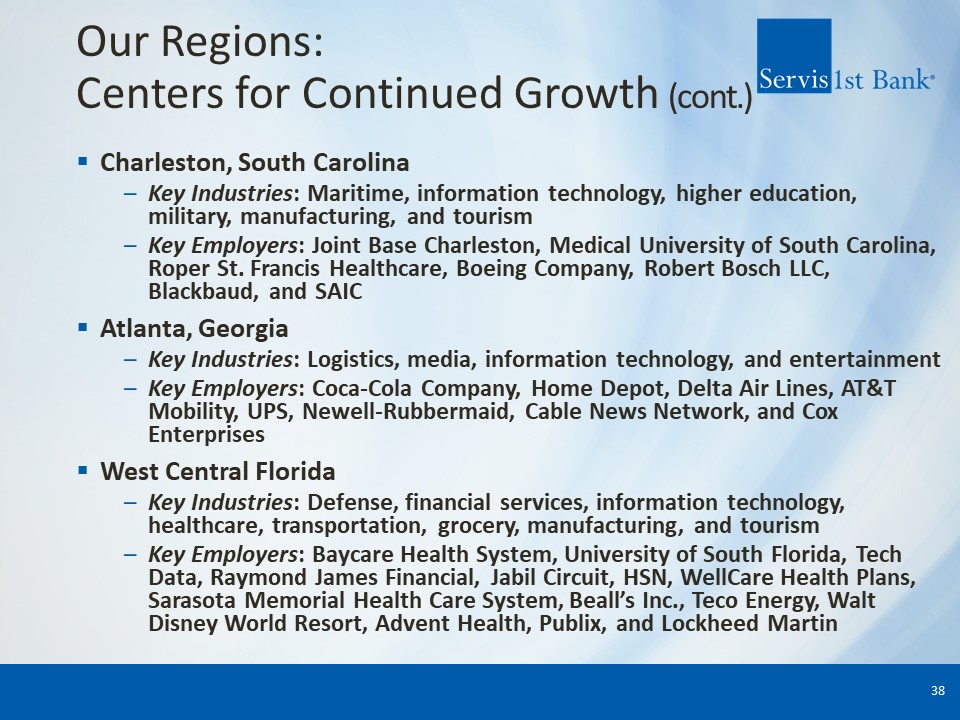
Our Regions: Centers for Continued Growth (cont.) Charleston, South Carolina Key
Industries: Maritime, information technology, higher education, military, manufacturing, and tourism Key Employers: Joint Base Charleston, Medical University of South Carolina, Roper St. Francis Healthcare, Boeing Company, Robert Bosch LLC,
Blackbaud, and SAIC Atlanta, Georgia Key Industries: Logistics, media, information technology, and entertainment Key Employers: Coca-Cola Company, Home Depot, Delta Air Lines, AT&T Mobility, UPS, Newell-Rubbermaid, Cable News Network,
and Cox Enterprises West Central Florida Key Industries: Defense, financial services, information technology, healthcare, transportation, grocery, manufacturing, and tourism Key Employers: Baycare Health System, University of South Florida,
Tech Data, Raymond James Financial, Jabil Circuit, HSN, WellCare Health Plans, Sarasota Memorial Health Care System, Beall’s Inc., Teco Energy, Walt Disney World Resort, Advent Health, Publix, and Lockheed Martin 38
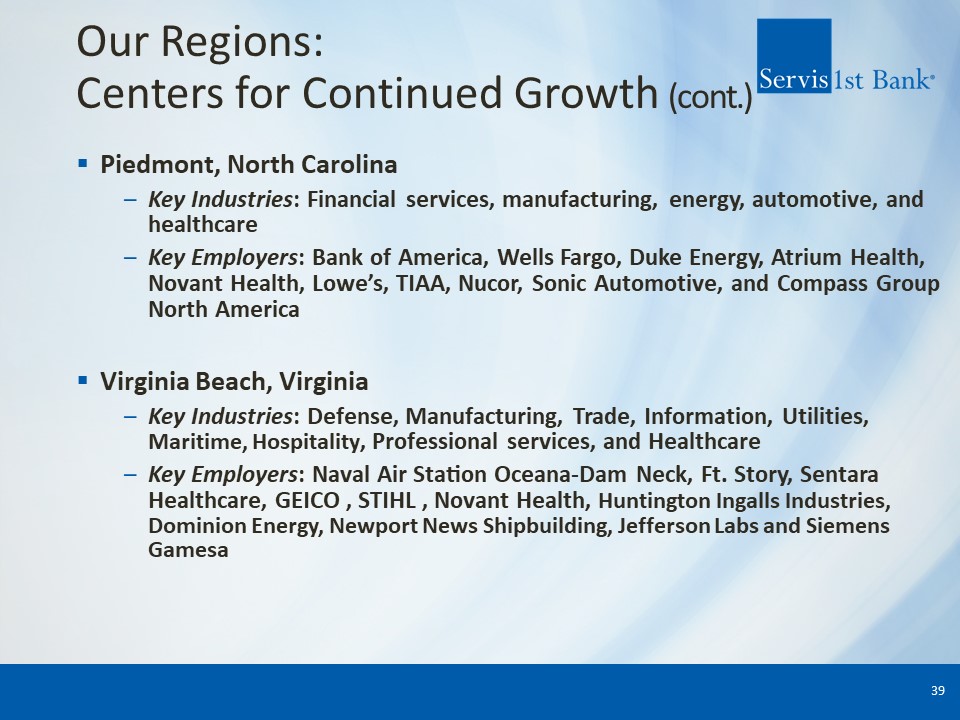
Our Regions: Centers for Continued Growth (cont.) Piedmont, North Carolina Key
Industries: Financial services, manufacturing, energy, automotive, and healthcare Key Employers: Bank of America, Wells Fargo, Duke Energy, Atrium Health, Novant Health, Lowe’s, TIAA, Nucor, Sonic Automotive, and Compass Group North
America Virginia Beach, Virginia Key Industries: Defense, Manufacturing, Trade, Information, Utilities, Maritime, Hospitality, Professional services, and Healthcare Key Employers: Naval Air Station Oceana-Dam Neck, Ft. Story, Sentara
Healthcare, GEICO , STIHL , Novant Health, Huntington Ingalls Industries, Dominion Energy, Newport News Shipbuilding, Jefferson Labs and Siemens Gamesa 39
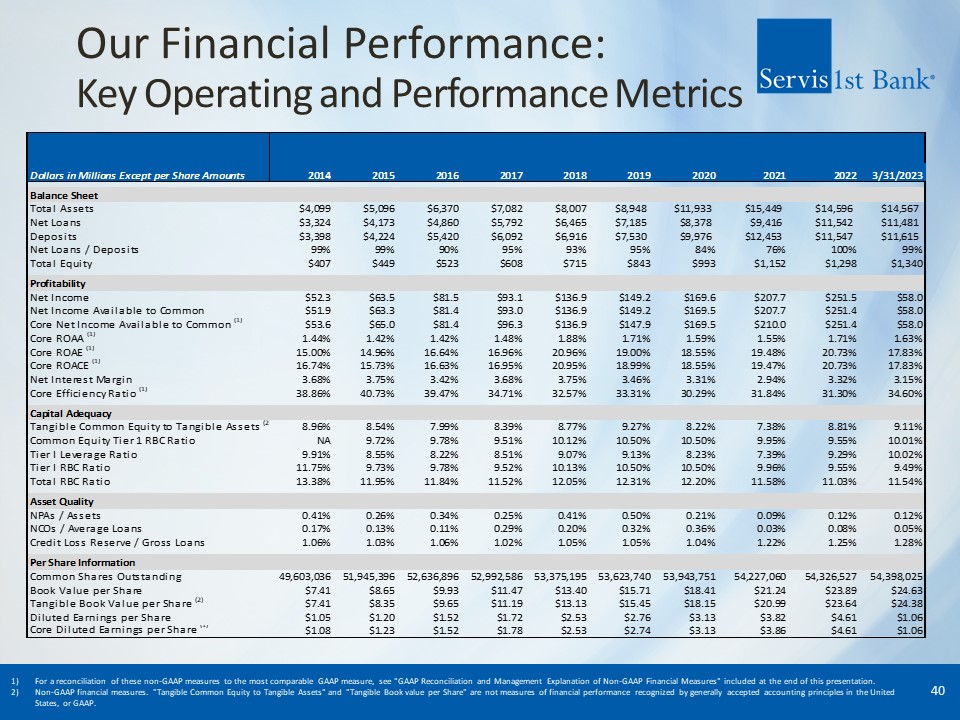
Our Financial Performance:Key Operating and Performance Metrics 40 For a
reconciliation of these non-GAAP measures to the most comparable GAAP measure, see "GAAP Reconciliation and Management Explanation of Non-GAAP Financial Measures" included at the end of this presentation. Non-GAAP financial measures.
"Tangible Common Equity to Tangible Assets" and "Tangible Book value per Share" are not measures of financial performance recognized by generally accepted accounting principles in the United States, or GAAP.
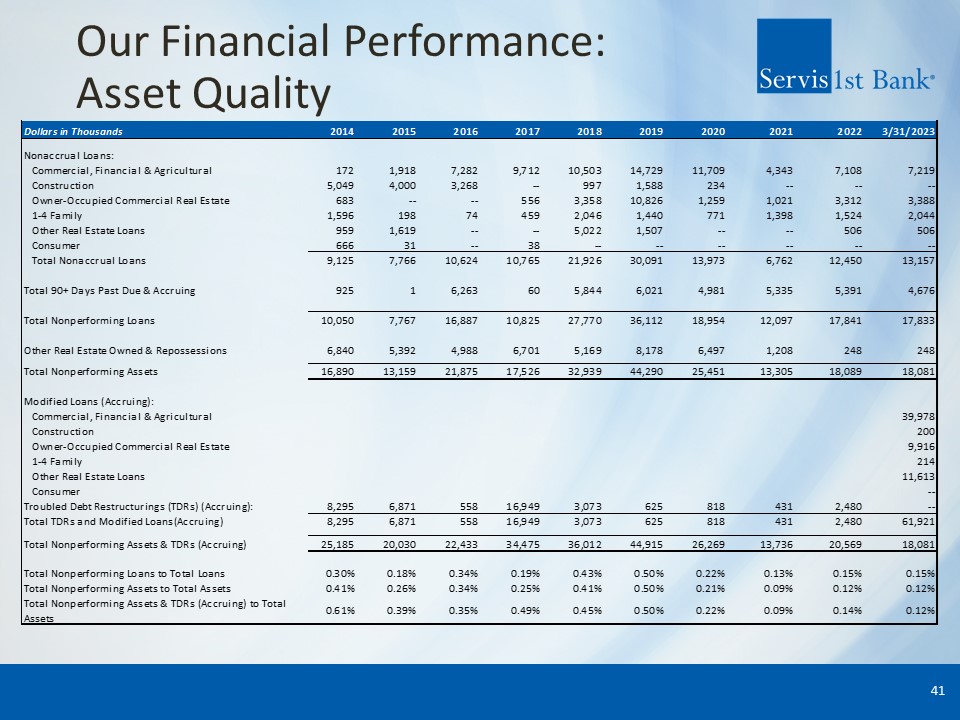
Our Financial Performance:Asset Quality 41
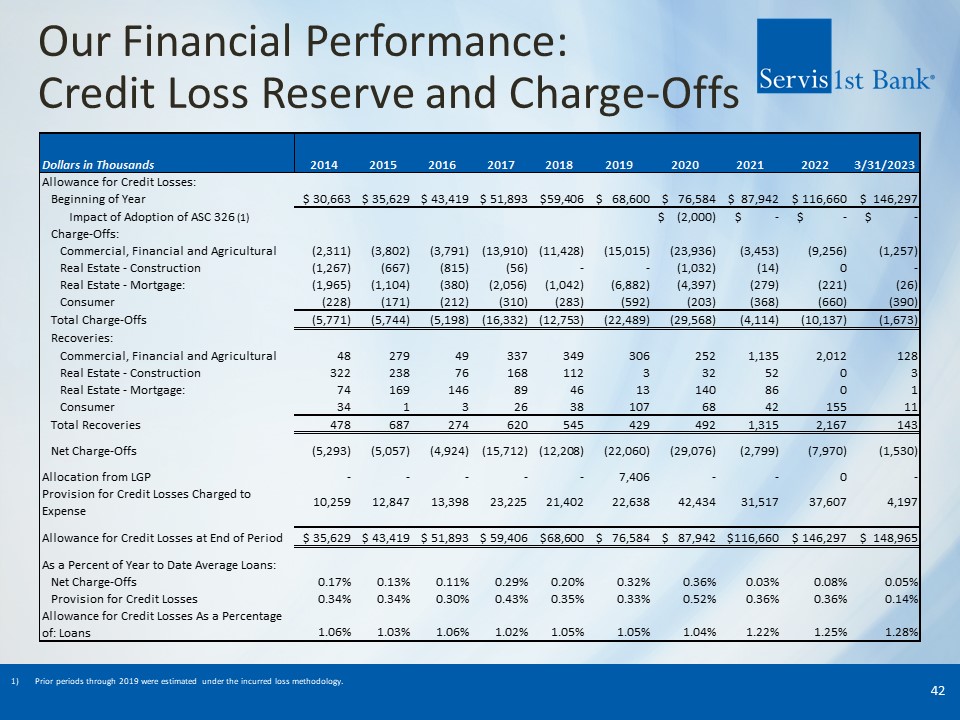
Our Financial Performance:Credit Loss Reserve and Charge-Offs 42 Prior periods
through 2019 were estimated under the incurred loss methodology.
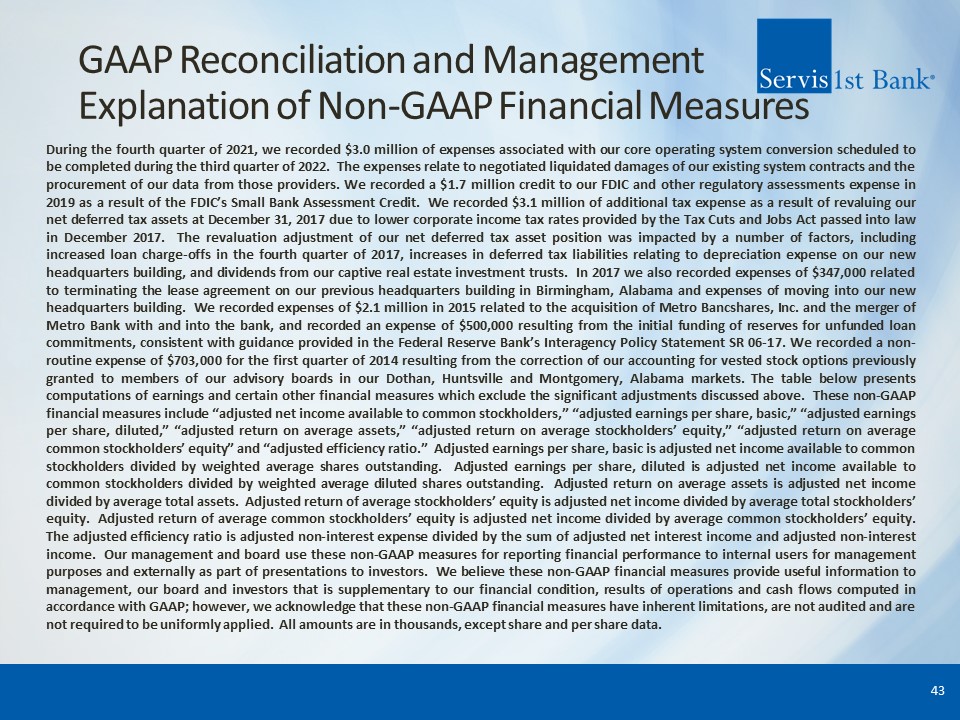
GAAP Reconciliation and Management Explanation of Non-GAAP Financial
Measures During the fourth quarter of 2021, we recorded $3.0 million of expenses associated with our core operating system conversion scheduled to be completed during the third quarter of 2022. The expenses relate to negotiated liquidated
damages of our existing system contracts and the procurement of our data from those providers. We recorded a $1.7 million credit to our FDIC and other regulatory assessments expense in 2019 as a result of the FDIC’s Small Bank Assessment
Credit. We recorded $3.1 million of additional tax expense as a result of revaluing our net deferred tax assets at December 31, 2017 due to lower corporate income tax rates provided by the Tax Cuts and Jobs Act passed into law in December 2017.
The revaluation adjustment of our net deferred tax asset position was impacted by a number of factors, including increased loan charge-offs in the fourth quarter of 2017, increases in deferred tax liabilities relating to depreciation expense on
our new headquarters building, and dividends from our captive real estate investment trusts. In 2017 we also recorded expenses of $347,000 related to terminating the lease agreement on our previous headquarters building in Birmingham, Alabama
and expenses of moving into our new headquarters building. We recorded expenses of $2.1 million in 2015 related to the acquisition of Metro Bancshares, Inc. and the merger of Metro Bank with and into the bank, and recorded an expense of
$500,000 resulting from the initial funding of reserves for unfunded loan commitments, consistent with guidance provided in the Federal Reserve Bank’s Interagency Policy Statement SR 06-17. We recorded a non-routine expense of $703,000 for the
first quarter of 2014 resulting from the correction of our accounting for vested stock options previously granted to members of our advisory boards in our Dothan, Huntsville and Montgomery, Alabama markets. The table below presents computations
of earnings and certain other financial measures which exclude the significant adjustments discussed above. These non-GAAP financial measures include “adjusted net income available to common stockholders,” “adjusted earnings per share, basic,”
“adjusted earnings per share, diluted,” “adjusted return on average assets,” “adjusted return on average stockholders’ equity,” “adjusted return on average common stockholders’ equity” and “adjusted efficiency ratio.” Adjusted earnings per
share, basic is adjusted net income available to common stockholders divided by weighted average shares outstanding. Adjusted earnings per share, diluted is adjusted net income available to common stockholders divided by weighted average
diluted shares outstanding. Adjusted return on average assets is adjusted net income divided by average total assets. Adjusted return of average stockholders’ equity is adjusted net income divided by average total stockholders’ equity. Adjusted
return of average common stockholders’ equity is adjusted net income divided by average common stockholders’ equity. The adjusted efficiency ratio is adjusted non-interest expense divided by the sum of adjusted net interest income and adjusted
non-interest income. Our management and board use these non-GAAP measures for reporting financial performance to internal users for management purposes and externally as part of presentations to investors. We believe these non-GAAP financial
measures provide useful information to management, our board and investors that is supplementary to our financial condition, results of operations and cash flows computed in accordance with GAAP; however, we acknowledge that these non-GAAP
financial measures have inherent limitations, are not audited and are not required to be uniformly applied. All amounts are in thousands, except share and per share data. 43
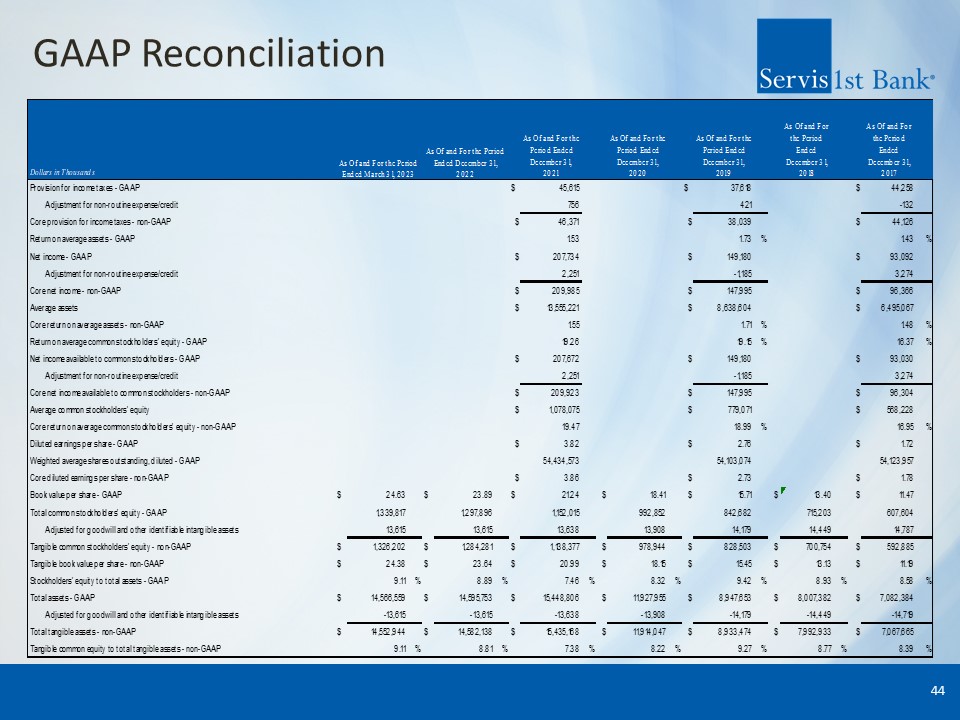
GAAP Reconciliation 44