
ServisFirst Bancshares, Inc. NYSE: SFBS April 2023
Forward-Looking Statements Statements in this press release that are not
historical facts, including, but not limited to, statements concerning future operations, results or performance, are hereby identified as "forward-looking statements" for the purpose of the safe harbor provided by Section 21E of the
Securities Exchange Act of 1934 and Section 27A of the Securities Act of 1933. The words "believe," "expect," "anticipate," "project," “plan,” “intend,” “will,” “could,” “would,” “might” and similar expressions often signify forward-looking
statements. Such statements involve inherent risks and uncertainties. ServisFirst Bancshares, Inc. cautions that such forward-looking statements, wherever they occur in this press release or in other statements attributable to ServisFirst
Bancshares, Inc., are necessarily estimates reflecting the judgment of ServisFirst Bancshares, Inc.’s senior management and involve a number of risks and uncertainties that could cause actual results to differ materially from those suggested
by the forward-looking statements. Such forward-looking statements should, therefore, be considered in light of various factors that could affect the accuracy of such forward-looking statements, including, but not limited to: the global
health and economic crisis precipitated by the COVID-19 outbreak; general economic conditions, especially in the credit markets and in the Southeast; the performance of the capital markets; changes in interest rates, yield curves and interest
rate spread relationships, including in light of the continuing high rate of domestic inflation; changes in accounting and tax principles, policies or guidelines; changes in legislation or regulatory requirements; changes in our loan
portfolio and the deposit base; economic crisis and associated credit issues in industries most impacted by the COVID-19 outbreak; possible changes in laws and regulations and governmental monetary and fiscal policies, including, but not
limited to, economic measures intended to curb rising inflation; the cost and other effects of legal and administrative cases and similar contingencies; possible changes in the creditworthiness of customers and the possible impairment of the
collectability of loans and the value of collateral; the effect of natural disasters, such as hurricanes and tornados, in our geographic markets; and increased competition from both banks and non-bank financial institutions. The foregoing
list of factors is not exhaustive. For discussion of these and other risks that may cause actual results to differ from expectations, please refer to “Cautionary Note Regarding Forward-looking Statements” and “Risk Factors” in our most recent
Annual Report on Form 10-K, in our Quarterly Reports on Form 10-Q for fiscal year 2022, and our other SEC filings. If one or more of the factors affecting our forward-looking information and statements proves incorrect, then our actual
results, performance or achievements could differ materially from those expressed in, or implied by, forward-looking information and statements contained herein. Accordingly, you should not place undue reliance on any forward-looking
statements, which speak only as of the date made. ServisFirst Bancshares, Inc. assumes no obligation to update or revise any forward-looking statements that are made from time to time. 2
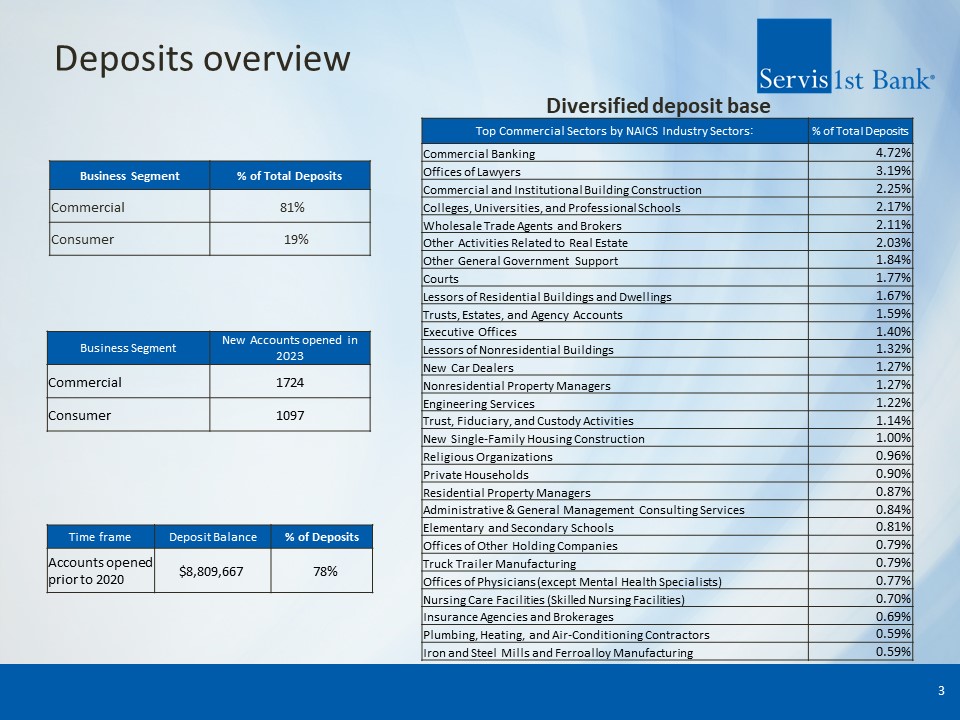
Deposits overview 3 Business Segment New Accounts opened in
2023 Commercial 1724 Consumer 1097 Diversified deposit base Top Commercial Sectors by NAICS Industry Sectors: % of Total Deposits Commercial Banking 4.72% Offices of Lawyers 3.19% Commercial and Institutional Building
Construction 2.25% Colleges, Universities, and Professional Schools 2.17% Wholesale Trade Agents and Brokers 2.11% Other Activities Related to Real Estate 2.03% Other General Government Support 1.84% Courts 1.77% Lessors of
Residential Buildings and Dwellings 1.67% Trusts, Estates, and Agency Accounts 1.59% Executive Offices 1.40% Lessors of Nonresidential Buildings 1.32% New Car Dealers 1.27% Nonresidential Property Managers 1.27% Engineering
Services 1.22% Trust, Fiduciary, and Custody Activities 1.14% New Single-Family Housing Construction 1.00% Religious Organizations 0.96% Private Households 0.90% Residential Property Managers 0.87% Administrative & General
Management Consulting Services 0.84% Elementary and Secondary Schools 0.81% Offices of Other Holding Companies 0.79% Truck Trailer Manufacturing 0.79% Offices of Physicians (except Mental Health Specialists) 0.77% Nursing Care
Facilities (Skilled Nursing Facilities) 0.70% Insurance Agencies and Brokerages 0.69% Plumbing, Heating, and Air-Conditioning Contractors 0.59% Iron and Steel Mills and Ferroalloy Manufacturing 0.59% Time frame Deposit Balance %
of Deposits Accounts opened prior to 2020 $8,809,667 78% Business Segment % of Total Deposits Commercial 81% Consumer 19%
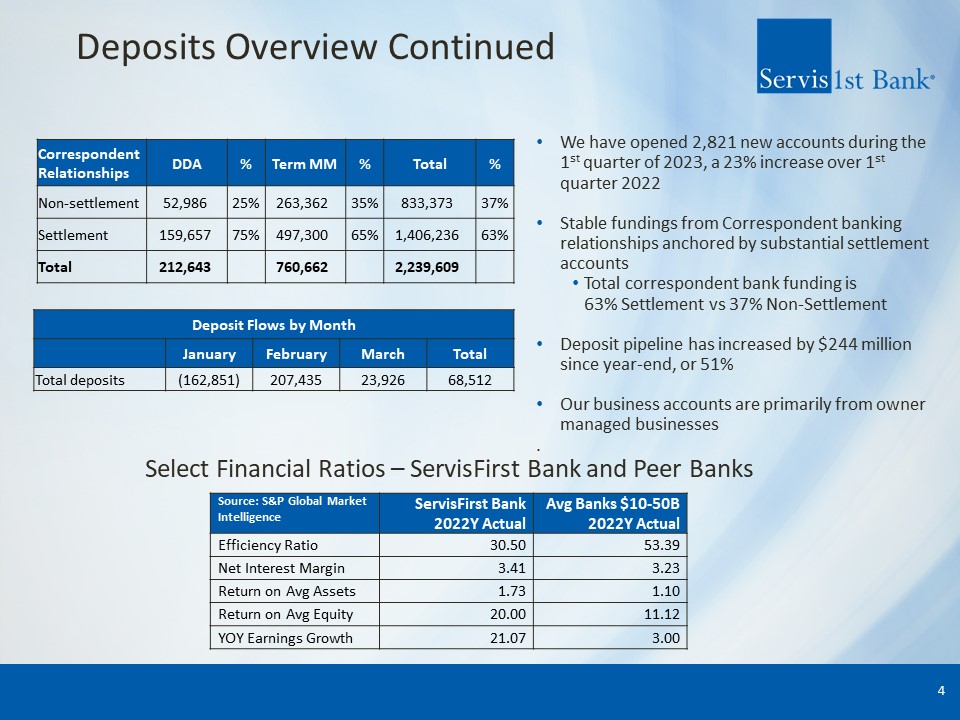
Deposits Overview Continued 4 Deposit Flows by Month Net deposit inflows
(outflows) January February March Total Total deposits (162,851) 207,435 23,926 68,512 Correspondent Relationships DDA % Term
MM % Total % Non-settlement 52,986 25% 263,362 35% 833,373 37% Settlement 159,657 75% 497,300 65% 1,406,236 63% Total 212,643 760,662 2,239,609 Select Financial Ratios – ServisFirst Bank and Peer Banks Source:
S&P Global Market Intelligence ServisFirst Bank 2022Y Actual Avg Banks $10-50B 2022Y Actual Efficiency Ratio 30.50 53.39 Net Interest Margin 3.41 3.23 Return on Avg Assets 1.73 1.10 Return on Avg Equity 20.00 11.12 YOY
Earnings Growth 21.07 3.00 We have opened 2,821 new accounts during the 1st quarter of 2023, a 23% increase over 1st quarter 2022 Stable fundings from Correspondent banking relationships anchored by substantial settlement accounts Total
correspondent bank funding is 63% Settlement vs 37% Non-Settlement Deposit pipeline has increased by $244 million since year-end, or 51% Our business accounts are primarily from owner managed businesses .
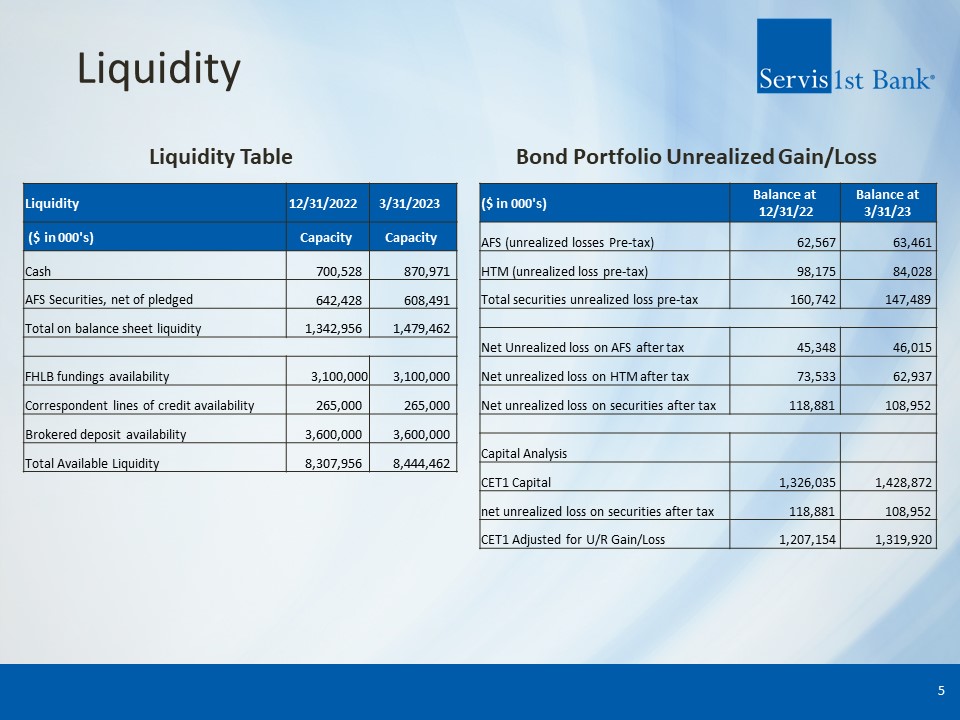
Liquidity 5 ($ in 000's) Balance at 12/31/22 Balance at 3/31/23 AFS
(unrealized losses Pre-tax) 62,567 63,461 HTM (unrealized loss pre-tax) 98,175 84,028 Total securities unrealized loss pre-tax 160,742 147,489 Net Unrealized loss on AFS after
tax 45,348 46,015 Net unrealized loss on HTM after tax 73,533 62,937 Net unrealized loss on securities after tax 118,881 108,952 Capital Analysis CET1 Capital 1,326,035 1,428,872 net unrealized loss on
securities after tax 118,881 108,952 CET1 Adjusted for U/R Gain/Loss 1,207,154 1,319,920 Liquidity Table Bond Portfolio Unrealized Gain/Loss Liquidity 12/31/2022 3/31/2023 ($ in
000's) Capacity Capacity Cash 700,528 870,971 AFS Securities, net of pledged 642,428 608,491 Total on balance sheet liquidity 1,342,956 1,479,462 FHLB fundings availability 3,100,000 3,100,000 Correspondent lines
of credit availability 265,000 265,000 Brokered deposit availability 3,600,000 3,600,000 Total Available Liquidity 8,307,956 8,444,462
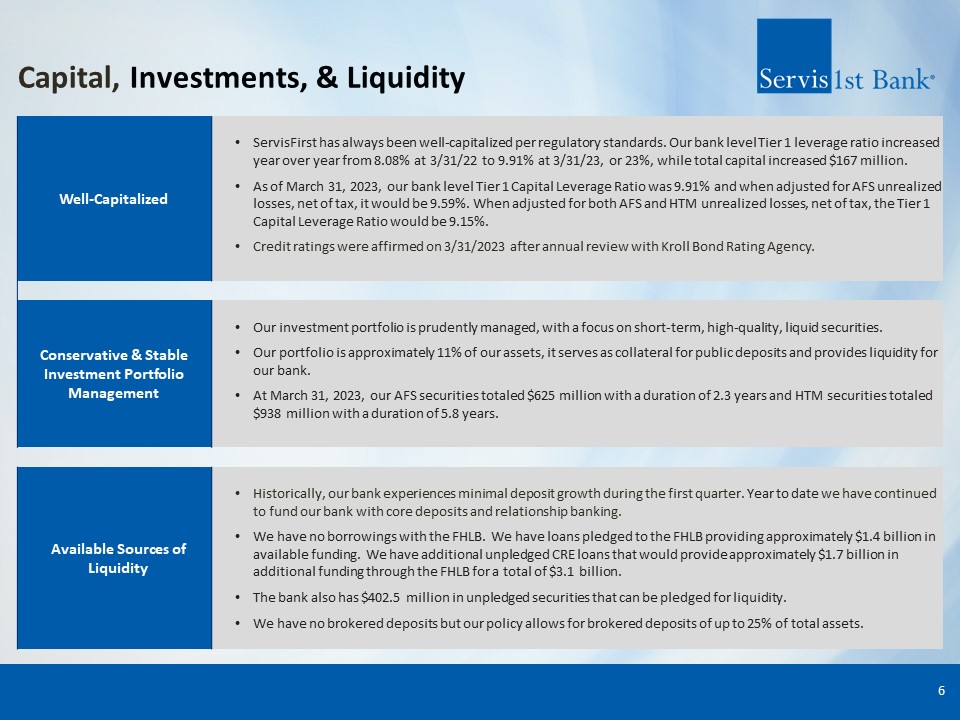
Capital, Investments, & Liquidity 6 Well-Capitalized ServisFirst has
always been well-capitalized per regulatory standards. Our bank level Tier 1 leverage ratio increased year over year from 8.08% at 3/31/22 to 9.91% at 3/31/23, or 23%, while total capital increased $167 million. As of March 31, 2023,
our bank level Tier 1 Capital Leverage Ratio was 9.91% and when adjusted for AFS unrealized losses, net of tax, it would be 9.59%. When adjusted for both AFS and HTM unrealized losses, net of tax, the Tier 1 Capital Leverage Ratio would be
9.15%. Credit ratings were affirmed on 3/31/2023 after annual review with Kroll Bond Rating Agency. Conservative & Stable Investment Portfolio Management Our investment portfolio is prudently managed, with a focus on short-term,
high-quality, liquid securities. Our portfolio is approximately 11% of our assets, it serves as collateral for public deposits and provides liquidity for our bank. At March 31, 2023, our AFS securities totaled $625 million with a duration
of 2.3 years and HTM securities totaled $938 million with a duration of 5.8 years. Available Sources of Liquidity Historically, our bank experiences minimal deposit growth during the first quarter. Year to date we have continued to fund our
bank with core deposits and relationship banking. We have no borrowings with the FHLB. We have loans pledged to the FHLB providing approximately $1.4 billion in available funding. We have additional unpledged CRE loans that would provide
approximately $1.7 billion in additional funding through the FHLB for a total of $3.1 billion. The bank also has $402.5 million in unpledged securities that can be pledged for liquidity. We have no brokered deposits but our policy allows
for brokered deposits of up to 25% of total assets.
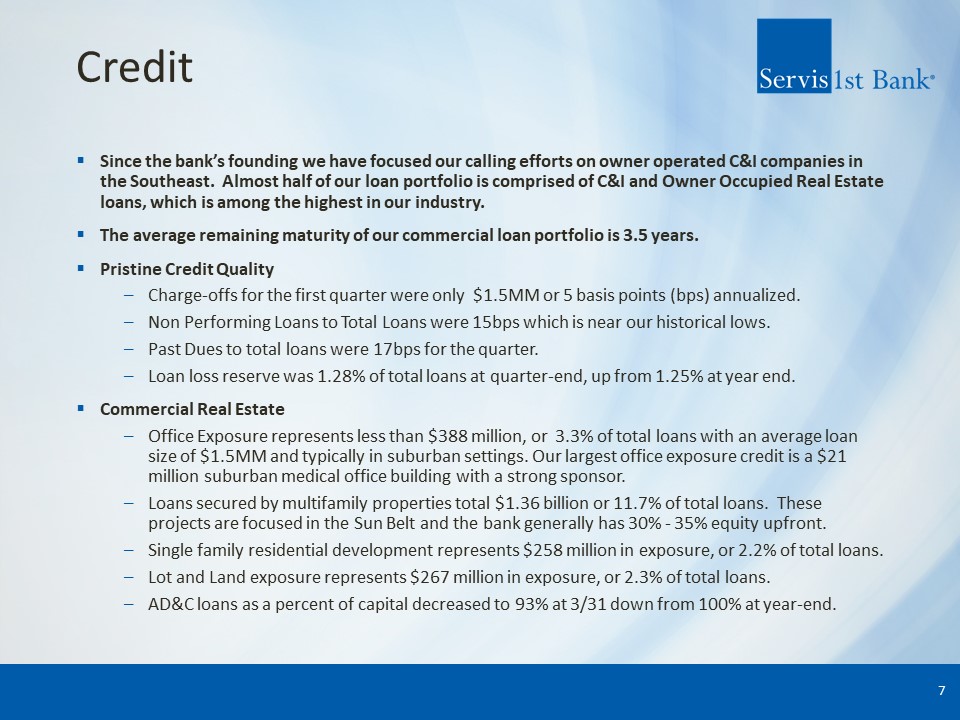
Credit Since the bank’s founding we have focused our calling efforts on owner
operated C&I companies in the Southeast. Almost half of our loan portfolio is comprised of C&I and Owner Occupied Real Estate loans, which is among the highest in our industry. The average remaining maturity of our commercial loan
portfolio is 3.5 years. Pristine Credit Quality Charge-offs for the first quarter were only $1.5MM or 5 basis points (bps) annualized. Non Performing Loans to Total Loans were 15bps which is near our historical lows. Past Dues to total
loans were 17bps for the quarter. Loan loss reserve was 1.28% of total loans at quarter-end, up from 1.25% at year end. Commercial Real Estate Office Exposure represents less than $388 million, or 3.3% of total loans with an average loan
size of $1.5MM and typically in suburban settings. Our largest office exposure credit is a $21 million suburban medical office building with a strong sponsor. Loans secured by multifamily properties total $1.36 billion or 11.7% of total
loans. These projects are focused in the Sun Belt and the bank generally has 30% - 35% equity upfront. Single family residential development represents $258 million in exposure, or 2.2% of total loans. Lot and Land exposure represents $267
million in exposure, or 2.3% of total loans. AD&C loans as a percent of capital decreased to 93% at 3/31 down from 100% at year-end. 7