
ServisFirst Bancshares, Inc.NYSE: SFBSMay 2022
Forward-Looking Statements Statements in this press release that are not historical facts, including,
but not limited to, statements concerning future operations, results or performance, are hereby identified as "forward-looking statements" for the purpose of the safe harbor provided by Section 21E of the Securities Exchange Act of 1934 and
Section 27A of the Securities Act of 1933. The words "believe," "expect," "anticipate," "project," “plan,” “intend,” “will,” “could,” “would,” “might” and similar expressions often signify forward-looking statements. Such statements involve
inherent risks and uncertainties. ServisFirst Bancshares, Inc. cautions that such forward-looking statements, wherever they occur in this press release or in other statements attributable to ServisFirst Bancshares, Inc., are necessarily
estimates reflecting the judgment of ServisFirst Bancshares, Inc.’s senior management and involve a number of risks and uncertainties that could cause actual results to differ materially from those suggested by the forward-looking statements.
Such forward-looking statements should, therefore, be considered in light of various factors that could affect the accuracy of such forward-looking statements, including, but not limited to: the global health and economic crisis precipitated by
the COVID-19 outbreak; general economic conditions, especially in the credit markets and in the Southeast; the performance of the capital markets; changes in interest rates, yield curves and interest rate spread relationships, including in
light of the continuing high rate of domestic inflation; changes in accounting and tax principles, policies or guidelines; changes in legislation or regulatory requirements; changes in our loan portfolio and the deposit base; economic crisis
and associated credit issues in industries most impacted by the COVID-19 outbreak; possible changes in laws and regulations and governmental monetary and fiscal policies, including, but not limited to, economic measures intended to curb rising
inflation; the cost and other effects of legal and administrative cases and similar contingencies; possible changes in the creditworthiness of customers and the possible impairment of the collectability of loans and the value of collateral; the
effect of natural disasters, such as hurricanes and tornados, in our geographic markets; and increased competition from both banks and non-bank financial institutions. The foregoing list of factors is not exhaustive. For discussion of these and
other risks that may cause actual results to differ from expectations, please refer to “Cautionary Note Regarding Forward-looking Statements” and “Risk Factors” in our most recent Annual Report on Form 10-K, in our Quarterly Reports on Form
10-Q for fiscal year 2021, and our other SEC filings. If one or more of the factors affecting our forward-looking information and statements proves incorrect, then our actual results, performance or achievements could differ materially from
those expressed in, or implied by, forward-looking information and statements contained herein. Accordingly, you should not place undue reliance on any forward-looking statements, which speak only as of the date made. ServisFirst Bancshares,
Inc. assumes no obligation to update or revise any forward-looking statements that are made from time to time. Non-GAAP Financial Measures - This presentation includes non-GAAP financial measures. Information about any such non-GAAP financial
measures, including a reconciliation of those measures to GAAP, can be found in the presentation. 2
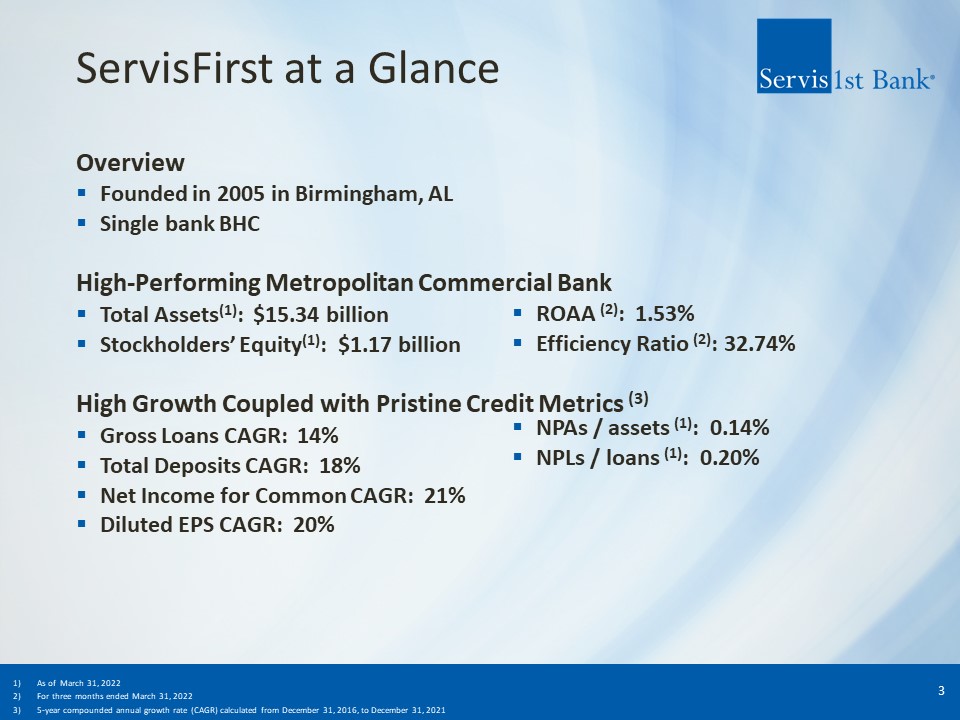
ServisFirst at a Glance OverviewFounded in 2005 in Birmingham, ALSingle bank BHCHigh-Performing
Metropolitan Commercial Bank Total Assets(1): $15.34 billionStockholders’ Equity(1): $1.17 billion High Growth Coupled with Pristine Credit Metrics (3)Gross Loans CAGR: 14%Total Deposits CAGR: 18%Net Income for Common CAGR: 21%Diluted EPS CAGR:
20% ROAA (2): 1.53%Efficiency Ratio (2): 32.74% As of March 31, 2022For three months ended March 31, 20225-year compounded annual growth rate (CAGR) calculated from December 31, 2016, to December 31, 2021 NPAs / assets (1): 0.14%NPLs / loans
(1): 0.20% 3
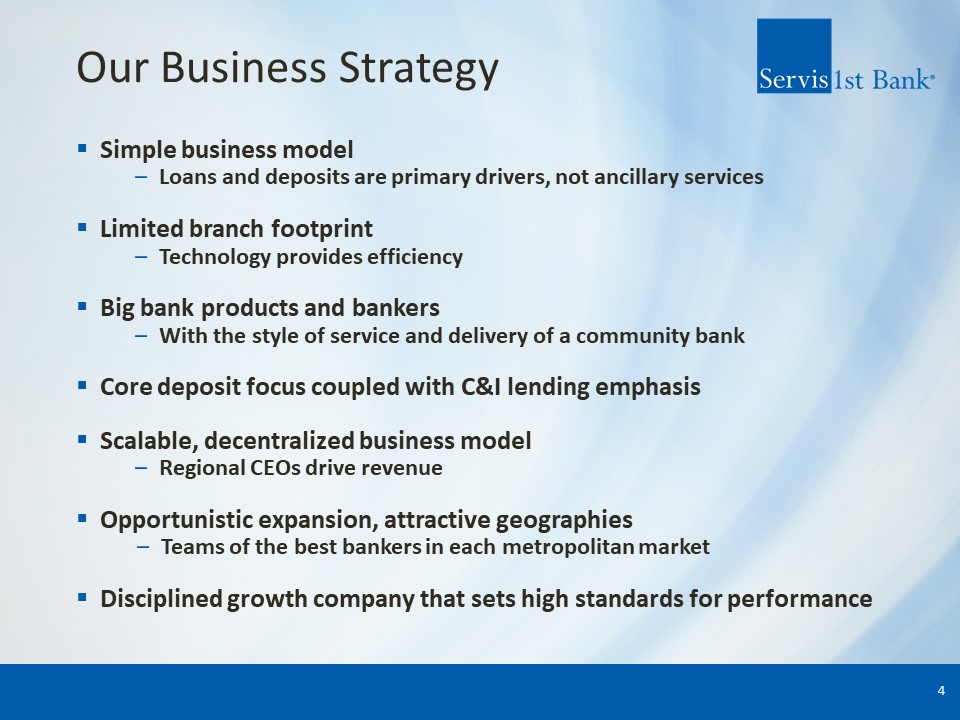
Our Business Strategy Simple business modelLoans and deposits are primary drivers, not ancillary
servicesLimited branch footprintTechnology provides efficiencyBig bank products and bankersWith the style of service and delivery of a community bankCore deposit focus coupled with C&I lending emphasisScalable, decentralized business
modelRegional CEOs drive revenueOpportunistic expansion, attractive geographiesTeams of the best bankers in each metropolitan marketDisciplined growth company that sets high standards for performance 4
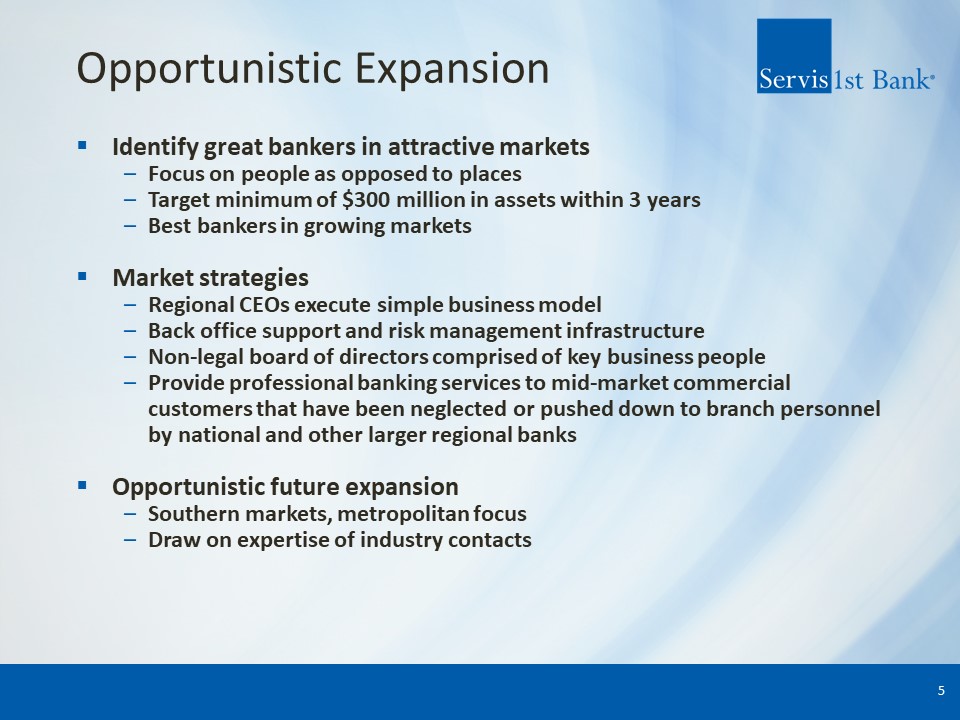
Opportunistic Expansion Identify great bankers in attractive marketsFocus on people as opposed to
placesTarget minimum of $300 million in assets within 3 yearsBest bankers in growing marketsMarket strategiesRegional CEOs execute simple business modelBack office support and risk management infrastructureNon-legal board of directors comprised
of key business peopleProvide professional banking services to mid-market commercial customers that have been neglected or pushed down to branch personnel by national and other larger regional banksOpportunistic future expansionSouthern
markets, metropolitan focusDraw on expertise of industry contacts 5
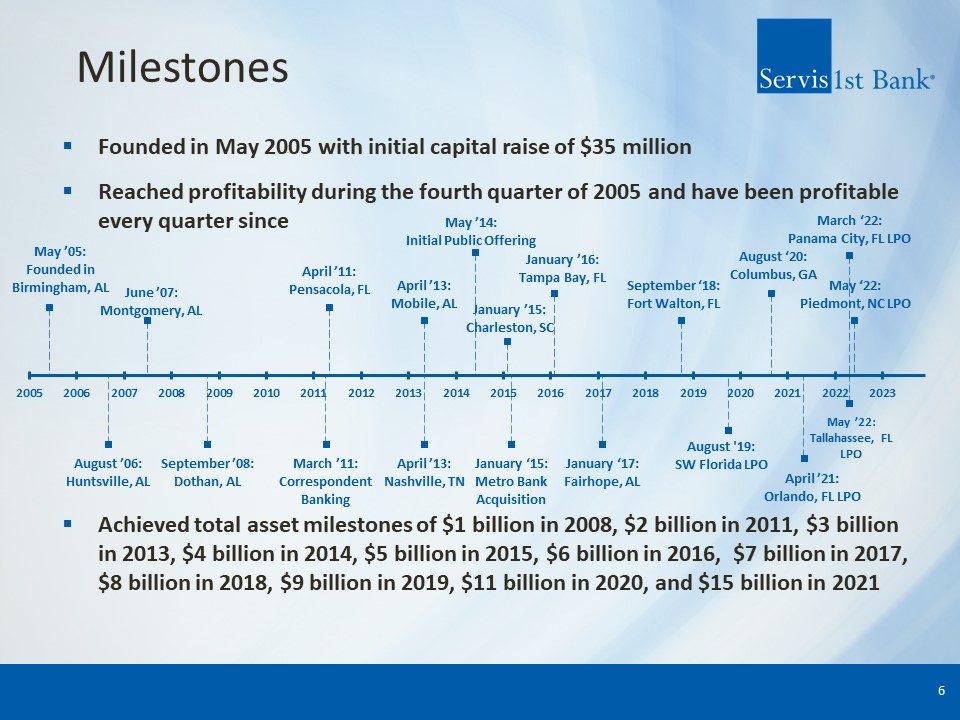
Milestones 6 Founded in May 2005 with initial capital raise of $35 millionReached profitability during
the fourth quarter of 2005 and have been profitable every quarter sinceAchieved total asset milestones of $1 billion in 2008, $2 billion in 2011, $3 billion in 2013, $4 billion in 2014, $5 billion in 2015, $6 billion in 2016, $7 billion in
2017, $8 billion in 2018, $9 billion in 2019, $11 billion in 2020, and $15 billion in 2021
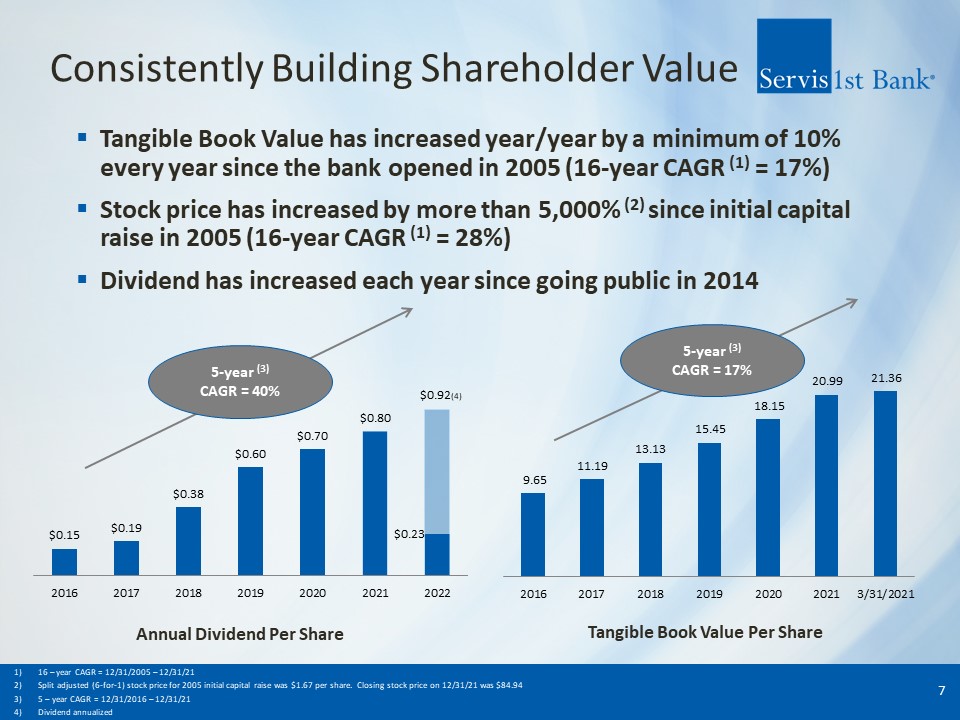
Consistently Building Shareholder Value Tangible Book Value has increased year/year by a minimum of 10%
every year since the bank opened in 2005 (16-year CAGR (1) = 17%)Stock price has increased by more than 5,000% (2) since initial capital raise in 2005 (16-year CAGR (1) = 28%)Dividend has increased each year since going public in
2014 7 5-year (3) CAGR = 40% 5-year (3) CAGR = 17% Annual Dividend Per Share Tangible Book Value Per Share 16 – year CAGR = 12/31/2005 – 12/31/21Split adjusted (6-for-1) stock price for 2005 initial capital raise was $1.67 per share.
Closing stock price on 12/31/21 was $84.94 5 – year CAGR = 12/31/2016 – 12/31/21Dividend annualized
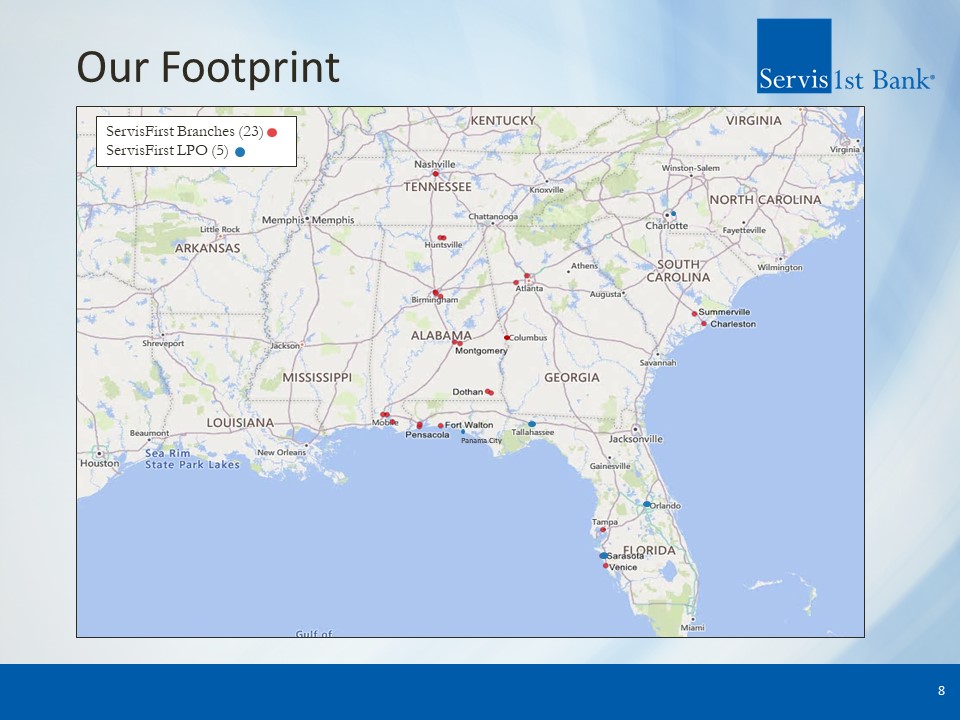
Our Footprint 8 ServisFirst Branches (23)ServisFirst LPO (5) Panama City
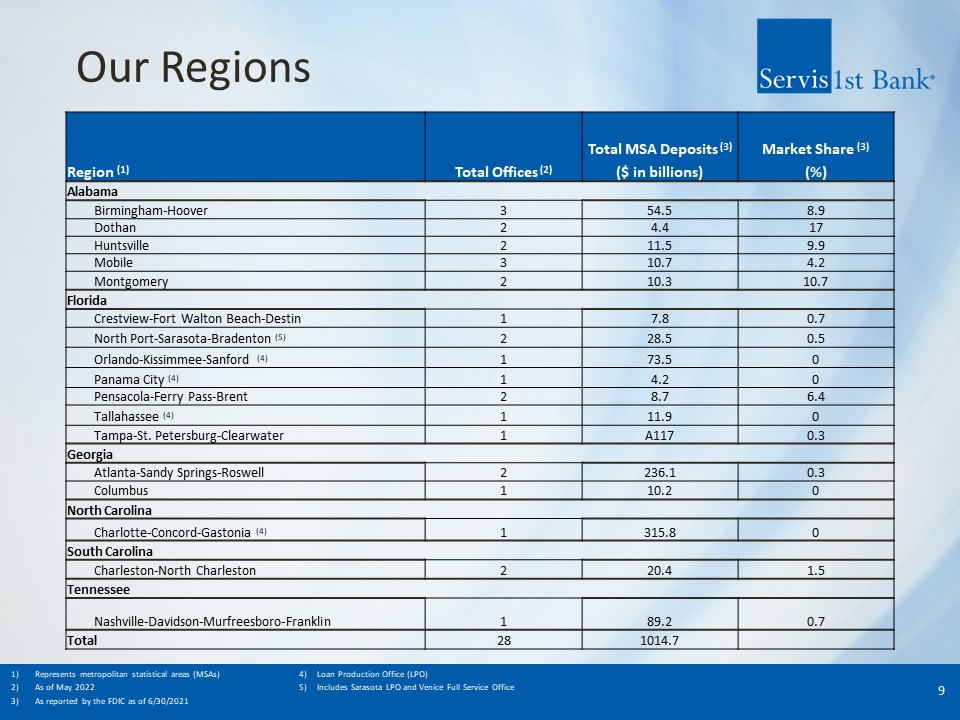
Our Regions 9 Represents metropolitan statistical areas (MSAs) 4) Loan Production Office (LPO)As of
May 2022 5) Includes Sarasota LPO and Venice Full Service Office As reported by the FDIC as of 6/30/2021 Region (1) Total Offices (2) Total MSA Deposits (3) Market Share (3) ($ in
billions) (%) Alabama Birmingham-Hoover 3 54.5 8.9 Dothan 2 4.4 17 Huntsville 2 11.5 9.9 Mobile 3 10.7 4.2 Montgomery 2 10.3 10.7 Florida Crestview-Fort Walton
Beach-Destin 1 7.8 0.7 North Port-Sarasota-Bradenton (5) 2 28.5 0.5 Orlando-Kissimmee-Sanford (4) 1 73.5 0 Panama City (4) 1 4.2 0 Pensacola-Ferry Pass-Brent 2 8.7 6.4 Tallahassee (4) 1 11.9 0 Tampa-St.
Petersburg-Clearwater 1 A117 0.3 Georgia Atlanta-Sandy Springs-Roswell 2 236.1 0.3 Columbus 1 10.2 0 North Carolina Charlotte-Concord-Gastonia (4) 1 315.8 0 South Carolina Charleston-North
Charleston 2 20.4 1.5 Tennessee Nashville-Davidson-Murfreesboro-Franklin 1 89.2 0.7 Total 28 1014.7
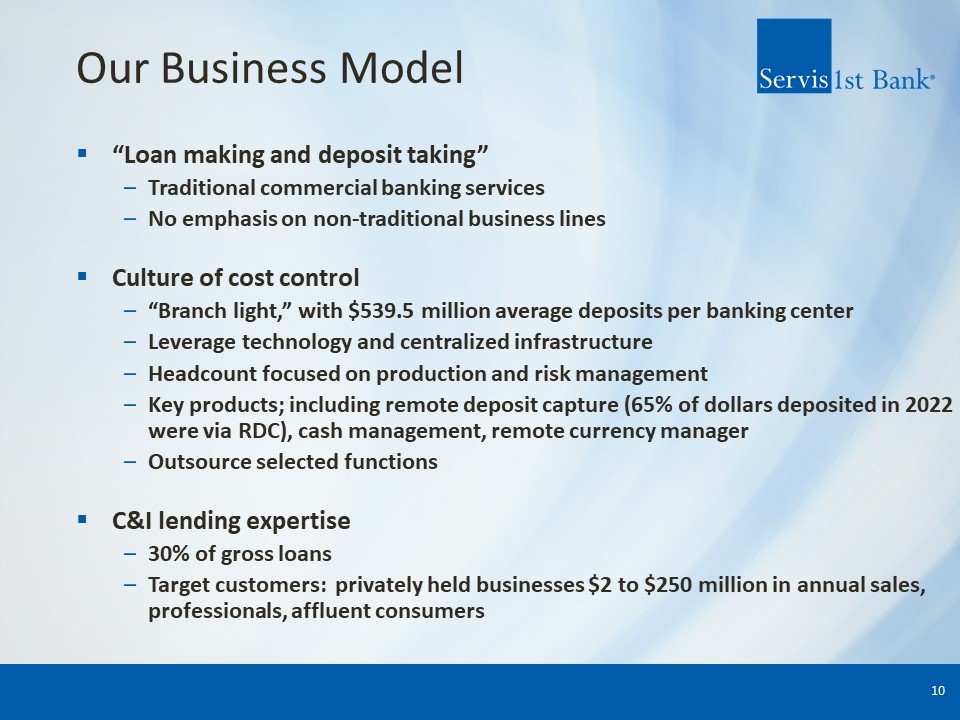
Our Business Model “Loan making and deposit taking”Traditional commercial banking servicesNo emphasis on
non-traditional business linesCulture of cost control“Branch light,” with $539.5 million average deposits per banking centerLeverage technology and centralized infrastructureHeadcount focused on production and risk managementKey products;
including remote deposit capture (65% of dollars deposited in 2022 were via RDC), cash management, remote currency managerOutsource selected functionsC&I lending expertise30% of gross loans Target customers: privately held businesses $2 to
$250 million in annual sales, professionals, affluent consumers 10
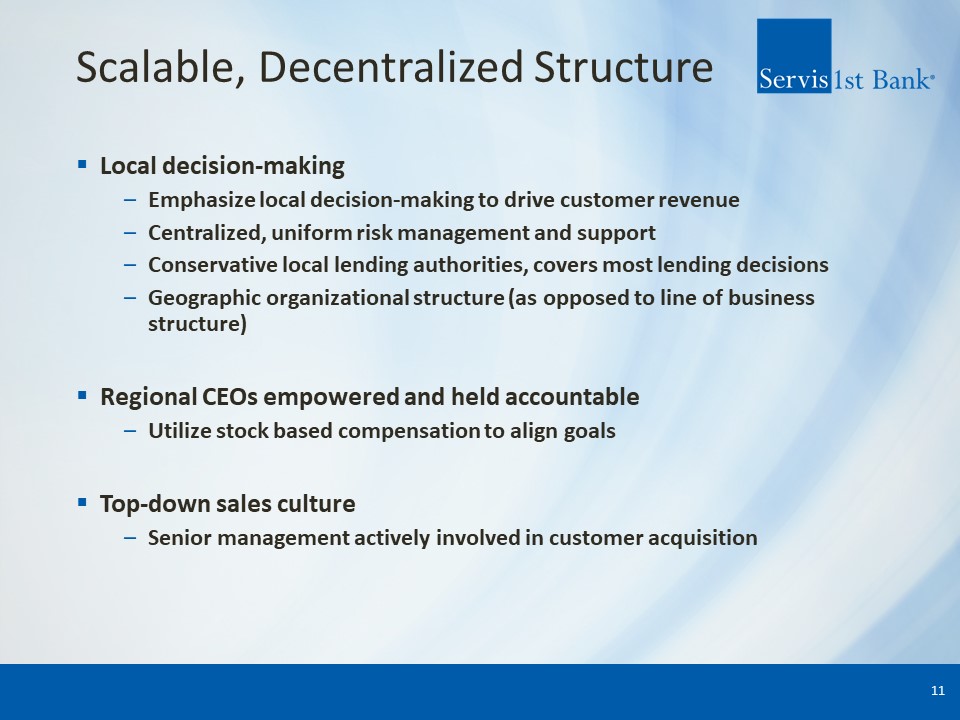
Scalable, Decentralized Structure Local decision-makingEmphasize local decision-making to drive customer
revenueCentralized, uniform risk management and supportConservative local lending authorities, covers most lending decisionsGeographic organizational structure (as opposed to line of business structure)Regional CEOs empowered and held
accountableUtilize stock based compensation to align goalsTop-down sales cultureSenior management actively involved in customer acquisition 11
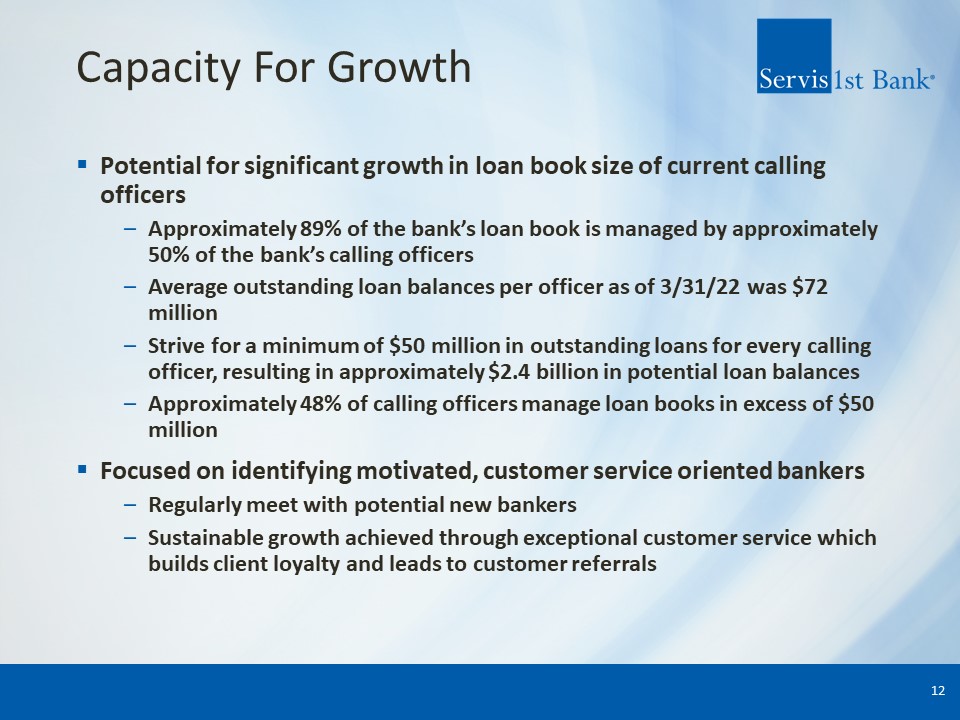
Capacity For Growth Potential for significant growth in loan book size of current calling
officersApproximately 89% of the bank’s loan book is managed by approximately 50% of the bank’s calling officersAverage outstanding loan balances per officer as of 3/31/22 was $72 millionStrive for a minimum of $50 million in outstanding loans
for every calling officer, resulting in approximately $2.4 billion in potential loan balancesApproximately 48% of calling officers manage loan books in excess of $50 millionFocused on identifying motivated, customer service oriented
bankersRegularly meet with potential new bankersSustainable growth achieved through exceptional customer service which builds client loyalty and leads to customer referrals 12
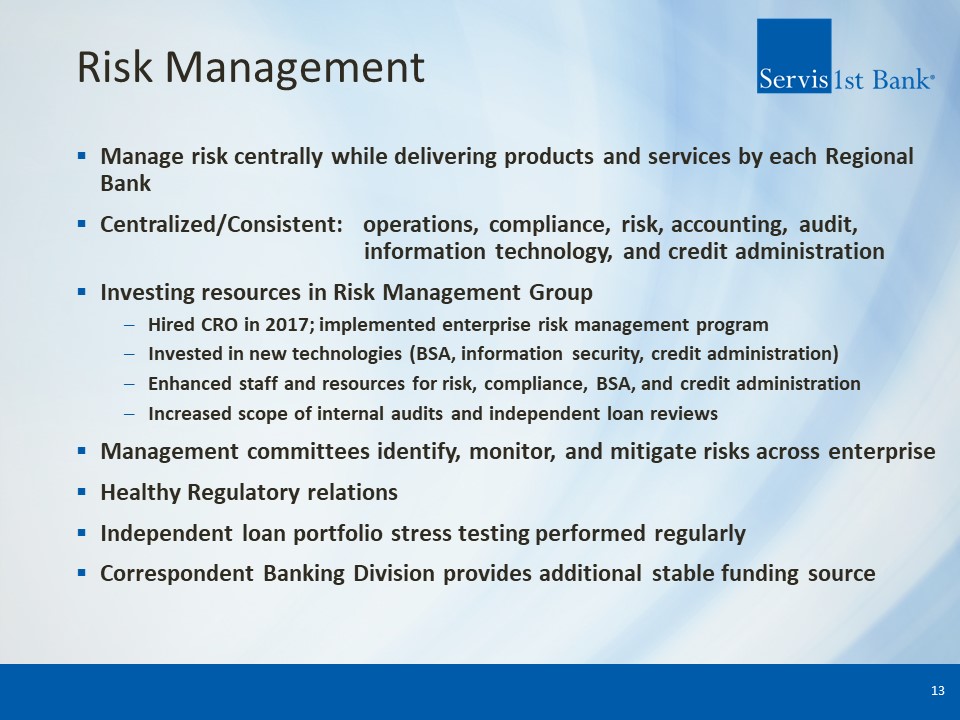
Risk Management Manage risk centrally while delivering products and services by each Regional
BankCentralized/Consistent: operations, compliance, risk, accounting, audit, information technology, and credit administration Investing resources in Risk Management GroupHired CRO in 2017; implemented enterprise risk management programInvested
in new technologies (BSA, information security, credit administration)Enhanced staff and resources for risk, compliance, BSA, and credit administrationIncreased scope of internal audits and independent loan reviewsManagement committees
identify, monitor, and mitigate risks across enterpriseHealthy Regulatory relationsIndependent loan portfolio stress testing performed regularlyCorrespondent Banking Division provides additional stable funding source 13
Risk ManagementCredit Process Lending focuses on middle market clients with Regional CEO and credit
officers approving secured loan relationship up to $5MM; relationships greater than $5MM are approved by the CCO and/or members of executive managementCentralized monitoring of ABL relationships greater than $2MM and centralized monitoring of
commercial construction projects greater than $3MMIndependent loan review examines 35% of the committed balances annually to affirm risk rating accuracy and proper documentation The top three industry exposures as of 3/31/22 are: Real Estate
(31%), Service Industry (10%) and Healthcare & Social Assistance (9%).The top three C&I portfolio industries are: Manufacturing (11%), Wholesale (10%), and Retail (10%) 14
Risk ManagementCredit Process The Bank does not lead any Share National Credits (SNCs); the Bank does
participate in 11 relationships that are classified as SNCs with current balances of $134MM as of 3/31/22As of 3/31/22, CRE as a percent of capital was 290% and AD&C as a percent of capital was 86%Approximately 87% of the Bank’s CRE loans
are located in Bank’s five state footprintAs of 3/31/22, variable rate loans account for 38% of the loan portfolio, excluding loans from the Paycheck Protection Program (PPP)79% of variable rate loans have a floor and the average floor rate is
4.08%The Bank’s average net credit loss from 2008 through 2010 was 52 basis points compared to a peer (1) average of 121 basis points 15 Peer Group 4 as defined by The Uniform Bank Performance Report (UBPR)
Impact From Crossing $10 Billion Asset Threshold Anticipate relatively small economic and regulatory
impact due to our commercial banking focus and the staffing infrastructure put in place in recent years The Durbin Amendment will limit debit card interchange feesDurbin Amendment will take effect on July 1, 2022Anticipated loss of annual
revenue is approximately $950,000 Increased regulatory scrutiny and enhanced supervisory standardsRecently adopted a formal enterprise risk management policyRamped up compliance related staffing in recent yearsIncreased capacity for
asset/liability modeling and stress testing 16
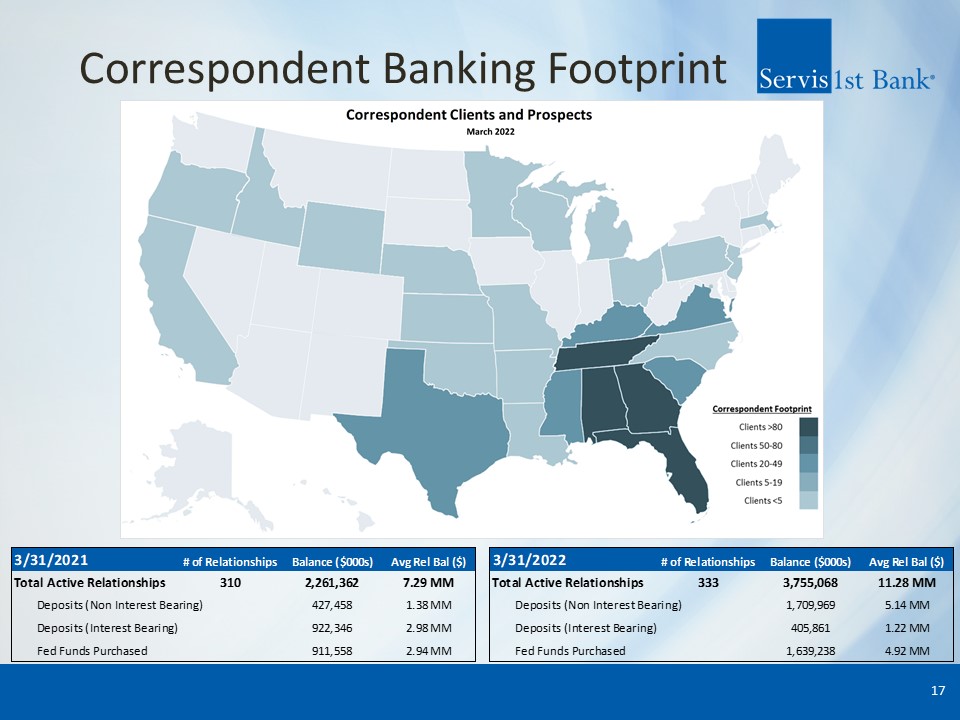
Correspondent Banking Footprint 17
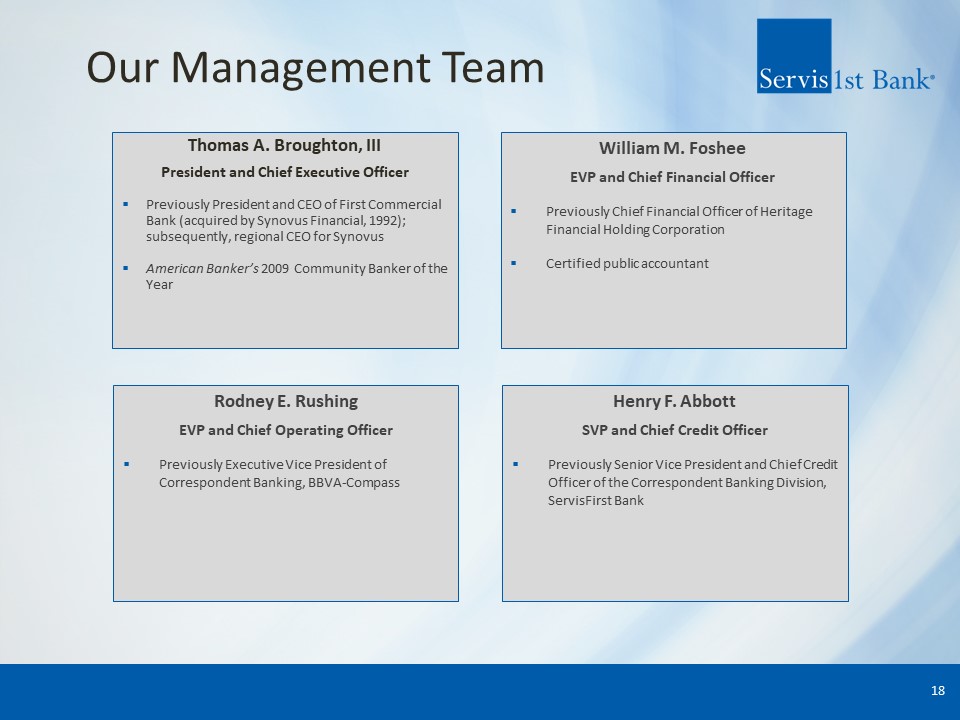
Our Management Team Thomas A. Broughton, IIIPresident and Chief Executive OfficerPreviously President
and CEO of First Commercial Bank (acquired by Synovus Financial, 1992); subsequently, regional CEO for SynovusAmerican Banker’s 2009 Community Banker of the Year William M. FosheeEVP and Chief Financial OfficerPreviously Chief Financial
Officer of Heritage Financial Holding CorporationCertified public accountant Rodney E. RushingEVP and Chief Operating OfficerPreviously Executive Vice President of Correspondent Banking, BBVA-Compass Henry F. AbbottSVP and Chief Credit
OfficerPreviously Senior Vice President and Chief Credit Officer of the Correspondent Banking Division, ServisFirst Bank 18
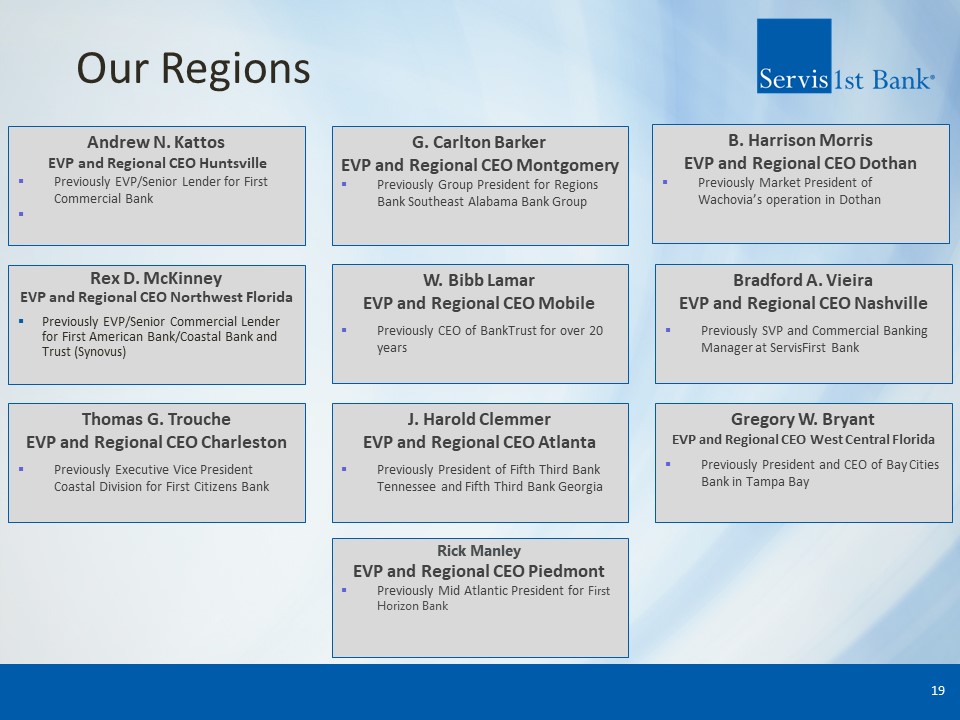
Our Regions Rex D. McKinneyEVP and Regional CEO Northwest FloridaPreviously EVP/Senior Commercial Lender
for First American Bank/Coastal Bank and Trust (Synovus) Andrew N. Kattos EVP and Regional CEO HuntsvillePreviously EVP/Senior Lender for First Commercial Bank J. Harold ClemmerEVP and Regional CEO AtlantaPreviously President of Fifth Third
Bank Tennessee and Fifth Third Bank Georgia W. Bibb LamarEVP and Regional CEO MobilePreviously CEO of BankTrust for over 20 years G. Carlton BarkerEVP and Regional CEO MontgomeryPreviously Group President for Regions Bank Southeast Alabama
Bank Group B. Harrison MorrisEVP and Regional CEO DothanPreviously Market President of Wachovia’s operation in Dothan Gregory W. BryantEVP and Regional CEO West Central FloridaPreviously President and CEO of Bay Cities Bank in Tampa Bay
Thomas G. TroucheEVP and Regional CEO CharlestonPreviously Executive Vice President Coastal Division for First Citizens Bank Bradford A. VieiraEVP and Regional CEO NashvillePreviously SVP and Commercial Banking Manager at ServisFirst
Bank 19 Rick ManleyEVP and Regional CEO PiedmontPreviously Mid Atlantic President for First Horizon Bank

Financial Results
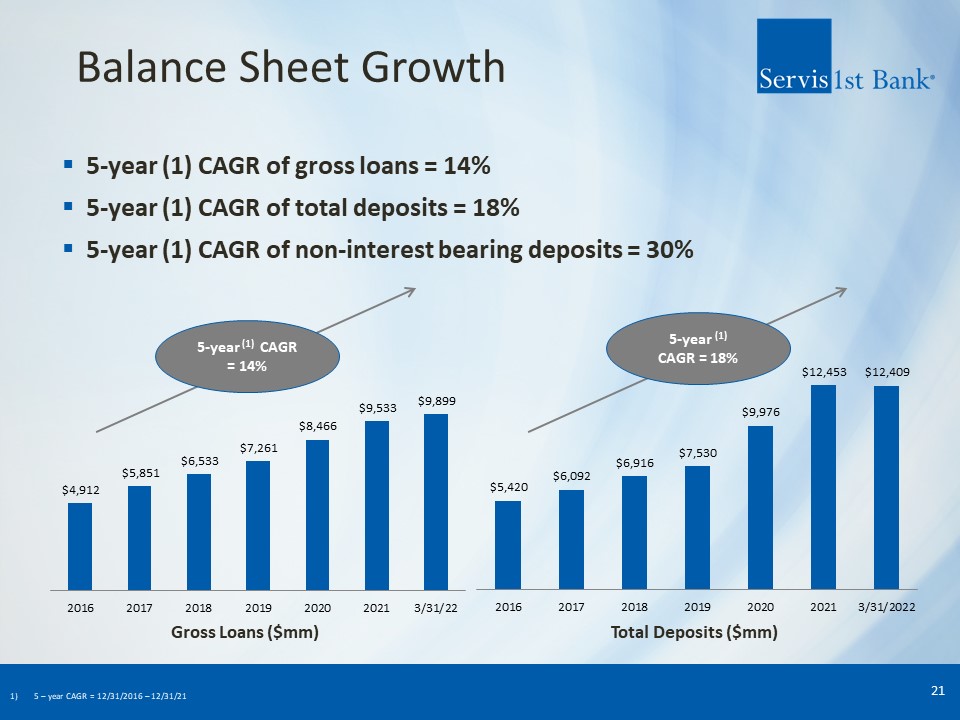
Balance Sheet Growth 5-year (1) CAGR of gross loans = 14%5-year (1) CAGR of total deposits = 18%5-year
(1) CAGR of non-interest bearing deposits = 30% 21 5-year (1) CAGR = 14% 5-year (1) CAGR = 18% Gross Loans ($mm) Total Deposits ($mm) 5 – year CAGR = 12/31/2016 – 12/31/21
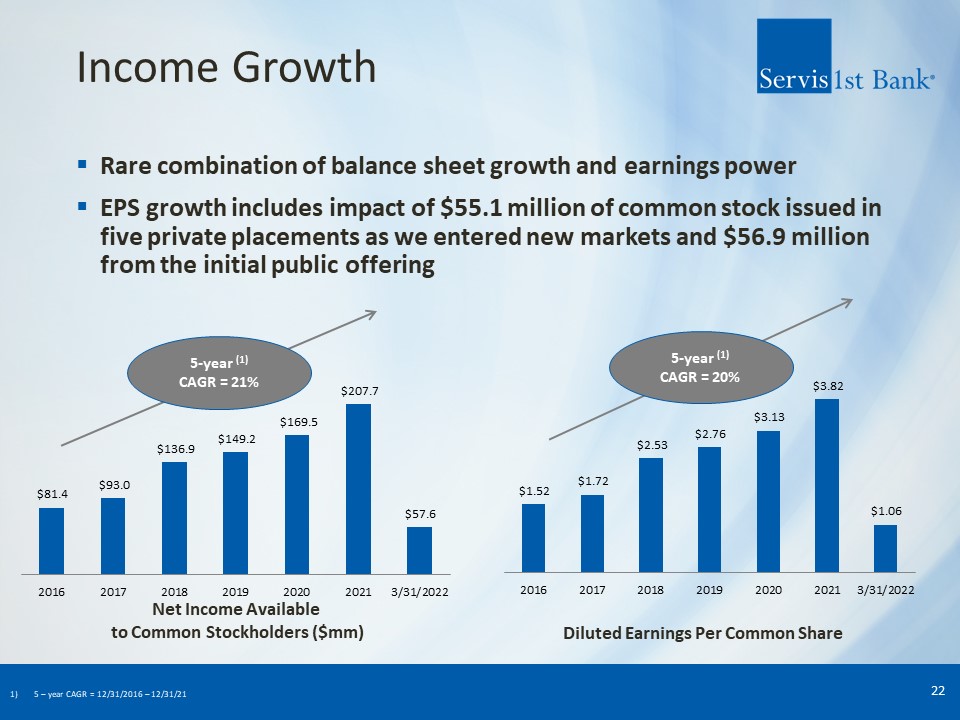
Income Growth Rare combination of balance sheet growth and earnings powerEPS growth includes impact of
$55.1 million of common stock issued in five private placements as we entered new markets and $56.9 million from the initial public offering 22 5-year (1) CAGR = 21% 5-year (1) CAGR = 20% Net Income Available to Common Stockholders
($mm) Diluted Earnings Per Common Share 5 – year CAGR = 12/31/2016 – 12/31/21
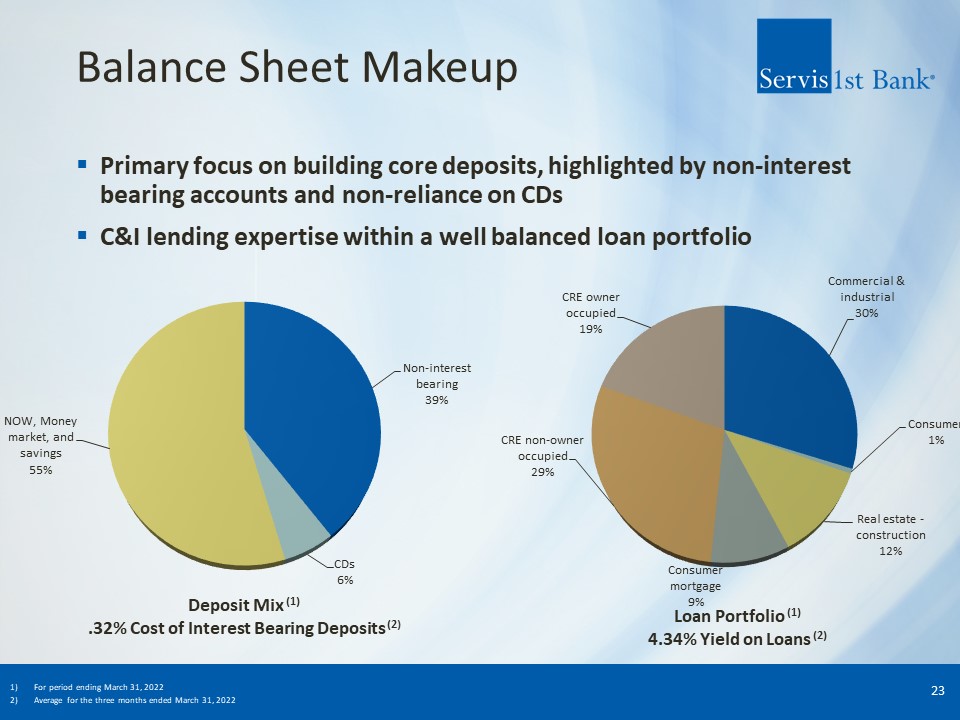
Balance Sheet Makeup Primary focus on building core deposits, highlighted by non-interest bearing
accounts and non-reliance on CDsC&I lending expertise within a well balanced loan portfolio 23 Deposit Mix (1).32% Cost of Interest Bearing Deposits (2) Loan Portfolio (1)4.34% Yield on Loans (2) For period ending March 31, 2022Average
for the three months ended March 31, 2022
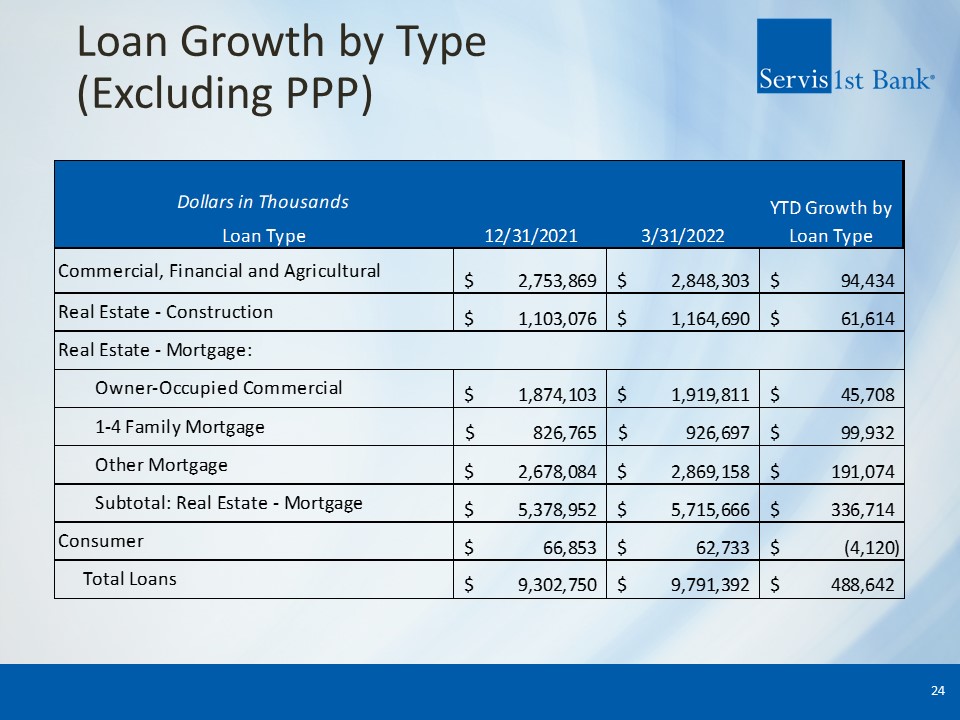
Loan Growth by Type (Excluding PPP) 24
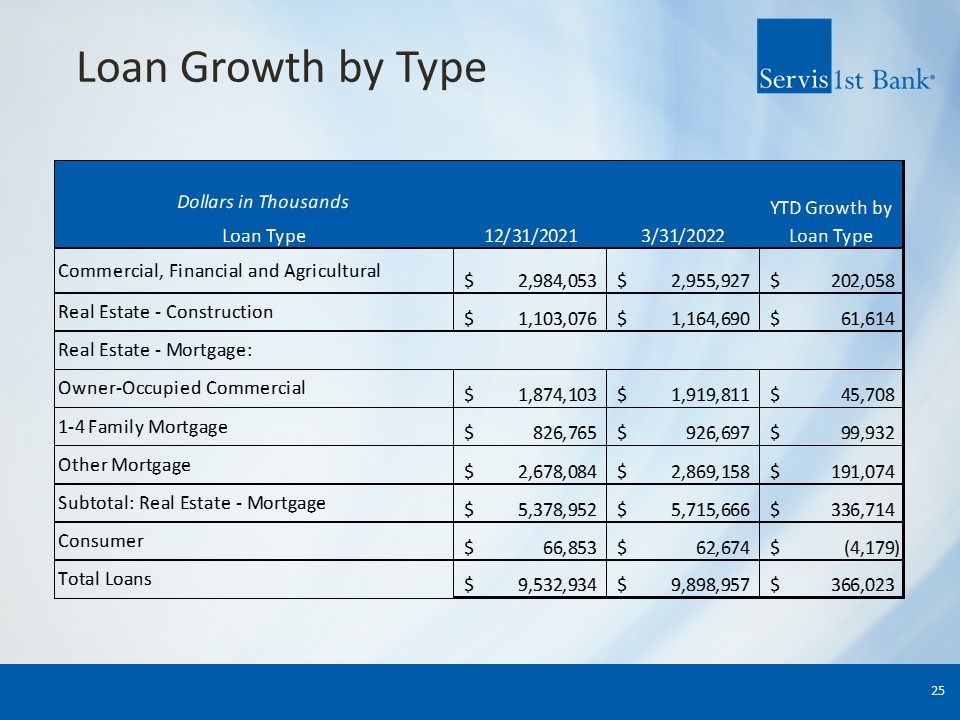
Loan Growth by Type 25
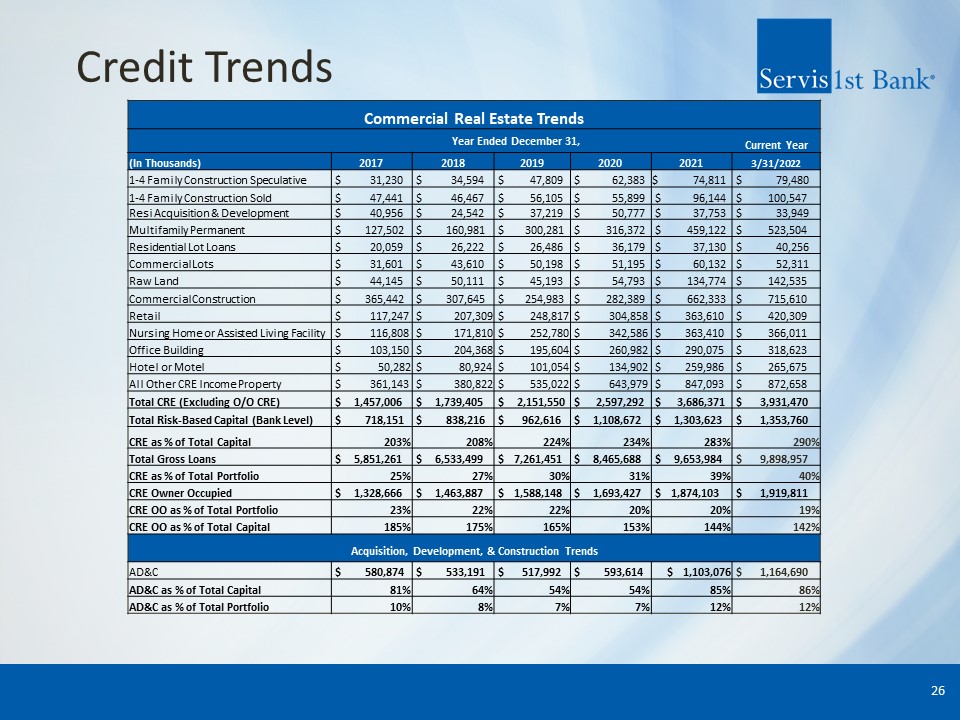
Credit Trends 26 Commercial Real Estate Trends Year Ended December 31, Current
Year (In Thousands) 2017 2018 2019 2020 2021 3/31/2022 1-4 Family Construction Speculative $ 31,230 $ 34,594 $ 47,809 $ 62,383 $ 74,811 $ 79,480 1-4 Family Construction Sold $ 47,441 $ 46,467 $ 56,105 $ 55,899
$ 96,144 $ 100,547 Resi Acquisition & Development $ 40,956 $ 24,542 $ 37,219 $ 50,777 $ 37,753 $ 33,949 Multifamily Permanent $ 127,502 $ 160,981 $ 300,281 $ 316,372 $ 459,122 $ 523,504 Residential Lot
Loans $ 20,059 $ 26,222 $ 26,486 $ 36,179 $ 37,130 $ 40,256 Commercial Lots $ 31,601 $ 43,610 $ 50,198 $ 51,195 $ 60,132 $ 52,311 Raw Land $ 44,145 $ 50,111 $ 45,193 $ 54,793 $ 134,774 $
142,535 Commercial Construction $ 365,442 $ 307,645 $ 254,983 $ 282,389 $ 662,333 $ 715,610 Retail $ 117,247 $ 207,309 $ 248,817 $ 304,858 $ 363,610 $ 420,309 Nursing Home or Assisted Living Facility $ 116,808 $
171,810 $ 252,780 $ 342,586 $ 363,410 $ 366,011 Office Building $ 103,150 $ 204,368 $ 195,604 $ 260,982 $ 290,075 $ 318,623 Hotel or Motel $ 50,282 $ 80,924 $ 101,054 $ 134,902 $ 259,986 $ 265,675 All Other
CRE Income Property $ 361,143 $ 380,822 $ 535,022 $ 643,979 $ 847,093 $ 872,658 Total CRE (Excluding O/O CRE) $ 1,457,006 $ 1,739,405 $ 2,151,550 $ 2,597,292 $ 3,686,371 $ 3,931,470 Total Risk-Based Capital (Bank
Level) $ 718,151 $ 838,216 $ 962,616 $ 1,108,672 $ 1,303,623 $ 1,353,760 CRE as % of Total Capital 203% 208% 224% 234% 283% 290% Total Gross Loans $ 5,851,261 $ 6,533,499 $ 7,261,451 $ 8,465,688 $
9,653,984 $ 9,898,957 CRE as % of Total Portfolio 25% 27% 30% 31% 39% 40% CRE Owner Occupied $ 1,328,666 $ 1,463,887 $ 1,588,148 $ 1,693,427 $ 1,874,103 $ 1,919,811 CRE OO as % of Total
Portfolio 23% 22% 22% 20% 20% 19% CRE OO as % of Total Capital 185% 175% 165% 153% 144% 142% Acquisition, Development, & Construction Trends AD&C $ 580,874 $ 533,191 $ 517,992 $ 593,614 $
1,103,076 $ 1,164,690 AD&C as % of Total Capital 81% 64% 54% 54% 85% 86% AD&C as % of Total Portfolio 10% 8% 7% 7% 12% 12%
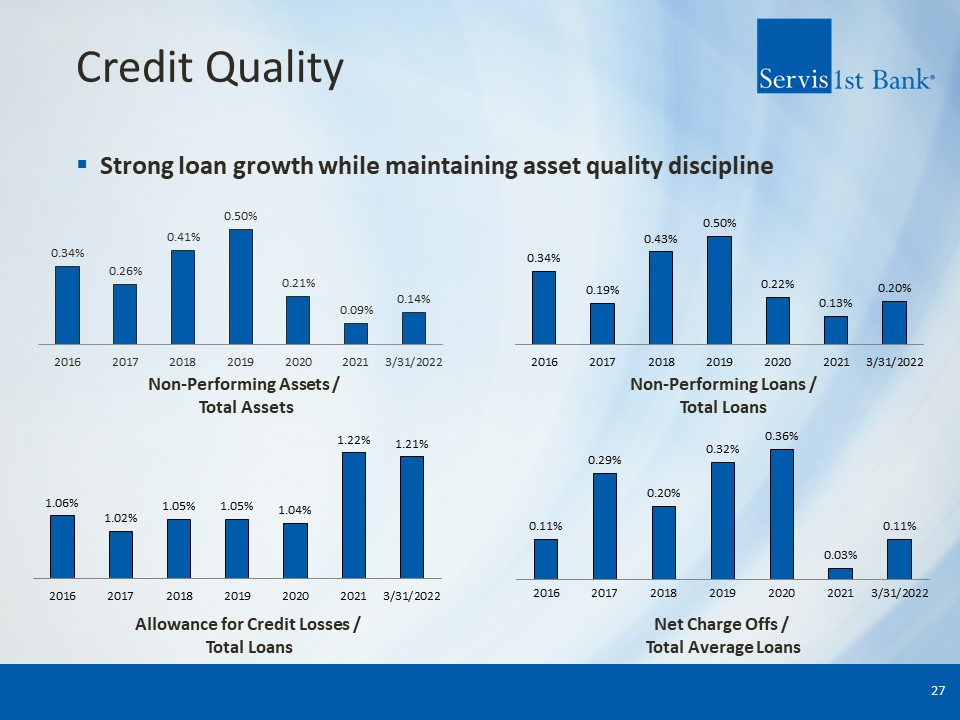
Credit Quality Strong loan growth while maintaining asset quality discipline 27 Allowance for Credit
Losses / Total Loans Net Charge Offs / Total Average Loans Non-Performing Assets / Total Assets Non-Performing Loans /Total Loans
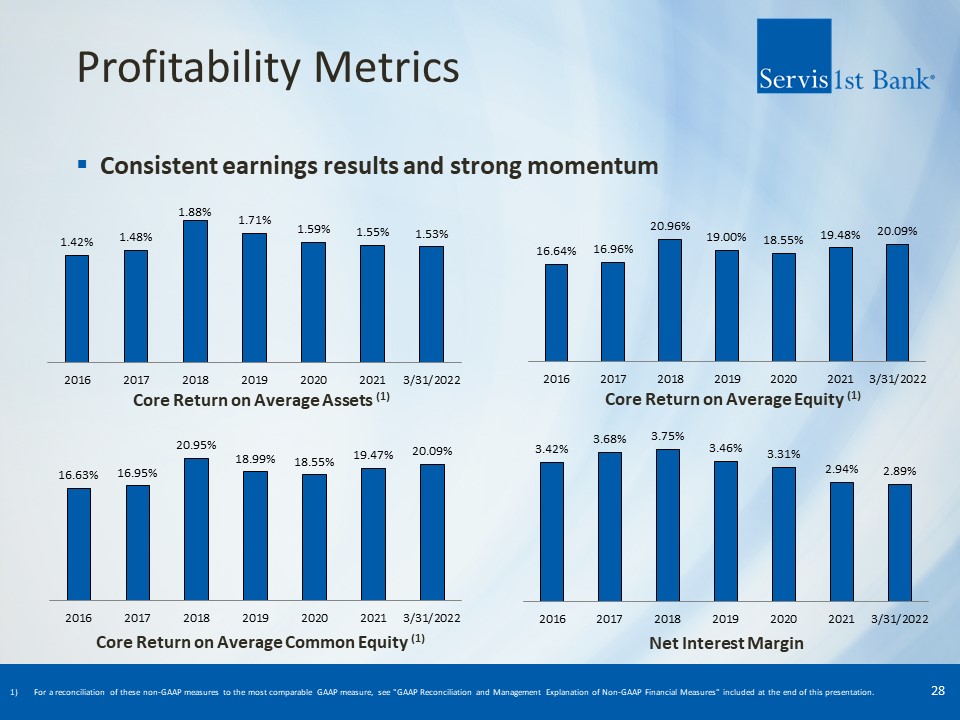
Profitability Metrics Consistent earnings results and strong momentum 28 Core Return on Average
Assets (1) Core Return on Average Equity (1) Core Return on Average Common Equity (1) Net Interest Margin For a reconciliation of these non-GAAP measures to the most comparable GAAP measure, see "GAAP Reconciliation and Management
Explanation of Non-GAAP Financial Measures" included at the end of this presentation.
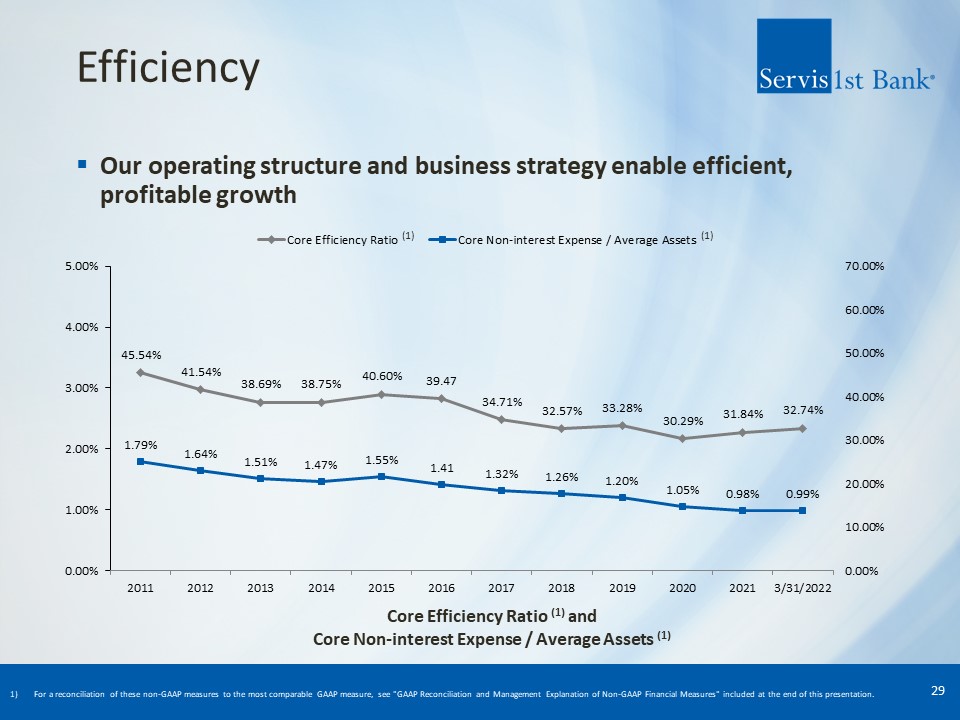
Efficiency Our operating structure and business strategy enable efficient, profitable growth 29 Core
Efficiency Ratio (1) andCore Non-interest Expense / Average Assets (1) (1) (1) For a reconciliation of these non-GAAP measures to the most comparable GAAP measure, see "GAAP Reconciliation and Management Explanation of Non-GAAP Financial
Measures" included at the end of this presentation.
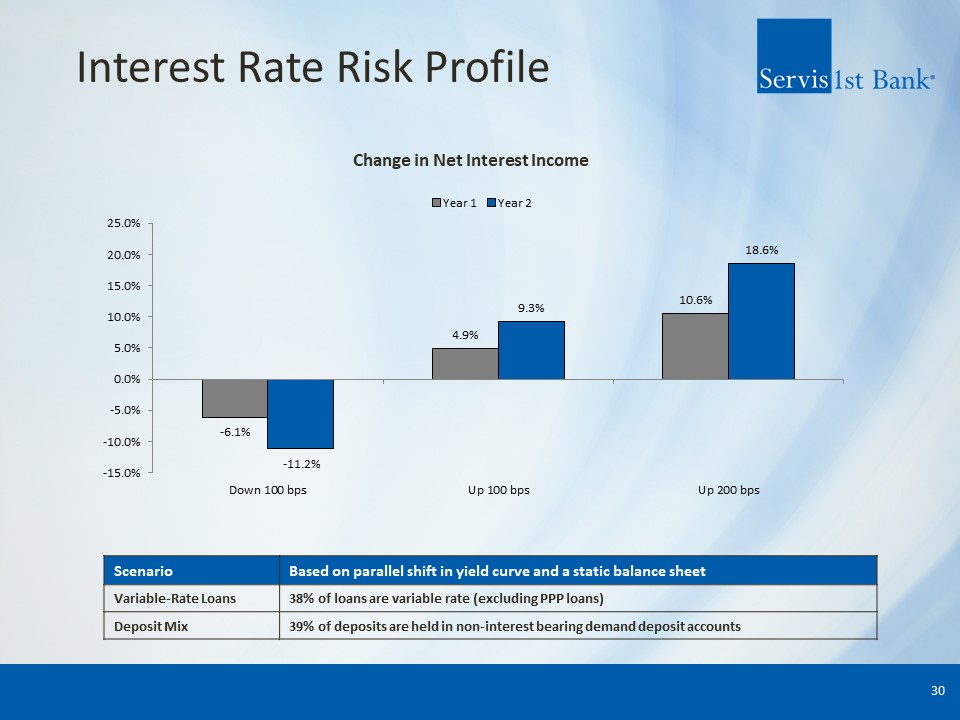
Interest Rate Risk Profile 30 Change in Net Interest Income Scenario Based on parallel shift in yield
curve and a static balance sheet Variable-Rate Loans 38% of loans are variable rate (excluding PPP loans) Deposit Mix 39% of deposits are held in non-interest bearing demand deposit accounts

Appendix
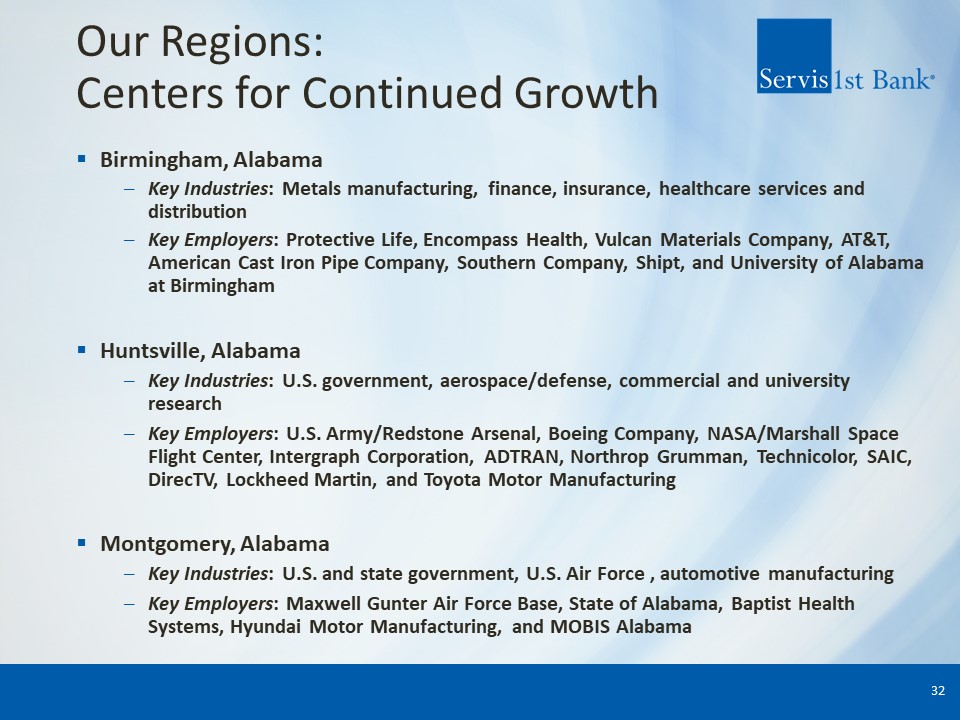
Our Regions: Centers for Continued Growth Birmingham, AlabamaKey Industries: Metals manufacturing,
finance, insurance, healthcare services and distribution Key Employers: Protective Life, Encompass Health, Vulcan Materials Company, AT&T, American Cast Iron Pipe Company, Southern Company, Shipt, and University of Alabama at
BirminghamHuntsville, AlabamaKey Industries: U.S. government, aerospace/defense, commercial and university researchKey Employers: U.S. Army/Redstone Arsenal, Boeing Company, NASA/Marshall Space Flight Center, Intergraph Corporation, ADTRAN,
Northrop Grumman, Technicolor, SAIC, DirecTV, Lockheed Martin, and Toyota Motor Manufacturing Montgomery, AlabamaKey Industries: U.S. and state government, U.S. Air Force , automotive manufacturingKey Employers: Maxwell Gunter Air Force Base,
State of Alabama, Baptist Health Systems, Hyundai Motor Manufacturing, and MOBIS Alabama 32
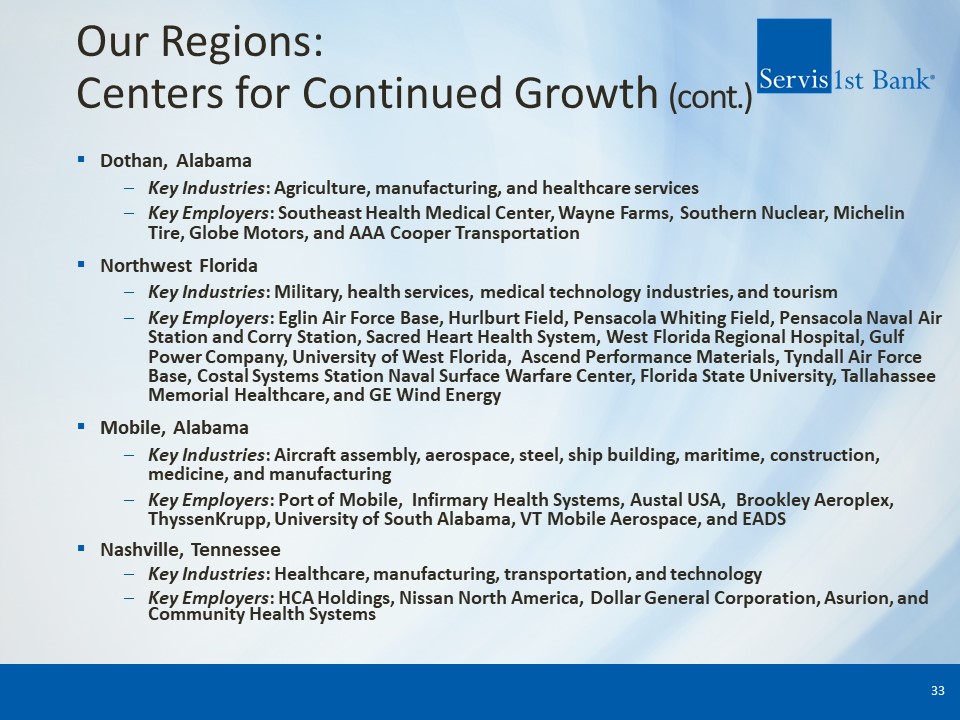
Our Regions: Centers for Continued Growth (cont.) Dothan, AlabamaKey Industries: Agriculture,
manufacturing, and healthcare servicesKey Employers: Southeast Health Medical Center, Wayne Farms, Southern Nuclear, Michelin Tire, Globe Motors, and AAA Cooper TransportationNorthwest FloridaKey Industries: Military, health services, medical
technology industries, and tourismKey Employers: Eglin Air Force Base, Hurlburt Field, Pensacola Whiting Field, Pensacola Naval Air Station and Corry Station, Sacred Heart Health System, West Florida Regional Hospital, Gulf Power Company,
University of West Florida, Ascend Performance Materials, Tyndall Air Force Base, Costal Systems Station Naval Surface Warfare Center, Florida State University, Tallahassee Memorial Healthcare, and GE Wind EnergyMobile, AlabamaKey Industries:
Aircraft assembly, aerospace, steel, ship building, maritime, construction, medicine, and manufacturingKey Employers: Port of Mobile, Infirmary Health Systems, Austal USA, Brookley Aeroplex, ThyssenKrupp, University of South Alabama, VT Mobile
Aerospace, and EADSNashville, TennesseeKey Industries: Healthcare, manufacturing, transportation, and technology Key Employers: HCA Holdings, Nissan North America, Dollar General Corporation, Asurion, and Community Health Systems 33
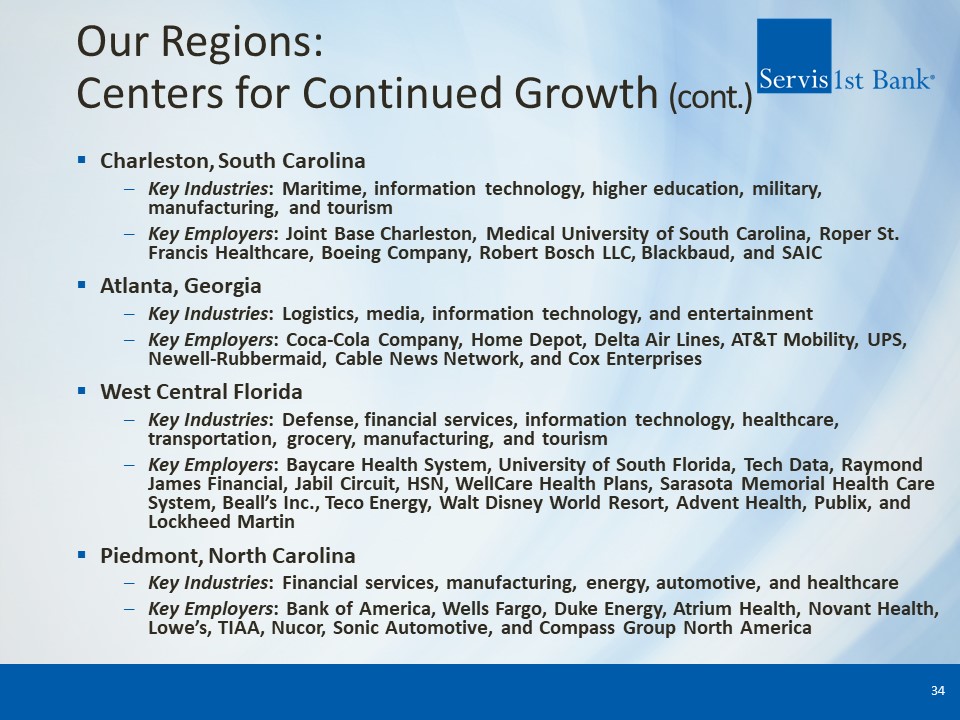
Our Regions: Centers for Continued Growth (cont.) Charleston, South CarolinaKey Industries: Maritime,
information technology, higher education, military, manufacturing, and tourismKey Employers: Joint Base Charleston, Medical University of South Carolina, Roper St. Francis Healthcare, Boeing Company, Robert Bosch LLC, Blackbaud, and SAIC
Atlanta, GeorgiaKey Industries: Logistics, media, information technology, and entertainmentKey Employers: Coca-Cola Company, Home Depot, Delta Air Lines, AT&T Mobility, UPS, Newell-Rubbermaid, Cable News Network, and Cox Enterprises West
Central FloridaKey Industries: Defense, financial services, information technology, healthcare, transportation, grocery, manufacturing, and tourismKey Employers: Baycare Health System, University of South Florida, Tech Data, Raymond James
Financial, Jabil Circuit, HSN, WellCare Health Plans, Sarasota Memorial Health Care System, Beall’s Inc., Teco Energy, Walt Disney World Resort, Advent Health, Publix, and Lockheed MartinPiedmont, North CarolinaKey Industries: Financial
services, manufacturing, energy, automotive, and healthcareKey Employers: Bank of America, Wells Fargo, Duke Energy, Atrium Health, Novant Health, Lowe’s, TIAA, Nucor, Sonic Automotive, and Compass Group North America 34
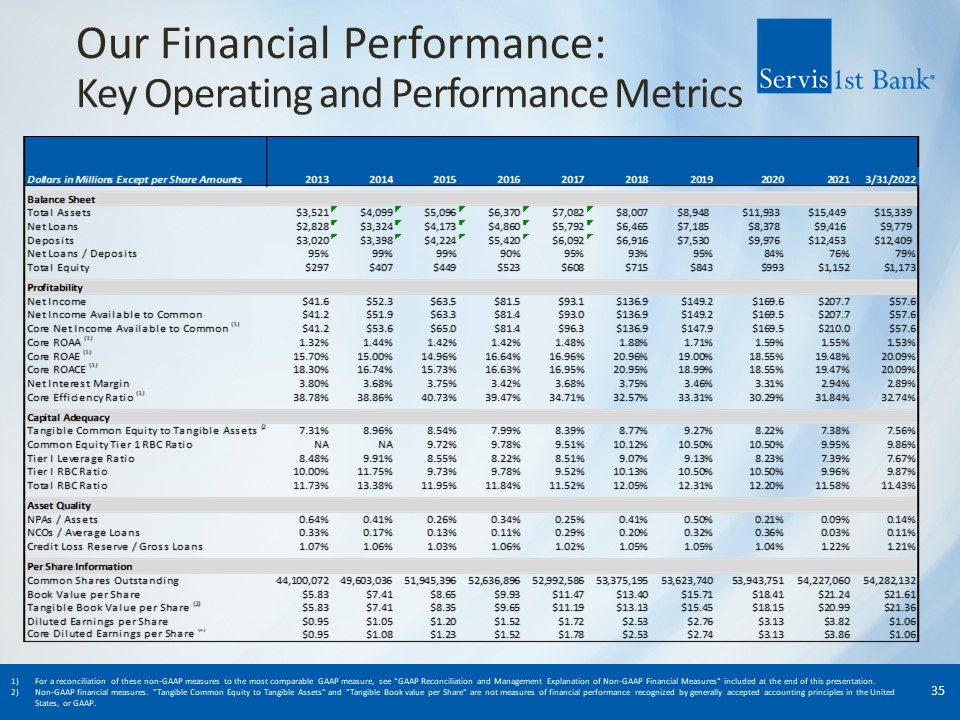
Our Financial Performance:Key Operating and Performance Metrics 35 For a reconciliation of these
non-GAAP measures to the most comparable GAAP measure, see "GAAP Reconciliation and Management Explanation of Non-GAAP Financial Measures" included at the end of this presentation. Non-GAAP financial measures. "Tangible Common Equity to
Tangible Assets" and "Tangible Book value per Share" are not measures of financial performance recognized by generally accepted accounting principles in the United States, or GAAP.
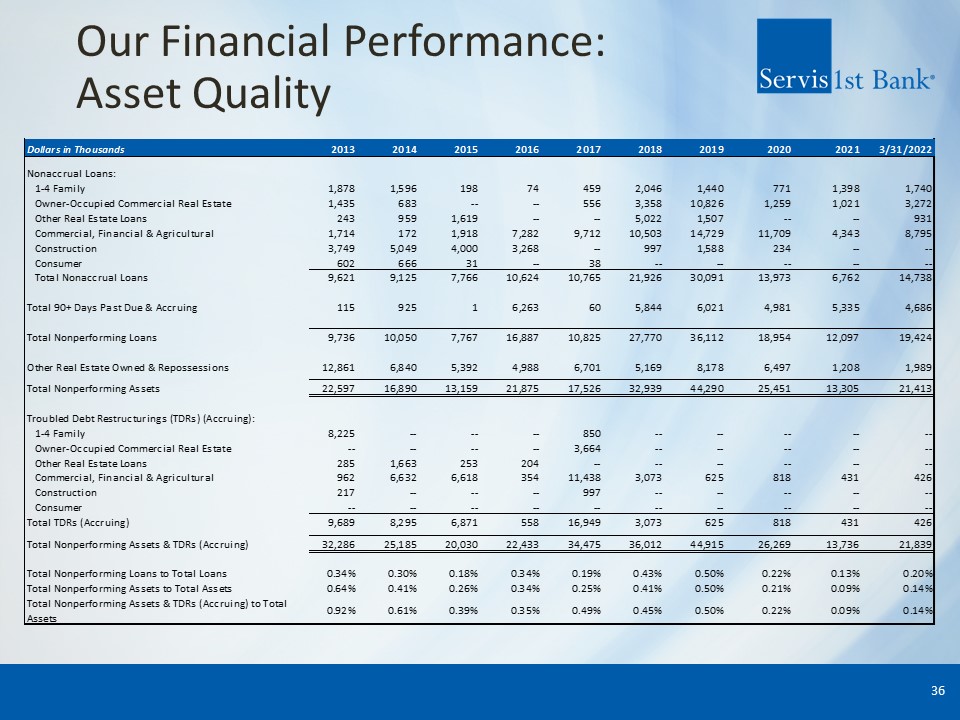
Our Financial Performance:Asset Quality 36
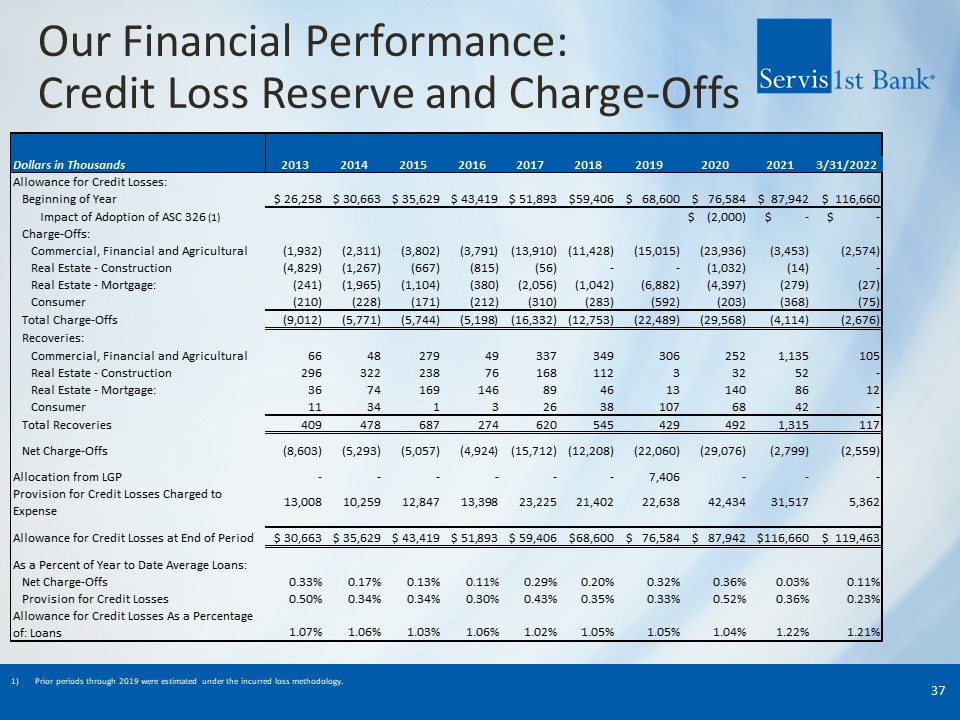
Our Financial Performance:Credit Loss Reserve and Charge-Offs 37 Prior periods through 2019 were
estimated under the incurred loss methodology.
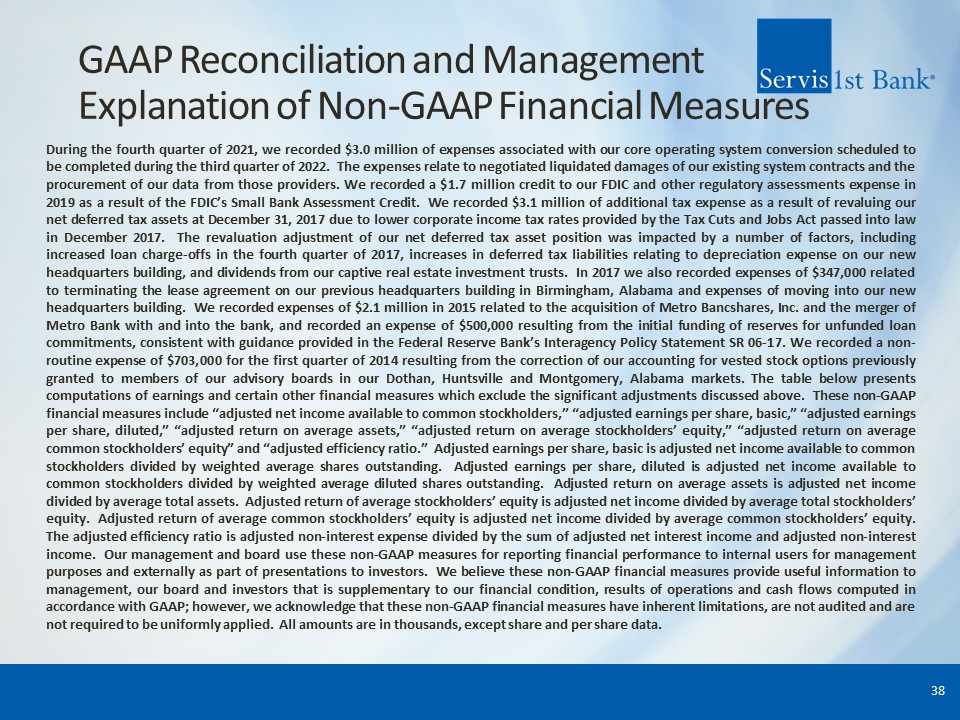
GAAP Reconciliation and Management Explanation of Non-GAAP Financial Measures During the fourth quarter
of 2021, we recorded $3.0 million of expenses associated with our core operating system conversion scheduled to be completed during the third quarter of 2022. The expenses relate to negotiated liquidated damages of our existing system contracts
and the procurement of our data from those providers. We recorded a $1.7 million credit to our FDIC and other regulatory assessments expense in 2019 as a result of the FDIC’s Small Bank Assessment Credit. We recorded $3.1 million of additional
tax expense as a result of revaluing our net deferred tax assets at December 31, 2017 due to lower corporate income tax rates provided by the Tax Cuts and Jobs Act passed into law in December 2017. The revaluation adjustment of our net deferred
tax asset position was impacted by a number of factors, including increased loan charge-offs in the fourth quarter of 2017, increases in deferred tax liabilities relating to depreciation expense on our new headquarters building, and dividends
from our captive real estate investment trusts. In 2017 we also recorded expenses of $347,000 related to terminating the lease agreement on our previous headquarters building in Birmingham, Alabama and expenses of moving into our new
headquarters building. We recorded expenses of $2.1 million in 2015 related to the acquisition of Metro Bancshares, Inc. and the merger of Metro Bank with and into the bank, and recorded an expense of $500,000 resulting from the initial funding
of reserves for unfunded loan commitments, consistent with guidance provided in the Federal Reserve Bank’s Interagency Policy Statement SR 06-17. We recorded a non-routine expense of $703,000 for the first quarter of 2014 resulting from the
correction of our accounting for vested stock options previously granted to members of our advisory boards in our Dothan, Huntsville and Montgomery, Alabama markets. The table below presents computations of earnings and certain other financial
measures which exclude the significant adjustments discussed above. These non-GAAP financial measures include “adjusted net income available to common stockholders,” “adjusted earnings per share, basic,” “adjusted earnings per share, diluted,”
“adjusted return on average assets,” “adjusted return on average stockholders’ equity,” “adjusted return on average common stockholders’ equity” and “adjusted efficiency ratio.” Adjusted earnings per share, basic is adjusted net income
available to common stockholders divided by weighted average shares outstanding. Adjusted earnings per share, diluted is adjusted net income available to common stockholders divided by weighted average diluted shares outstanding. Adjusted
return on average assets is adjusted net income divided by average total assets. Adjusted return of average stockholders’ equity is adjusted net income divided by average total stockholders’ equity. Adjusted return of average common
stockholders’ equity is adjusted net income divided by average common stockholders’ equity. The adjusted efficiency ratio is adjusted non-interest expense divided by the sum of adjusted net interest income and adjusted non-interest income. Our
management and board use these non-GAAP measures for reporting financial performance to internal users for management purposes and externally as part of presentations to investors. We believe these non-GAAP financial measures provide useful
information to management, our board and investors that is supplementary to our financial condition, results of operations and cash flows computed in accordance with GAAP; however, we acknowledge that these non-GAAP financial measures have
inherent limitations, are not audited and are not required to be uniformly applied. All amounts are in thousands, except share and per share data. 38
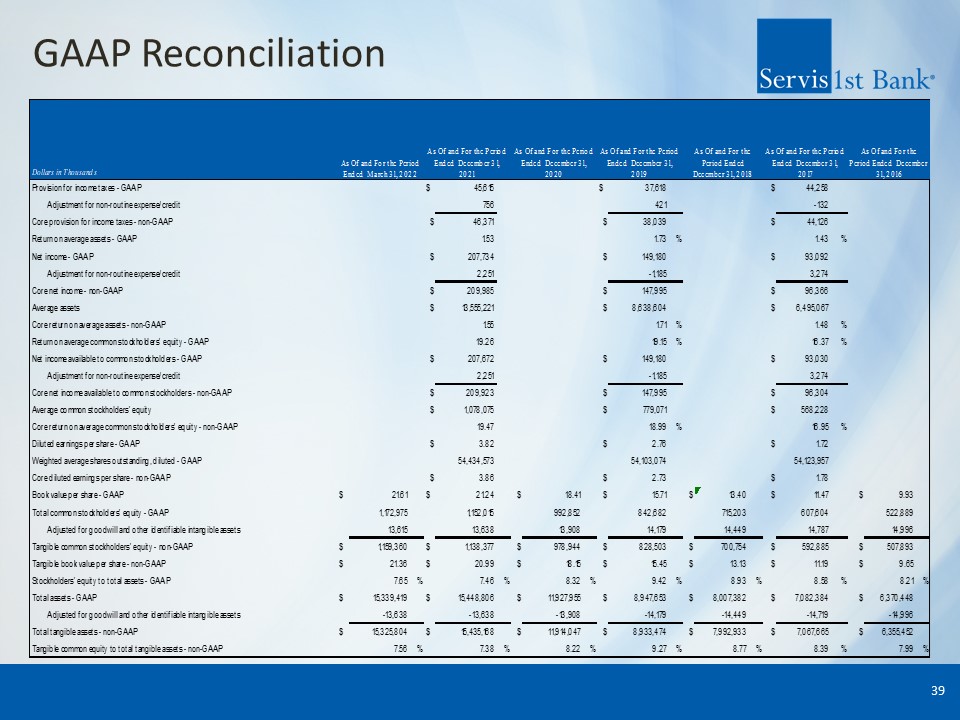
GAAP Reconciliation 39