
| x | ANNUAL REPORT PURSUANT TO SECTION 13 OR 15(d) OF THE SECURITIES EXCHANGE ACT OF 1934 |
| ¨ | TRANSITION REPORT PURSUANT TO SECTION 13 OR 15(d) OF THE SECURITIES EXCHANGE ACT OF 1934 |
|
Delaware
|
26-0734029
|
|
(State or Other Jurisdiction of
|
(I.R.S. Employer
|
|
Incorporation or Organization)
|
Identification No.)
|
|
850 Shades Creek Parkway, Birmingham, Alabama
|
35209
|
|
(Address of Principal Executive Offices)
|
(Zip Code)
|
|
Large accelerated filer ¨ Accelerated filer x Non-accelerated filer ¨ Smaller reporting company ¨
|
|
Class
|
|
Outstanding as of February 28, 2014
|
|
Common stock, $.001 par value
|
|
7,420,812
|
| · | “Book value,” changing the amount from 26.34 to 26.35 for 2011 |
| · | “Actual shares outstanding,” changing the amount from 7,346,512 to 7,350,012 for 2013 |
| · | “Return on average stockholders’ equity,” changing the amount from 15.55 to 15.54 for 2013 |
| · | “Efficiency ratio,” changing the amount from 59.57 to 59.93 for 2009 |
| · | “Allowance for loan losses to total gross loans,” changing the amount from 1.24 to 1.22 for 2009 |
| · | “Allowance for loan losses to total non-performing loans,” changing the amount from 122.34 to 120.91 for 2009 |
| · | “Net average loans to average earning assets,” changing the amount from 84.65 to 84.80 for 2013, and from 79.82 to 79.89 for 2012 |
| · | “Noninterest-bearing deposits to total deposits,” changing the amount from 16.96 to 19.54 for 2011 |
| · | “Stockholders’ equity to total assets,” changing the amount from 7.97 to 7.98 for 2011 |
| · | “Percentage change in net income,” changing the amount from (16.10) to (16.09) for 2009 |
| 2 | ||
|
CAUTIONARY NOTE REGARDING FORWARD-LOOKING STATEMENTS
|
3
|
|
|
|
|
|
|
PART I.
|
|
4
|
|
|
|
|
|
ITEM 1.
|
BUSINESS
|
4
|
|
ITEM 1A.
|
RISK FACTORS
|
25
|
|
ITEM 1B.
|
UNRESOLVED STAFF COMMENTS
|
38
|
|
ITEM 2.
|
PROPERTIES
|
38
|
|
ITEM 3.
|
LEGAL PROCEEDINGS
|
39
|
|
ITEM 4.
|
MINE SAFETY DISCLOSURES
|
40
|
|
|
|
|
|
PART II.
|
|
40
|
|
|
|
|
|
ITEM 5
|
MARKET FOR REGISTRANT’S COMMON EQUITY, RELATED STOCKHOLDER MATTERS AND ISSUER PURCHASES OF EQUITY SECURITIES
|
40
|
|
ITEM 6.
|
SELECTED FINANCIAL DATA
|
42
|
|
ITEM 7.
|
MANAGEMENT’S DISCUSSION AND ANALYSIS OF FINANCIAL CONDITION AND RESULTS OF OPERATIONS
|
44
|
|
ITEM 7A.
|
QUANTITATIVE AND QUALITATIVE DISCLOSURES ABOUT MARKET RISK
|
62
|
|
ITEM 8.
|
FINANCIAL STATEMENTS AND SUPPLEMENTARY DATA
|
65
|
|
ITEM 9.
|
CHANGES IN AND DISAGREEMENTS WITH ACCOUNTANTS ON ACCOUNTING AND FINANCIAL DISCLOSURES
|
107
|
|
ITEM 9A.
|
CONTROLS AND PROCEDURES
|
107
|
|
ITEM 9B.
|
OTHER INFORMATION
|
108
|
|
|
|
|
|
PART III.
|
|
108
|
|
|
|
|
|
ITEM 10.
|
DIRECTORS, EXECUTIVE OFFICERS AND CORPORATE GOVERNANCE
|
108
|
|
ITEM 11.
|
EXECUTIVE COMPENSATION
|
108
|
|
ITEM 12.
|
SECURITY OWNERSHIP OF CERTAIN BENEFICIAL OWNERS AND MANAGEMENT AND RELATED STOCKHOLDER MATTERS
|
108
|
|
ITEM 13.
|
CERTAIN RELATIONSHIPS AND RELATED TRANSACTIONS, AND DIRECTOR INDEPENDENCE
|
108
|
|
ITEM 14.
|
PRINCIPAL ACCOUNTANT FEES AND SERVICES
|
108
|
|
|
|
|
|
PART IV.
|
|
109
|
|
|
|
|
|
ITEM 15.
|
EXHIBITS AND FINANCIAL STATEMENT SCHEDULES
|
109
|
|
|
|
|
|
SIGNATURES
|
111
|
|
|
|
|
|
|
EXHIBIT INDEX
|
112
|
|
| 3 | ||
| · | the effects of the continued slow economic recovery and high unemployment; |
| · | the effects of continued deleveraging of United States citizens and businesses; |
| · | the effects of potential federal spending cuts due to the United States financial budgetary “sequester”; |
| · | the effects of continued depression of residential housing values and the slow market for sales and resales; |
| · | credit risks, including credit risks resulting from the devaluation of collateralized debt obligations (CDOs) and/or structured investment vehicles to which we currently have no direct exposure; |
| · | the effects of governmental monetary and fiscal policies and legislative and regulatory changes; |
| · | the effects of hazardous weather such as the tornados that struck the state of Alabama in April 2011 and January 2012; |
| · | the effects of competition from other commercial banks, thrifts, mortgage banking firms, consumer finance companies, credit unions, securities brokerage firms, insurance companies, money market and other mutual funds and other financial institutions operating in our market area and elsewhere, including institutions operating regionally, nationally and internationally, together with competitors offering banking products and services by mail, telephone and the internet; |
| · | the effect of any merger, acquisition or other transaction to which we or any of our subsidiaries may from time to time be a party, including our ability to successfully integrate any business that we acquire; |
| · | deterioration in the financial condition of borrowers resulting in significant increases in loan losses and provisions for those losses; |
| · | the effect of changes in interest rates on the level and composition of deposits, loan demand and the values of loan collateral, securities and interest sensitive assets and liabilities; |
| · | the effects of terrorism and efforts to combat it; |
| · | the results of regulatory examinations; |
| · | changes in state and federal legislation, regulations or policies applicable to banks and other financial service providers, including regulatory or legislative developments arising out of current unsettled conditions in the economy, including implementation of the Dodd-Frank Wall Street Reform and Consumer Protection Act (the “Dodd-Frank Act”); |
| · | the effect of inaccuracies in our assumptions underlying the establishment of our loan loss reserves; and |
| · | other factors that are discussed in the section titled “Risk Factors” in Item 1A. |
| 4 | ||
| 5 | ||
| 6 | ||
| · | the availability of successful, experienced bankers with strong reputations in the market; and |
| · | the economic attributes of the market necessary to drive quality lending opportunities coupled with deposit-related attributes of the potential market. |
|
|
|
|
|
|
|
|
|
Compound
|
|
|
|
|
|
|
|
|
|
|
Annual
|
|
|
|
|
2013
|
|
2003
|
|
Growth Rate
|
|
||
|
|
|
(Dollars in Billions)
|
|
||||||
|
Jefferson/Shelby County, Alabama
|
|
$
|
24.8
|
|
$
|
16.3
|
|
4.29
|
%
|
|
Madison County, Alabama
|
|
|
6.1
|
|
|
3.7
|
|
5.13
|
%
|
|
Montgomery County, Alabama
|
|
|
6.5
|
|
|
3.6
|
|
6.09
|
%
|
|
Houston County, Alabama
|
|
|
2.2
|
|
|
1.3
|
|
5.40
|
%
|
|
Mobile County, Alabama
|
|
|
6.0
|
|
|
4.7
|
|
2.47
|
%
|
|
Escambia County, Florida
|
|
|
3.5
|
|
|
3.1
|
|
1.22
|
%
|
| 7 | ||
|
|
|
|
|
|
|
|
|
|
|
Market
|
|
||
|
|
|
Number of
|
|
Our Market
|
|
Total Market
|
|
|
|
Share
|
|
||
|
Market
|
|
Branches
|
|
Deposits
|
|
Deposits
|
|
Ranking
|
|
Percentage
|
|
||
|
|
|
(Dollars in Millions)
|
|
||||||||||
|
Alabama:
|
|
|
|
|
|
|
|
|
|
|
|
|
|
|
Birmingham-Hoover MSA
|
|
3
|
|
$
|
1,217.3
|
|
$
|
30,175.1
|
|
5
|
|
4.03
|
%
|
|
Huntsville MSA
|
|
2
|
|
|
540.8
|
|
|
6,805.7
|
|
5
|
|
7.95
|
%
|
|
Montgomery MSA
|
|
2
|
|
|
374.2
|
|
|
7,810.1
|
|
7
|
|
4.79
|
%
|
|
Dothan MSA
|
|
2
|
|
|
327.1
|
|
|
2,883.9
|
|
3
|
|
11.34
|
%
|
|
Mobile MSA
|
|
1
|
|
|
15.2
|
|
|
6,041.6
|
|
18
|
|
0.25
|
%
|
|
Florida:
|
|
|
|
|
|
|
|
|
|
|
|
|
|
|
Pensacola-Ferry Pass-Brent MSA
|
|
2
|
|
|
202.9
|
|
|
4,638.0
|
|
8
|
|
4.38
|
%
|
| 8 | ||
| 9 | ||
| 10 | ||
| · | the asset quality of individual loans; |
| · | changes in the national and local economy and business conditions/development, including underwriting standards, collections, and charge-off and recovery practices; |
| · | changes in the nature and volume of the loan portfolio; |
| · | changes in the experience, ability and depth of our lending staff and management; |
| · | changes in the trend of the volume and severity of past-due loans and classified loans, and trends in the volume of non-accrual loans, troubled debt restructurings and other modifications, as has occurred in the residential mortgage markets and particularly for residential construction and development loans; |
| · | possible deterioration in collateral segments or other portfolio concentrations; |
| · | historical loss experience (when available) used for pools of loans (i.e. collateral types, borrowers, purposes, etc.); |
| · | changes in the quality of our loan review system and the degree of oversight by our board of directors; and |
| · | the effect of external factors such as competition and the legal and regulatory requirement on the level of estimated credit losses in our current loan portfolio. |
| 11 | ||
| 12 | ||
| · | acquiring direct or indirect ownership or control of any voting shares of any bank if, after the acquisition, the bank holding company will, directly or indirectly, own or control more than 5% of the bank’s voting shares; |
| · | acquiring all or substantially all of the assets of any bank; or |
| · | merging or consolidating with any other bank holding company. |
| 13 | ||
| · | banking or managing or controlling banks; and |
| · | any activity that the Federal Reserve determines to be so closely related to banking as to be a proper incident to the business of banking. |
| · | factoring accounts receivable; |
| · | making, acquiring, brokering or servicing loans and usual related activities; |
| · | leasing personal or real property; |
| · | operating a non-bank depository institution, such as a savings association; |
| · | trust company functions; |
| · | financial and investment advisory activities; |
| · | discount securities brokerage activities; |
| · | underwriting and dealing in government obligations and money market instruments; |
| · | providing specified management consulting and counseling activities; |
| · | performing selected data processing services and support services; |
| · | acting as an agent or broker in selling credit life insurance and other types of insurance in connection with credit transactions; and |
| · | performing selected insurance underwriting activities. |
| · | lending, trust and other banking activities; |
| · | insuring, guaranteeing, or indemnifying against loss or harm, or providing and issuing annuities, and acting as principal, agent, or broker for these purposes, in any state; |
| · | providing financial, investment, or advisory services; |
| · | issuing or selling instruments representing interests in pools of assets permissible for a bank to hold directly; |
| 14 | ||
| · | underwriting, dealing in or making a market in securities; |
| · | other activities that the Federal Reserve may determine to be so closely related to banking or managing or controlling banks as to be a proper incident to managing or controlling banks; |
| · | foreign activities permitted outside of the United States if the Federal Reserve has determined them to be usual in connection with banking operations abroad; |
| · | merchant banking through securities or insurance affiliates; and |
| · | insurance company portfolio investments. |
| 15 | ||
| · | Assessment Base. An institution’s assessment base equals the institution’s average consolidated total assets during a particular assessment period, minus the institution’s average tangible equity capital (i.e., Tier 1 capital) during such period. |
| · | Assessment Rate. An institution’s assessment rate is assigned by the FDIC on a quarterly basis. To assign an assessment rate, the FDIC designates an institution as falling into one of four risk categories, or as being a large and highly complex financial institution. The FDIC determines an institution’s risk category based on the level of the institution’s capitalization and on supervisory evaluations provided to the FDIC by the institution’s primary federal regulator. Each risk category designation contains upward and downward adjustment factors based on long-term unsecured debt and brokered deposits. Assessment rates currently range from 0.025% per annum for an institution in the lowest risk category with the maximum downward adjustment, to 0.45% per annum for an institution in the highest risk category with the maximum upward adjustment. For the fourth quarter of 2013, the Bank’s assessment rate was set at $0.0133, or $0.0532 annually, per $100 of assessment base. |
| 16 | ||
| · | the Federal Truth-In-Lending Act, governing disclosures of credit terms to consumer borrowers; |
| · | the Home Mortgage Disclosure Act, requiring financial institutions to provide information to enable the public and public officials to determine whether a financial institution is fulfilling its obligation to help meet the housing needs of the community it serves; |
| · | the Equal Credit Opportunity Act, prohibiting discrimination on the basis of race, color, religion, national origin, sex, marital status or certain other prohibited factors in all aspects of credit transactions; |
| · | the Fair Credit Reporting Act, governing the use and provision of information to credit reporting agencies; |
| · | the Fair Debt Collection Act, governing the manner in which consumer debts may be collected by debt collectors; |
| · | the Servicemembers’ Civil Relief Act, governing the repayment terms of, and property rights underlying, secured obligations of persons in military service; |
| · | Rules and regulations of the various federal agencies charged with the responsibility of implementing these federal laws. |
| · | the Right to Financial Privacy Act, which imposes a duty to maintain confidentiality of consumer financial records and prescribes procedures for complying with administrative subpoenas of financial records; and |
| · | the Electronic Funds Transfer Act and Regulation E issued by the Consumer Financial Protection Bureau to implement that act, which govern automatic deposits to and withdrawals from deposit accounts and customers’ rights and liabilities arising from the use of automated teller machines and other electronic banking services. |
| 17 | ||
| 18 | ||
| · | A new common equity tier 1 capital to risk-weighted assets ratio of at least 7.0%, inclusive of a 4.5% minimum common equity tier 1 capital ratio, net of regulatory deductions, and a new 2.5% “capital conservation buffer” of common equity to risk-weighted assets; | |
| · | A tier 1 capital ratio of at least 8.5%, inclusive of the 2.5% capital conservation buffer; and | |
| · | A total capital ratio of at least 10.5%, inclusive of the 2.5% capital conservation buffer. |
| · | 4.5% based upon CET1; |
| · | 6.0% based upon tier 1 capital; and |
| · | 8.0% based upon total regulatory capital. |
| 19 | ||
| 20 | ||
| · | a bank’s loans or extensions of credit to affiliates; |
| · | a bank’s investment in affiliates; |
| · | assets a bank may purchase from affiliates, except for real and personal property exempted by the Federal Reserve; |
| · | loans or extensions of credit made by a bank to third parties collateralized by the securities or obligations of affiliates; |
| · | a bank’s guarantee, acceptance or letter of credit issued on behalf of an affiliate; |
| · | a bank’s transactions with an affiliate involving the borrowing or lending of securities to the extent they create credit exposure to the affiliate; and |
| · | a bank’s derivative transactions with an affiliate to the extent they create credit exposure to the affiliate. |
| 21 | ||
| · | requirements for financial institutions to develop policies and procedures to identify potential identity theft and, upon the request of a consumer, place a fraud alert in the consumer’s credit file stating that the consumer may be the victim of identity theft or other fraud; |
| · | requirements for entities that furnish information to consumer reporting agencies (which would include our bank) to implement procedures and policies regarding the accuracy and integrity of the furnished information and regarding the correction of previously furnished information that is later determined to be inaccurate; |
| · | requirements for mortgage lenders to disclose credit scores to consumers; and |
| · | limitations on the ability of a business that receives consumer information from an affiliate to use that information for marketing purposes. |
| 22 | ||
| 23 | ||
| · | The Dodd-Frank Act created a new Consumer Financial Protection Bureau with broad powers to supervise and enforce consumer protection laws. The Bureau now has broad rule-making authority for a wide range of consumer protection laws that apply to all banks, including the authority to prohibit “unfair, deceptive or abusive” acts and practices. The Bureau has examination and enforcement authority over all banks with more than $10 billion in assets. Institutions with less than $10 billion in assets will continue to be examined for compliance with consumer laws by their primary bank regulator. |
| · | The Dodd-Frank Act imposed new requirements regarding the origination and servicing of residential mortgage loans. The law created a variety of new consumer protections, including limitations on the manner by which loan originators may be compensated and an obligation on the part of lenders to verify a borrower’s “ability to repay” a residential mortgage loan. Final rules implementing these latter statutory requirements are effective in 2014. |
| · | The Dodd-Frank Act eliminated the federal prohibitions on paying interest on demand deposits effective one year after the date of its enactment, thus allowing businesses to have interest-bearing checking accounts. Depending on competitive responses, this significant change to existing law could have an adverse impact on our interest expense. |
| · | The Dodd-Frank Act addresses many aspects of investor protection, corporate governance and executive compensation that will affect most U.S. publicly traded companies. The Dodd-Frank Act (i) requires publicly traded companies to give stockholders a non-binding vote on executive compensation and golden parachute payments; (ii) enhances independence requirements for compensation committee members; (iii) requires companies listed on national securities exchanges to adopt incentive-based compensation claw-back policies for executive officers; (iv) authorizes the Securities and Exchange Commission (the “SEC”) to promulgate rules that would allow stockholders to nominate their own candidates using a company’s proxy materials; and (v) directs the federal banking regulators to issue rules prohibiting incentive compensation that encourages inappropriate risks. |
| · | While insured depository institutions have long been subject to the FDIC’s resolution process, the Dodd-Frank Act creates a new mechanism for the FDIC to conduct the orderly liquidation of certain “covered financial companies,” including bank holding companies and systemically significant non-bank financial companies. Upon certain findings being made, the FDIC may be appointed receiver for a covered financial company, and would conduct an orderly liquidation of the entity. The FDIC liquidation process is modeled on the existing Federal Deposit Insurance Act bank resolution process, and generally gives the FDIC more discretion than in the traditional bankruptcy context. The FDIC has issued final rules implementing the orderly liquidation authority. |
| 24 | ||
| 25 | ||
| 26 | ||
| 27 | ||
| 28 | ||
| · | maintaining loan quality; |
| · | maintaining adequate management personnel and information systems to oversee such growth; |
| · | maintaining adequate control and compliance functions; and |
| · | securing capital and liquidity needed to support anticipated growth. |
| · | the sale of 40,000 shares of our senior non-cumulative perpetual preferred stock, Series A, par value $.001 per share (or “Series A Preferred Stock”) to the United States Department of the Treasury (“Treasury”) in connection with the Treasury’s Small Business Lending Fund program for gross proceeds of $40,000,000 on June 21, 2011; |
| · | the sale of an aggregate of 340,000 shares of our common stock at $30 per share, or $10,200,000, in a private placement completed on June 30, 2011; |
| · | the sale of $20,000,000 in 5.5% subordinated notes due November 9, 2022 to accredited investor purchasers, the proceeds of which were used to pay off $15,000,000 in our 8.5% subordinated debentures; and |
| · | the sale of an aggregate of 250,000 shares of our common stock at $41.50 per share, or $10,375,000, in a private placement completed on December 2, 2013. |
| 29 | ||
| · | our ability to build and maintain long-term customer relationships while ensuring high ethical standards and safe and sound banking practices; |
| · | the scope, relevance and pricing of products and services that we offer; |
| · | customer satisfaction with our products and services; |
| · | industry and general economic trends; and |
| · | our ability to keep pace with technological advances and to invest in new technology. |
| 30 | ||
| 31 | ||
| · | general or local economic conditions; |
| · | environmental cleanup liability; |
| · | neighborhood assessments; |
| · | interest rates; |
| · | real estate tax rates; |
| · | operating expenses of the mortgaged properties; |
| · | supply of and demand for rental units or properties; |
| · | ability to obtain and maintain adequate occupancy of the properties; |
| · | zoning laws; |
| · | governmental and regulatory rules; |
| · | fiscal policies; and |
| · | natural disasters. |
| 32 | ||
| 33 | ||
| 34 | ||
| 35 | ||
| 36 | ||
| 37 | ||
| 38 | ||
| 39 | ||
| · | provide that special meetings of stockholders may be called at any time by the Chairman of our board of directors, by the President or by order of the board of directors; |
| · | enable our board of directors to issue preferred stock up to the authorized amount, with such preferences, limitations and relative rights, including voting rights, as may be determined from time to time by the board; |
| · | enable our board of directors to increase the number of persons serving as directors and to fill the vacancies created as a result of the increase by a majority vote of the directors present at the meeting; |
| · | enable our board of directors to amend our bylaws without stockholder approval; and |
| · | do not provide for cumulative voting rights (therefore allowing the holders of a majority of the shares of common stock entitled to vote in any election of directors to elect all of the directors standing for election, if they should so choose). |
|
State
|
|
|
|
|
|
|
|
|
|
|
MSA
|
|
|
|
|
|
Owned or
|
|
|
|
|
Office Address
|
|
City
|
|
Zip Code
|
|
Leased
|
|
Date Opened
|
|
|
Alabama:
|
|
|
|
|
|
|
|
|
|
|
Birmingham-Hoover:
|
|
|
|
|
|
|
|
|
|
|
850 Shades Creek Parkway, Suite 200 (1)
|
|
Birmingham
|
|
35209
|
|
Leased
|
|
3/2/2005
|
|
|
324 Richard Arrington Jr. Boulevard North
|
|
Birmingham
|
|
35203
|
|
Leased
|
|
12/19/2005
|
|
|
5403 Highway 280, Suite 401
|
|
Birmingham
|
|
35242
|
|
Leased
|
|
8/15/2006
|
|
|
Total
|
|
|
|
3 Offices
|
|
|
|
|
|
|
|
|
|
|
|
|
|
|
|
|
|
Huntsville:
|
|
|
|
|
|
|
|
|
|
|
401 Meridian Street, Suite 100
|
|
Huntsville
|
|
35801
|
|
Leased
|
|
11/21/2006
|
|
|
1267 Enterprise Way, Suite A (1)
|
|
Huntsville
|
|
35806
|
|
Leased
|
|
8/21/2006
|
|
|
Total
|
|
|
|
2 Offices
|
|
|
|
|
|
|
|
|
|
|
|
|
|
|
|
|
|
Montgomery:
|
|
|
|
|
|
|
|
|
|
|
1 Commerce Street, Suite 200
|
|
Montgomery
|
|
36104
|
|
Leased
|
|
6/4/2007
|
|
|
8117 Vaughn Road, Unit 20
|
|
Montgomery
|
|
36116
|
|
Leased
|
|
9/26/2007
|
|
|
Total
|
|
|
|
2 Offices
|
|
|
|
|
|
|
|
|
|
|
|
|
|
|
|
|
|
Dothan:
|
|
|
|
|
|
|
|
|
|
|
4801 West Main Street (1)
|
|
Dothan
|
|
36305
|
|
Leased
|
|
10/17/2008
|
|
|
1640 Ross Clark Circle
|
|
Dothan
|
|
36301
|
|
Leased
|
|
2/1/2011
|
|
|
Total
|
|
|
|
2 Offices
|
|
|
|
|
|
|
|
|
|
|
|
|
|
|
|
|
|
Mobile:
|
|
|
|
|
|
|
|
|
|
|
64 North Royal Street
|
|
Mobile
|
|
36602
|
|
Leased
|
|
7/9/2012
|
|
|
|
|
|
|
1 Office
|
|
|
|
|
|
|
Total Offices in Alabama
|
|
|
|
10 Offices
|
|
|
|
|
|
|
|
|
|
|
|
|
|
|
|
|
|
Florida:
|
|
|
|
|
|
|
|
|
|
|
Pensacola-Ferry Pass-Brent:
|
|
|
|
|
|
|
|
|
|
|
316 South Balen Street
|
|
Pensacola
|
|
32502
|
|
Leased
|
|
4/1/2011
|
|
|
4980 North 12th Avenue
|
|
Pensacola
|
|
32504
|
|
Owned
|
|
8/27/2012
|
|
|
Total
|
|
|
|
2 Offices
|
|
|
|
|
|
|
|
|
|
|
|
|
|
|
|
|
|
Tennessee:
|
|
|
|
|
|
|
|
|
|
|
Nashville:
|
|
|
|
|
|
|
|
|
|
|
611 Commerce Street (2)
|
|
Nashville
|
|
37203
|
|
Leased
|
|
6/4/2013
|
|
|
|
|
|
|
1 Office
|
|
|
|
|
|
|
Total offices
|
|
|
|
13 Offices
|
|
|
|
|
|
| 40 | ||
| 41 | ||
|
Plan Category
|
|
Number of Securities
Issued/To Be Issued Upon Exercise of Outstanding Awards |
|
|
Weighted-average
Exercise Price of Outstanding Awards |
|
Number of Securities
Remaining Available For Future Issuance Under Equity Compensation Plans |
|
|
Equity Compensation Award-Plans Approved by Security Holders
|
|
806,500
|
|
$
|
24.15
|
|
217,670
|
|
|
Equity Compensation Awards-Plans Not Approved by Security Holders
|
|
48,300
|
|
|
17.59
|
|
-
|
|
|
Total
|
|
854,800
|
|
$
|
23.77
|
|
217,670
|
|
| 42 | ||
|
|
|
Date
|
|
||||||||||
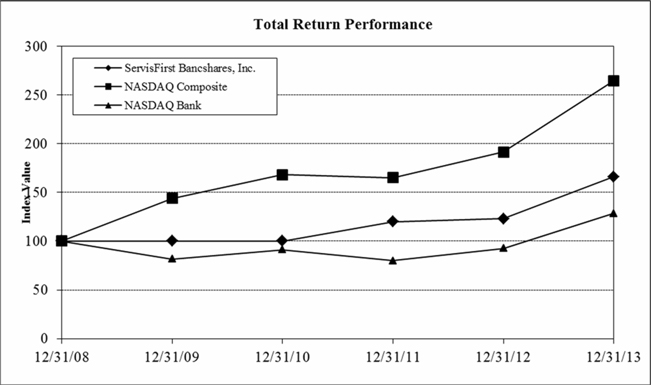
|
Index:
|
|
12/31/2008
|
|
12/31/2009
|
|
12/31/2010
|
|
12/31/2011
|
|
12/31/2012
|
|
12/31/2013
|
|
|
ServisFirst Bancshares, Inc.
|
|
100.00
|
|
100.00
|
|
100.00
|
|
120.00
|
|
123.00
|
|
166.00
|
|
|
NASDAQ Composite
|
|
100.00
|
|
143.89
|
|
168.22
|
|
165.19
|
|
191.47
|
|
264.84
|
|
|
NASDAQ Bank
|
|
100.00
|
|
81.50
|
|
91.18
|
|
79.85
|
|
92.46
|
|
128.43
|
|
| 43 | ||
|
|
|
As of and for the years ended December 31,
|
|
|||||||||||||||||
|
|
|
2013
|
|
|
2012
|
|
|
2011
|
|
|
2010
|
|
|
2009
|
|
|||||
|
|
|
(Dollars in thousands except for share and per share data)
|
|
|||||||||||||||||
|
Selected Balance Sheet Data:
|
|
|
|
|
|
|
|
|
|
|
|
|
|
|
|
|
|
|
|
|
|
Total Assets
|
|
$
|
3,520,699
|
|
|
$
|
2,906,314
|
|
|
$
|
2,460,785
|
|
|
$
|
1,935,166
|
|
|
$
|
1,573,497
|
|
|
Total Loans
|
|
|
2,858,868
|
|
|
|
2,363,182
|
|
|
|
1,830,742
|
|
|
|
1,394,818
|
|
|
|
1,207,084
|
|
|
Loans, net
|
|
|
2,828,205
|
|
|
|
2,336,924
|
|
|
|
1,808,712
|
|
|
|
1,376,741
|
|
|
|
1,192,173
|
|
|
Securities available for sale
|
|
|
266,220
|
|
|
|
233,877
|
|
|
|
293,809
|
|
|
|
276,959
|
|
|
|
255,453
|
|
|
Securities held to maturity
|
|
|
32,274
|
|
|
|
25,967
|
|
|
|
15,209
|
|
|
|
5,234
|
|
|
|
645
|
|
|
Cash and due from banks
|
|
|
61,370
|
|
|
|
58,031
|
|
|
|
43,018
|
|
|
|
27,454
|
|
|
|
26,982
|
|
|
Interest-bearing balances with banks
|
|
|
188,411
|
|
|
|
119,423
|
|
|
|
99,350
|
|
|
|
204,278
|
|
|
|
48,544
|
|
|
Fed funds sold
|
|
|
8,634
|
|
|
|
3,291
|
|
|
|
100,565
|
|
|
|
346
|
|
|
|
680
|
|
|
Mortgage loans held for sale
|
|
|
8,134
|
|
|
|
25,826
|
|
|
|
17,859
|
|
|
|
7,875
|
|
|
|
6,202
|
|
|
Restricted equity securities
|
|
|
3,738
|
|
|
|
3,941
|
|
|
|
3,501
|
|
|
|
3,510
|
|
|
|
3,241
|
|
|
Premises and equipment, net
|
|
|
8,351
|
|
|
|
8,847
|
|
|
|
4,591
|
|
|
|
4,450
|
|
|
|
5,088
|
|
|
Deposits
|
|
|
3,019,642
|
|
|
|
2,511,572
|
|
|
|
2,143,887
|
|
|
|
1,758,716
|
|
|
|
1,432,355
|
|
|
Other borrowings
|
|
|
194,320
|
|
|
|
136,982
|
|
|
|
84,219
|
|
|
|
24,937
|
|
|
|
24,922
|
|
|
Subordinated debentures
|
|
|
-
|
|
|
|
15,050
|
|
|
|
30,514
|
|
|
|
30,420
|
|
|
|
15,228
|
|
|
Other liabilities
|
|
|
9,545
|
|
|
|
9,453
|
|
|
|
5,873
|
|
|
|
3,993
|
|
|
|
3,370
|
|
|
Stockholders' Equity
|
|
|
297,192
|
|
|
|
233,257
|
|
|
|
196,292
|
|
|
|
117,100
|
|
|
|
97,622
|
|
|
Selected income Statement Data:
|
|
|
|
|
|
|
|
|
|
|
|
|
|
|
|
|
|
|
|
|
|
Interest income
|
|
$
|
126,081
|
|
|
$
|
109,023
|
|
|
$
|
91,411
|
|
|
$
|
78,146
|
|
|
$
|
62,197
|
|
|
Interest expense
|
|
|
13,619
|
|
|
|
14,901
|
|
|
|
16,080
|
|
|
|
15,260
|
|
|
|
18,337
|
|
|
Net interest income
|
|
|
112,462
|
|
|
|
94,122
|
|
|
|
75,331
|
|
|
|
62,886
|
|
|
|
43,860
|
|
|
Provision for loan losses
|
|
|
13,008
|
|
|
|
9,100
|
|
|
|
8,972
|
|
|
|
10,350
|
|
|
|
10,685
|
|
|
Net interest income after provision for loan losses
|
|
|
99,454
|
|
|
|
85,022
|
|
|
|
66,359
|
|
|
|
52,536
|
|
|
|
33,175
|
|
|
Noninterest income
|
|
|
10,010
|
|
|
|
9,643
|
|
|
|
6,926
|
|
|
|
5,169
|
|
|
|
4,413
|
|
|
Noninterest expense
|
|
|
47,489
|
|
|
|
43,100
|
|
|
|
37,458
|
|
|
|
30,969
|
|
|
|
28,930
|
|
|
Income before income taxes
|
|
|
61,975
|
|
|
|
51,565
|
|
|
|
35,827
|
|
|
|
26,736
|
|
|
|
8,658
|
|
|
Income taxes expenses
|
|
|
20,358
|
|
|
|
17,120
|
|
|
|
12,389
|
|
|
|
9,358
|
|
|
|
2,780
|
|
|
Net income
|
|
|
41,617
|
|
|
|
34,445
|
|
|
|
23,438
|
|
|
|
17,378
|
|
|
|
5,878
|
|
|
Net income available to common stockholders
|
|
|
41,201
|
|
|
|
34,045
|
|
|
|
23,238
|
|
|
|
17,378
|
|
|
|
5,878
|
|
|
Per common Share Data:
|
|
|
|
|
|
|
|
|
|
|
|
|
|
|
|
|
|
|
|
|
|
Net income, basic
|
|
$
|
6.00
|
|
|
$
|
5.68
|
|
|
$
|
4.03
|
|
|
$
|
3.15
|
|
|
$
|
1.07
|
|
|
Net income, diluted
|
|
|
5.69
|
|
|
|
4.99
|
|
|
$
|
3.53
|
|
|
$
|
2.84
|
|
|
$
|
1.02
|
|
|
Book value
|
|
|
35.00
|
|
|
|
30.84
|
|
|
$
|
26.35
|
|
|
$
|
21.19
|
|
|
$
|
17.71
|
|
|
Weighted average shares outstanding:
|
|
|
|
|
|
|
|
|
|
|
|
|
|
|
|
|
|
|
|
|
|
Basic
|
|
|
6,869,071
|
|
|
|
5,996,437
|
|
|
|
5,759,524
|
|
|
|
5,519,151
|
|
|
|
5,485,972
|
|
|
Diluted
|
|
|
7,268,675
|
|
|
|
6,941,752
|
|
|
|
6,749,163
|
|
|
|
6,294,604
|
|
|
|
5,787,643
|
|
|
Actual shares outstanding
|
|
|
7,350,012
|
|
|
|
6,268,812
|
|
|
|
5,932,182
|
|
|
|
5,527,482
|
|
|
|
5,513,482
|
|
|
Selected Performance Ratios:
|
|
|
|
|
|
|
|
|
|
|
|
|
|
|
|
|
|
|
|
|
|
Return on average assets
|
|
|
1.31
|
%
|
|
|
1.30
|
%
|
|
|
1.11
|
%
|
|
|
1.04
|
%
|
|
|
0.43
|
%
|
|
Return on average stockholders' equity
|
|
|
15.54
|
%
|
|
|
15.81
|
%
|
|
|
14.73
|
%
|
|
|
15.86
|
%
|
|
|
6.33
|
%
|
|
Dividend payout ratio
|
|
|
8.79
|
%
|
|
|
10.02
|
%
|
|
|
-
|
%
|
|
|
-
|
%
|
|
|
-
|
%
|
|
Net interest margin (1)
|
|
|
3.80
|
%
|
|
|
3.80
|
%
|
|
|
3.79
|
%
|
|
|
3.94
|
%
|
|
|
3.31
|
%
|
|
Efficiency ratio (2)
|
|
|
38.78
|
%
|
|
|
41.54
|
%
|
|
|
45.54
|
%
|
|
|
45.51
|
%
|
|
|
59.93
|
%
|
|
Asset quality Ratios:
|
|
|
|
|
|
|
|
|
|
|
|
|
|
|
|
|
|
|
|
|
|
Net charge-offs to average loans outstanding
|
|
|
0.33
|
%
|
|
|
0.24
|
%
|
|
|
0.32
|
%
|
|
|
0.55
|
%
|
|
|
0.60
|
%
|
|
Non-performing loans to totals loans
|
|
|
0.34
|
%
|
|
|
0.44
|
%
|
|
|
0.75
|
%
|
|
|
1.03
|
%
|
|
|
1.01
|
%
|
|
Non-performing assets to total assets
|
|
|
0.64
|
%
|
|
|
0.69
|
%
|
|
|
1.06
|
%
|
|
|
1.10
|
%
|
|
|
1.57
|
%
|
|
Allowance for loan losses to total gross loans
|
|
|
1.07
|
%
|
|
|
1.11
|
%
|
|
|
1.20
|
%
|
|
|
1.30
|
%
|
|
|
1.22
|
%
|
|
Allowance for loan losses to total non-performing loans
|
|
|
314.94
|
%
|
|
|
253.50
|
%
|
|
|
159.96
|
%
|
|
|
126.00
|
%
|
|
|
120.91
|
%
|
|
Liquidity Ratios:
|
|
|
|
|
|
|
|
|
|
|
|
|
|
|
|
|
|
|
|
|
|
Net loans to total deposits
|
|
|
93.66
|
%
|
|
|
93.05
|
%
|
|
|
84.37
|
%
|
|
|
78.28
|
%
|
|
|
83.23
|
%
|
|
Net average loans to average earning assets
|
|
|
84.80
|
%
|
|
|
79.89
|
%
|
|
|
76.71
|
%
|
|
|
78.04
|
%
|
|
|
80.06
|
%
|
|
Noninterest-bearing deposits to total deposits
|
|
|
21.54
|
%
|
|
|
21.71
|
%
|
|
|
19.54
|
%
|
|
|
14.24
|
%
|
|
|
14.75
|
%
|
|
Capital Adequacy Ratios:
|
|
|
|
|
|
|
|
|
|
|
|
|
|
|
|
|
|
|
|
|
|
Stockholders' Equity to total assets
|
|
|
8.44
|
%
|
|
|
8.03
|
%
|
|
|
7.98
|
%
|
|
|
6.05
|
%
|
|
|
6.20
|
%
|
|
Total risked-based capital (3)
|
|
|
11.73
|
%
|
|
|
11.78
|
%
|
|
|
12.79
|
%
|
|
|
11.82
|
%
|
|
|
10.48
|
%
|
|
Tier 1 capital (4)
|
|
|
10.00
|
%
|
|
|
9.89
|
%
|
|
|
11.39
|
%
|
|
|
10.22
|
%
|
|
|
8.89
|
%
|
|
Leverage ratio (5)
|
|
|
8.48
|
%
|
|
|
8.43
|
%
|
|
|
9.17
|
%
|
|
|
7.77
|
%
|
|
|
6.97
|
%
|
|
Growth Ratios:
|
|
|
|
|
|
|
|
|
|
|
|
|
|
|
|
|
|
|
|
|
|
Percentage change in net income
|
|
|
20.82
|
%
|
|
|
46.96
|
%
|
|
|
34.87
|
%
|
|
|
195.64
|
%
|
|
|
(16.09)
|
%
|
|
Percentage change in diluted net income per share
|
|
|
14.03
|
%
|
|
|
41.36
|
%
|
|
|
24.30
|
%
|
|
|
178.43
|
%
|
|
|
(22.14)
|
%
|
|
Percentage change in assets
|
|
|
21.14
|
%
|
|
|
18.11
|
%
|
|
|
27.16
|
%
|
|
|
22.99
|
%
|
|
|
35.38
|
%
|
|
Percentage change in net loans
|
|
|
21.02
|
%
|
|
|
29.20
|
%
|
|
|
31.38
|
%
|
|
|
15.48
|
%
|
|
|
24.49
|
%
|
|
Percentage change in deposits
|
|
|
20.23
|
%
|
|
|
17.15
|
%
|
|
|
21.90
|
%
|
|
|
22.78
|
%
|
|
|
38.08
|
%
|
|
Percentage change in equity
|
|
|
27.41
|
%
|
|
|
18.83
|
%
|
|
|
67.63
|
%
|
|
|
19.95
|
%
|
|
|
12.49
|
%
|
| 44 | ||
| 45 | ||
| 46 | ||
|
|
|
For the years ended December 31,
|
|
||||
|
|
|
2013
|
|
2012
|
|
2011
|
|
|
Return on average assets
|
|
1.31
|
%
|
1.30
|
%
|
1.11
|
%
|
|
Return on average stockholders' equity
|
|
15.54
|
%
|
15.81
|
%
|
14.73
|
%
|
|
Dividend payout ratio
|
|
8.79
|
%
|
10.02
|
%
|
-
|
%
|
|
Average stockholders' equity to
average total assets |
|
8.43
|
%
|
8.19
|
%
|
7.56
|
%
|
|
|
|
|
Year Ended December 31,
|
|
|
|
|
|||||
|
|
|
|
2013
|
|
|
2012
|
|
Change from
the Prior Year |
|
|||
|
|
|
|
(Dollars in Thousands)
|
|
|
|
|
|||||
|
Interest income
|
|
|
$
|
126,081
|
|
|
$
|
109,023
|
|
|
15.65
|
%
|
|
Interest expense
|
|
|
|
13,619
|
|
|
|
14,901
|
|
|
-8.60
|
%
|
|
Net interest income
|
|
|
|
112,462
|
|
|
|
94,122
|
|
|
19.49
|
%
|
|
Provision for loan losses
|
|
|
|
13,008
|
|
|
|
9,100
|
|
|
42.95
|
%
|
|
Net interest income after
provision for loan losses |
|
|
|
99,454
|
|
|
|
85,022
|
|
|
16.97
|
%
|
|
Noninterest income
|
|
|
|
10,010
|
|
|
|
9,643
|
|
|
3.81
|
%
|
|
Noninterest expense
|
|
|
|
47,489
|
|
|
|
43,100
|
|
|
10.18
|
%
|
|
Net income before taxes
|
|
|
|
61,975
|
|
|
|
51,565
|
|
|
20.19
|
%
|
|
Taxes
|
|
|
|
20,358
|
|
|
|
17,120
|
|
|
18.91
|
%
|
|
Net income
|
|
|
|
41,617
|
|
|
|
34,445
|
|
|
20.82
|
%
|
|
Dividends on preferred stock
|
|
|
|
416
|
|
|
|
400
|
|
|
4.00
|
%
|
|
Net income available to
common stockholders |
|
|
$
|
41,201
|
|
|
$
|
34,045
|
|
|
21.02
|
%
|
|
|
|
Year Ended December 31,
|
|
|
|
|
||||
|
|
|
2012
|
|
2011
|
|
Change from
the Prior Year |
|
|||
|
|
|
(Dollars in Thousands)
|
|
|
|
|
||||
|
Interest income
|
|
$
|
109,023
|
|
$
|
91,411
|
|
|
19.27
|
%
|
|
Interest expense
|
|
|
14,901
|
|
|
16,080
|
|
|
-7.33
|
%
|
|
Net interest income
|
|
|
94,122
|
|
|
75,331
|
|
|
24.94
|
%
|
|
Provision for loan losses
|
|
|
9,100
|
|
|
8,972
|
|
|
1.43
|
%
|
|
Net interest income after
provision for loan losses |
|
|
85,022
|
|
|
66,359
|
|
|
28.12
|
%
|
|
Noninterest income
|
|
|
9,643
|
|
|
6,926
|
|
|
39.23
|
%
|
|
Noninterest expense
|
|
|
43,100
|
|
|
37,458
|
|
|
15.06
|
%
|
|
Net income before taxes
|
|
|
51,565
|
|
|
35,827
|
|
|
43.93
|
%
|
|
Taxes
|
|
|
17,120
|
|
|
12,389
|
|
|
38.19
|
%
|
|
Net income
|
|
|
34,445
|
|
|
23,438
|
|
|
46.96
|
%
|
|
Dividends on preferred stock
|
|
|
400
|
|
|
200
|
|
|
100.00
|
%
|
|
Net income available to
common stockholders |
|
$
|
34,045
|
|
$
|
23,238
|
|
|
46.51
|
%
|
| 47 | ||
| 48 | ||
|
|
|
2013
|
|
2012
|
|
2011
|
|
||||||||||||||||||
|
|
|
Average
Balance |
|
Interest
Earned / Paid |
|
Average
Yield / Rate |
|
Average
Balance |
|
Interest
Earned / Paid |
|
Average
Yield / Rate |
|
Average
Balance |
|
Interest
Earned / Paid |
|
Average
Yield / Rate |
|
||||||
|
Assets:
|
|
|
|
|
|
|
|
|
|
|
|
|
|
|
|
|
|
|
|
|
|
|
|
|
|
|
Interest-earning assets:
|
|
|
|
|
|
|
|
|
|
|
|
|
|
|
|
|
|
|
|
|
|
|
|
|
|
|
Loans, net of unearned income
|
|
|
|
|
|
|
|
|
|
|
|
|
|
|
|
|
|
|
|
|
|
|
|
|
|
|
|
|
|
|
|
|
|
|
|
|
|
|
|
|
|
|
|
|
|
|
|
|
|
|
|
|
|
Taxable (1)
|
|
$
|
2,573,621
|
|
$
|
118,032
|
|
4.59
|
%
|
$
|
2,034,478
|
|
$
|
100,143
|
|
4.92
|
%
|
$
|
1,573,500
|
|
$
|
82,083
|
|
5.22
|
%
|
|
Tax-exempt (2)
|
|
|
3,274
|
|
|
170
|
|
5.19
|
|
|
1,631
|
|
|
95
|
|
5.82
|
|
|
-
|
|
|
-
|
|
-
|
|
|
Mortgage loans held for sale
|
|
|
12,953
|
|
|
306
|
|
2.36
|
|
|
17,905
|
|
|
349
|
|
1.95
|
|
|
7,556
|
|
|
211
|
|
2.79
|
|
|
Securities:
|
|
|
|
|
|
|
|
|
|
|
|
|
|
|
|
|
|
|
|
|
|
|
|
|
|
|
Taxable
|
|
|
149,996
|
|
|
3,906
|
|
2.60
|
|
|
184,174
|
|
|
4,815
|
|
2.61
|
|
|
188,315
|
|
|
5,721
|
|
3.04
|
|
|
Tax-exempt (2)
|
|
|
115,829
|
|
|
4,884
|
|
4.22
|
|
|
100,926
|
|
|
4,683
|
|
4.64
|
|
|
82,239
|
|
|
4,275
|
|
5.20
|
|
|
Total securities (3)
|
|
|
265,825
|
|
|
8,790
|
|
3.31
|
|
|
285,100
|
|
|
9,498
|
|
3.33
|
|
|
270,554
|
|
|
9,996
|
|
3.69
|
|
|
Federal funds sold
|
|
|
44,106
|
|
|
110
|
|
0.25
|
|
|
94,425
|
|
|
196
|
|
0.21
|
|
|
85,825
|
|
|
176
|
|
0.21
|
|
|
Restricted equity securities
|
|
|
4,299
|
|
|
93
|
|
2.16
|
|
|
4,434
|
|
|
104
|
|
2.35
|
|
|
4,259
|
|
|
74
|
|
1.74
|
|
|
Interest-bearing balances with banks
|
|
|
100,417
|
|
|
280
|
|
0.28
|
|
|
80,170
|
|
|
200
|
|
0.25
|
|
|
83,152
|
|
|
203
|
|
0.24
|
|
|
|
|
|
|
|
|
|
|
|
|
|
|
|
|
|
|
|
|
|
|
|
|
|
|
|
|
|
Total interest-earning assets
|
|
$
|
3,004,495
|
|
$
|
127,781
|
|
4.25
|
%
|
$
|
2,518,143
|
|
$
|
110,585
|
|
4.39
|
%
|
$
|
2,024,846
|
|
$
|
92,743
|
|
4.58
|
%
|
|
Non-interest-earning assets:
|
|
|
|
|
|
|
|
|
|
|
|
|
|
|
|
|
|
|
|
|
|
|
|
|
|
|
Cash and due from banks
|
|
|
45,528
|
|
|
|
|
|
|
|
38,467
|
|
|
|
|
|
|
|
28,304
|
|
|
|
|
|
|
|
Net premises and equipment
|
|
|
9,148
|
|
|
|
|
|
|
|
6,074
|
|
|
|
|
|
|
|
4,813
|
|
|
|
|
|
|
|
Allowance for loan losses,
|
|
|
|
|
|
|
|
|
|
|
|
|
|
|
|
|
|
|
|
|
|
|
|
|
|
|
accrued interest and
|
|
|
|
|
|
|
|
|
|
|
|
|
|
|
|
|
|
|
|
|
|
|
|
|
|
|
other assets
|
|
|
84,297
|
|
|
|
|
|
|
|
65,504
|
|
|
|
|
|
|
|
29,094
|
|
|
|
|
|
|
|
Total assets
|
|
$
|
3,143,468
|
|
|
|
|
|
|
$
|
2,628,188
|
|
|
|
|
|
|
$
|
2,087,057
|
|
|
|
|
|
|
|
|
|
|
|
|
|
|
|
|
|
|
|
|
|
|
|
|
|
|
|
|
|
|
|
|
|
|
Interest-bearing liabilities:
|
|
|
|
|
|
|
|
|
|
|
|
|
|
|
|
|
|
|
|
|
|
|
|
|
|
|
Interest-bearing deposits:
|
|
|
|
|
|
|
|
|
|
|
|
|
|
|
|
|
|
|
|
|
|
|
|
|
|
|
Checking
|
|
$
|
433,931
|
|
$
|
1,201
|
|
0.28
|
%
|
$
|
351,975
|
|
$
|
1,074
|
|
0.31
|
%
|
$
|
303,165
|
|
$
|
1,133
|
|
0.37
|
%
|
|
Savings
|
|
|
21,793
|
|
|
61
|
|
0.28
|
|
|
17,081
|
|
|
48
|
|
0.28
|
|
|
10,088
|
|
|
47
|
|
0.47
|
|
|
|
|
|
|
|
|
|
|
|
|
|
|
|
|
|
|
|
|
|
|
|
|
|
|
|
|
|
Money market
|
|
|
1,244,957
|
|
|
5,810
|
|
0.47
|
|
|
1,042,870
|
|
|
5,820
|
|
0.56
|
|
|
902,290
|
|
|
6,675
|
|
0.74
|
|
|
Time deposits
|
|
|
404,927
|
|
|
4,758
|
|
1.18
|
|
|
398,552
|
|
|
5,307
|
|
1.33
|
|
|
330,221
|
|
|
5,192
|
|
1.57
|
|
|
Federal funds purchased
|
|
|
167,063
|
|
|
462
|
|
0.28
|
|
|
88,732
|
|
|
222
|
|
0.25
|
|
|
19,335
|
|
|
49
|
|
0.25
|
|
|
Other borrowings
|
|
|
21,780
|
|
|
1,327
|
|
6.09
|
|
|
33,126
|
|
|
2,430
|
|
7.34
|
|
|
41,866
|
|
|
2,984
|
|
7.13
|
|
|
|
|
|
|
|
|
|
|
|
|
|
|
|
|
|
|
|
|
|
|
|
|
|
|
|
|
|
Total interest-bearing liabilities
|
|
$
|
2,294,451
|
|
$
|
13,619
|
|
0.59
|
%
|
$
|
1,932,336
|
|
$
|
14,901
|
|
0.77
|
%
|
$
|
1,606,965
|
|
$
|
16,080
|
|
1.00
|
%
|
|
Non-interest-bearing liabilities:
|
|
|
|
|
|
|
|
|
|
|
|
|
|
|
|
|
|
|
|
|
|
|
|
|
|
|
|
|
|
|
|
|
|
|
|
|
|
|
|
|
|
|
|
|
|
|
|
|
|
|
|
|
|
Non-interest-bearing
checking |
|
|
576,072
|
|
|
|
|
|
|
|
474,284
|
|
|
|
|
|
|
|
315,781
|
|
|
|
|
|
|
|
Other liabilities
|
|
|
7,835
|
|
|
|
|
|
|
|
6,200
|
|
|
|
|
|
|
|
6,580
|
|
|
|
|
|
|
|
Stockholders' equity
|
|
|
259,631
|
|
|
|
|
|
|
|
207,656
|
|
|
|
|
|
|
|
145,050
|
|
|
|
|
|
|
|
Unrealized gains on securities
and derivatives |
|
|
5,479
|
|
|
|
|
|
|
|
7,712
|
|
|
|
|
|
|
|
12,681
|
|
|
|
|
|
|
|
|
|
|
|
|
|
|
|
|
|
|
|
|
|
|
|
|
|
|
|
|
|
|
|
|
|
|
Total liabilities and
stockholders' equity |
|
$
|
3,143,468
|
|
|
|
|
|
|
$
|
2,628,188
|
|
|
|
|
|
|
$
|
2,087,057
|
|
|
|
|
|
|
|
Net interest spread
|
|
|
|
|
|
|
|
3.66
|
%
|
|
|
|
|
|
|
3.62
|
%
|
|
|
|
|
|
|
3.58
|
%
|
|
Net interest margin
|
|
|
|
|
|
|
|
3.80
|
%
|
|
|
|
|
|
|
3.80
|
%
|
|
|
|
|
|
|
3.79
|
%
|
|
(1)
|
Non-accrual loans are included in average loan balances in all periods. Loan fees of $551,000, $372,000 and $538,000 are included in interest income in 2013, 2012 and 2011, respectively.
|
|
(2)
|
Interest income and yields are presented on a fully taxable equivalent basis using a tax rate of 35%.
|
|
(3)
|
Unrealized gains of $8,408,000, $11,998,000 and $7,624,000 are excluded from the yield calculation in 2013, 2012 and 2011, respectively.
|
| 49 | ||
|
|
|
For the Year Ended December 31,
|
|
||||||||||||||||
|
|
|
2013 Compared to 2012 Increase (Decrease) in Interest
Income and Expense Due to Changes in: |
|
2012 Compared to 2011 Increase (Decrease) in Interest
Income and Expense Due to Changes in: |
|
||||||||||||||
|
|
|
Volume
|
|
Rate
|
|
Total
|
|
Volume
|
|
Rate
|
|
Total
|
|
||||||
|
Interest-earning assets:
|
|
|
|
|
|
|
|
|
|
|
|
|
|
|
|
|
|
|
|
|
Loans, net of unearned income
|
|
|
|
|
|
|
|
|
|
|
|
|
|
|
|
|
|
|
|
|
Taxable
|
|
$
|
25,097
|
|
$
|
(7,208)
|
|
$
|
17,889
|
|
$
|
22,910
|
|
$
|
(4,850)
|
|
$
|
18,060
|
|
|
Tax-exempt
|
|
|
86
|
|
|
(11)
|
|
|
75
|
|
|
95
|
|
|
-
|
|
|
95
|
|
|
Mortgages held for sale
|
|
|
(108)
|
|
|
65
|
|
|
(43)
|
|
|
218
|
|
|
(80)
|
|
|
138
|
|
|
Taxable
|
|
|
(890)
|
|
|
(19)
|
|
|
(909)
|
|
|
(124)
|
|
|
(782)
|
|
|
(906)
|
|
|
Tax-exempt
|
|
|
652
|
|
|
(451)
|
|
|
201
|
|
|
900
|
|
|
(492)
|
|
|
408
|
|
|
Federal funds sold
|
|
|
(119)
|
|
|
33
|
|
|
(86)
|
|
|
18
|
|
|
2
|
|
|
20
|
|
|
Restricted equity securities
|
|
|
(3)
|
|
|
(8)
|
|
|
(11)
|
|
|
3
|
|
|
27
|
|
|
30
|
|
|
Interest-bearing balances
with banks |
|
|
54
|
|
|
26
|
|
|
80
|
|
|
(7)
|
|
|
4
|
|
|
(3)
|
|
|
Total interest-earning assets
|
|
|
24,769
|
|
|
(7,573)
|
|
|
17,196
|
|
|
24,013
|
|
|
(6,171)
|
|
|
17,842
|
|
|
|
|
|
|
|
|
|
|
|
|
|
|
|
|
|
|
|
|
|
|
|
Interest-bearing liabilities:
|
|
|
|
|
|
|
|
|
|
|
|
|
|
|
|
|
|
|
|
|
Interest-bearing demand deposits
|
|
|
234
|
|
|
(107)
|
|
|
127
|
|
|
167
|
|
|
(226)
|
|
|
(59)
|
|
|
Savings
|
|
|
13
|
|
|
-
|
|
|
13
|
|
|
25
|
|
|
(24)
|
|
|
1
|
|
|
Money market
|
|
|
1,028
|
|
|
(1,038)
|
|
|
(10)
|
|
|
941
|
|
|
(1,796)
|
|
|
(855)
|
|
|
Time deposits
|
|
|
84
|
|
|
(633)
|
|
|
(549)
|
|
|
980
|
|
|
(865)
|
|
|
115
|
|
|
Federal funds purchased
|
|
|
215
|
|
|
25
|
|
|
240
|
|
|
174
|
|
|
(1)
|
|
|
173
|
|
|
Other borrowed funds
|
|
|
(738)
|
|
|
(365)
|
|
|
(1,103)
|
|
|
(641)
|
|
|
87
|
|
|
(554)
|
|
|
Total interest-bearing
liabilities |
|
|
836
|
|
|
(2,118)
|
|
|
(1,282)
|
|
|
1,646
|
|
|
(2,825)
|
|
|
(1,179)
|
|
|
Increase in net interest income
|
|
$
|
23,933
|
|
$
|
(5,455)
|
|
$
|
18,478
|
|
$
|
22,367
|
|
$
|
(3,346)
|
|
$
|
19,021
|
|
| 50 | ||
| 51 | ||
| 52 | ||
|
|
|
December 31,
|
|
|||||||
|
|
|
2013
|
|
2012
|
|
2011
|
|
|||
|
Securities Available for Sale
|
|
|
|
|
|
|
|
|
|
|
|
U.S. Treasury and government agencies
|
|
$
|
31,641
|
|
$
|
27,360
|
|
$
|
98,169
|
|
|
Mortgage-backed securities
|
|
|
85,764
|
|
|
69,298
|
|
|
88,118
|
|
|
State and municipal securities
|
|
|
127,083
|
|
|
112,319
|
|
|
95,331
|
|
|
Corporate debt
|
|
|
15,738
|
|
|
13,677
|
|
|
1,030
|
|
|
Total
|
|
$
|
260,226
|
|
$
|
222,654
|
|
$
|
282,648
|
|
|
Securities Held to Maturity
|
|
|
|
|
|
|
|
|
|
|
|
Mortgage-backed securities
|
|
$
|
26,730
|
|
$
|
20,429
|
|
$
|
9,676
|
|
|
State and municipal securities
|
|
|
5,544
|
|
|
5,538
|
|
|
5,533
|
|
|
Total
|
|
$
|
32,274
|
|
$
|
25,967
|
|
$
|
15,209
|
|
| 53 | ||
|
Maturity of Debt Securities - Amortized Cost
|
|
|||||||||||||||||||
|
|
|
|
|
|
|
|
|
|
|
|
|
|
|
|
|
|
|
|
|
|
|
|
|
Less Than One
Year |
|
|
One Year through
Five Years |
|
|
Six Years
through Ten Years |
|
|
More Than Ten
Years |
|
|
Total
|
|
|||||
|
|
|
(In Thousands)
|
|
|||||||||||||||||
|
At December 31, 2013:
|
|
|
|
|
|
|
|
|
|
|
|
|
|
|
|
|
|
|
|
|
|
Securities Available for Sale:
|
|
|
|
|
|
|
|
|
|
|
|
|
|
|
|
|
|
|
|
|
|
U.S. Treasury and government agencies
|
|
$
|
59
|
|
|
$
|
22,676
|
|
|
$
|
8,906
|
|
|
$
|
-
|
|
|
$
|
31,641
|
|
|
Mortgage-backed securities
|
|
|
195
|
|
|
|
83,929
|
|
|
|
1,147
|
|
|
|
493
|
|
|
|
85,764
|
|
|
State and municipal securities
|
|
|
5,600
|
|
|
|
70,106
|
|
|
|
50,283
|
|
|
|
1,094
|
|
|
|
127,083
|
|
|
Corporate debt
|
|
|
-
|
|
|
|
9,753
|
|
|
|
5,985
|
|
|
|
-
|
|
|
|
15,738
|
|
|
Total
|
|
$
|
5,854
|
|
|
$
|
186,464
|
|
|
$
|
66,321
|
|
|
$
|
1,587
|
|
|
$
|
260,226
|
|
|
|
|
|
|
|
|
|
|
|
|
|
|
|
|
|
|
|
|
|
|
|
|
Tax-equivalent Yield
|
|
|
|
|
|
|
|
|
|
|
|
|
|
|
|
|
|
|
|
|
|
U.S. Treasury and government agencies
|
|
|
5.02
|
%
|
|
|
2.17
|
%
|
|
|
2.31
|
%
|
|
|
-
|
%
|
|
|
2.21
|
%
|
|
Mortgage-backed securities
|
|
|
8.47
|
|
|
|
2.99
|
|
|
|
3.51
|
|
|
|
3.46
|
|
|
|
3.01
|
|
|
State and municipal securities
|
|
|
4.95
|
|
|
|
3.54
|
|
|
|
4.53
|
|
|
|
6.17
|
|
|
|
4.02
|
|
|
Corporate debt
|
|
|
-
|
|
|
|
1.33
|
|
|
|
1.17
|
|
|
|
-
|
|
|
|
1.27
|
|
|
Weighted average yield
|
|
|
5.07
|
%
|
|
|
3.01
|
%
|
|
|
3.91
|
%
|
|
|
5.33
|
%
|
|
|
3.30
|
%
|
|
|
|
|
|
|
|
|
|
|
|
|
|
|
|
|
|
|
|
|
|
|
|
Securities Held to Maturity:
|
|
|
|
|
|
|
|
|
|
|
|
|
|
|
|
|
|
|
|
|
|
Mortgage-backed securities
|
|
$
|
-
|
|
|
$
|
2,382
|
|
|
$
|
24,348
|
|
|
$
|
-
|
|
|
$
|
26,730
|
|
|
State and municipal securities
|
|
|
-
|
|
|
|
-
|
|
|
|
-
|
|
|
|
5,544
|
|
|
|
5,544
|
|
|
Total
|
|
$
|
-
|
|
|
$
|
2,382
|
|
|
$
|
24,348
|
|
|
$
|
5,544
|
|
|
$
|
32,274
|
|
|
|
|
|
|
|
|
|
|
|
|
|
|
|
|
|
|
|
|
|
|
|
|
Tax-equivalent Yield
|
|
|
|
|
|
|
|
|
|
|
|
|
|
|
|
|
|
|
|
|
|
Mortgage-backed securities
|
|
|
-
|
%
|
|
|
3.94
|
%
|
|
|
2.69
|
%
|
|
|
-
|
%
|
|
|
2.80
|
%
|
|
State and municipal securities
|
|
|
-
|
|
|
|
-
|
|
|
|
-
|
|
|
|
6.27
|
|
|
|
6.27
|
|
|
Weighted average yield
|
|
|
-
|
%
|
|
|
3.94
|
%
|
|
|
2.69
|
%
|
|
|
6.27
|
%
|
|
|
3.40
|
%
|
|
|
|
Percentage of
Total Loans in MSA |
|
|
Birmingham-Hoover, AL MSA
|
|
50
|
%
|
|
Huntsville, AL MSA
|
|
15
|
%
|
|
Montgomery, AL MSA
|
|
10
|
%
|
|
Dothan, AL MSA
|
|
13
|
%
|
|
Mobile, AL MSA
|
|
3
|
%
|
|
Total Alabama MSAs
|
|
91
|
%
|
|
Pensacola, FL MSA
|
|
8
|
%
|
|
Nashville, TN MSA
|
|
1
|
%
|
| 54 | ||
|
|
|
2013
|
|
2012
|
|
2011
|
|
2010
|
|
2009
|
|
|||||
|
|
|
(Dollars in Thousands)
|
|
|||||||||||||
|
Commercial, financial and agricultural
|
|
$
|
1,278,649
|
|
$
|
1,030,990
|
|
$
|
799,464
|
|
$
|
536,620
|
|
$
|
461,088
|
|
|
Real estate - construction
|
|
|
151,868
|
|
|
158,361
|
|
|
151,218
|
|
|
172,055
|
|
|
224,178
|
|
|
Real estate - mortgage:
|
|
|
|
|
|
|
|
|
|
|
|
|
|
|
|
|
|
Owner-occupied commercial
|
|
|
710,372
|
|
|
568,041
|
|
|
398,601
|
|
|
270,767
|
|
|
203,983
|
|
|
1-4 family mortgage
|
|
|
278,621
|
|
|
235,909
|
|
|
205,182
|
|
|
199,236
|
|
|
165,512
|
|
|
Other mortgage
|
|
|
391,396
|
|
|
323,599
|
|
|
235,251
|
|
|
178,793
|
|
|
119,749
|
|
|
Total real estate - mortgage
|
|
|
1,380,389
|
|
|
1,127,549
|
|
|
839,034
|
|
|
648,796
|
|
|
489,244
|
|
|
Consumer
|
|
|
47,962
|
|
|
46,282
|
|
|
41,026
|
|
|
37,347
|
|
|
32,574
|
|
|
Total Loans
|
|
|
2,858,868
|
|
|
2,363,182
|
|
|
1,830,742
|
|
|
1,394,818
|
|
|
1,207,084
|
|
|
Less: Allowance for loan losses
|
|
|
(30,663)
|
|
|
(26,258)
|
|
|
(22,030)
|
|
|
(18,077)
|
|
|
(14,737)
|
|
|
Net Loans
|
|
$
|
2,828,205
|
|
$
|
2,336,924
|
|
$
|
1,808,712
|
|
$
|
1,376,741
|
|
$
|
1,192,347
|
|
|
|
|
2013
|
|
2012
|
|
2011
|
|
2010
|
|
2009
|
|
|
Commercial, financial and agricultural
|
|
44.73
|
%
|
43.63
|
%
|
43.67
|
%
|
38.47
|
%
|
38.20
|
%
|
|
Real estate - construction
|
|
5.31
|
|
6.70
|
|
8.26
|
|
12.34
|
|
18.57
|
|
|
Real estate - mortgage:
|
|
|
|
|
|
|
|
|
|
|
|
|
Owner-occupied commercial
|
|
24.85
|
|
24.04
|
|
21.77
|
|
19.41
|
|
16.90
|
|
|
1-4 family mortgage
|
|
9.74
|
|
9.98
|
|
11.21
|
|
14.28
|
|
13.71
|
|
|
Other mortgage
|
|
13.69
|
|
13.69
|
|
12.85
|
|
12.82
|
|
9.92
|
|
|
Total real estate - mortgage
|
|
48.28
|
|
47.71
|
|
45.83
|
|
46.51
|
|
40.53
|
|
|
Consumer
|
|
1.68
|
|
1.96
|
|
2.24
|
|
2.68
|
|
2.70
|
|
|
Total Loans
|
|
100.00
|
%
|
100.00
|
%
|
100.00
|
%
|
100.00
|
%
|
100.00
|
%
|
|
|
|
Due in 1
|
|
Due in 1 to 5
|
|
Due after 5
|
|
|
|
|
|||
|
|
|
year or less
|
|
years
|
|
years
|
|
Total
|
|
||||
|
|
|
(in Thousands)
|
|
||||||||||
|
Commercial, financial and agricultural
|
|
$
|
717,845
|
|
$
|
482,849
|
|
$
|
77,955
|
|
$
|
1,278,649
|
|
|
Real estate - construction
|
|
|
81,886
|
|
|
56,776
|
|
|
13,206
|
|
|
151,868
|
|
|
Real estate - mortgage:
|
|
|
|
|
|
|
|
|
|
|
|
|
|
|
Owner-occupied commercial
|
|
|
71,785
|
|
|
405,715
|
|
|
232,872
|
|
|
710,372
|
|
|
1-4 family mortgage
|
|
|
42,147
|
|
|
204,955
|
|
|
31,519
|
|
|
278,621
|
|
|
Other mortgage
|
|
|
75,648
|
|
|
261,341
|
|
|
54,407
|
|
|
391,396
|
|
|
Total Real estate - mortgage
|
|
|
189,580
|
|
|
872,011
|
|
|
318,798
|
|
|
1,380,389
|
|
|
Consumer
|
|
|
33,369
|
|
|
13,996
|
|
|
597
|
|
|
47,962
|
|
|
Total Loans
|
|
$
|
1,022,680
|
|
$
|
1,425,632
|
|
$
|
410,556
|
|
$
|
2,858,868
|
|
|
Less: Allowance for loan losses
|
|
|
|
|
|
|
|
|
|
|
|
(30,663)
|
|
|
Net Loans
|
|
|
|
|
|
|
|
|
|
|
$
|
2,828,205
|
|
|
|
|
|
|
|
|
|
|
|
|
|
|
|
|
|
Interest rate sensitivity:
|
|
|
|
|
|
|
|
|
|
|
|
|
|
|
Fixed interest rates
|
|
$
|
197,627
|
|
$
|
933,986
|
|
$
|
263,538
|
|
$
|
1,395,151
|
|
|
Floating or adjustable rates
|
|
|
825,053
|
|
|
491,646
|
|
|
147,018
|
|
|
1,463,717
|
|
|
Total
|
|
$
|
1,022,680
|
|
$
|
1,425,632
|
|
$
|
410,556
|
|
$
|
2,858,868
|
|
| 55 | ||
|
Analysis of the Allowance for Loan Losses
|
|
|||||||||||||||||||
|
|
|
2013
|
|
|
2012
|
|
|
2011
|
|
|
2010
|
|
|
2009
|
|
|||||
|
|
|
(Dollars in Thousands)
|
|
|||||||||||||||||
|
Allowance for loan losses:
|
|
|
|
|
|
|
|
|
|
|
|
|
|
|
|
|
|
|
|
|
|
Beginning of year
|
|
$
|
26,258
|
|
|
$
|
22,030
|
|
|
$
|
18,077
|
|
|
$
|
14,737
|
|
|
$
|
10,602
|
|
|
Charge-offs:
|
|
|
|
|
|
|
|
|
|
|
|
|
|
|
|
|
|
|
|
|
|
Commercial, financial and agricultural
|
|
|
(1,932)
|
|
|
|
(1,106)
|
|
|
|
(1,096)
|
|
|
|
(1,667)
|
|
|
|
(2,616)
|
|
|
Real estate - construction
|
|
|
(4,829)
|
|
|
|
(3,088)
|
|
|
|
(2,594)
|
|
|
|
(3,488)
|
|
|
|
(3,322)
|
|
|
Real estate - mortgage:
|
|
|
|
|
|
|
|
|
|
|
|
|
|
|
|
|
|
|
|
|
|
Owner occupied commercial
|
|
|
(1,100)
|
|
|
|
(250)
|
|
|
|
-
|
|
|
|
(548)
|
|
|
|
-
|
|
|
1-4 family mortgage
|
|
|
(941)
|
|
|
|
(311)
|
|
|
|
(1,096)
|
|
|
|
(1,227)
|
|
|
|
(522)
|
|
|
Other mortgage
|
|
|
-
|
|
|
|
(99)
|
|
|
|
-
|
|
|
|
-
|
|
|
|
(9)
|
|
|
Total real estate mortgage
|
|
|
(2,041)
|
|
|
|
(660)
|
|
|
|
(1,096)
|
|
|
|
(1,775)
|
|
|
|
(531)
|
|
|
Consumer
|
|
|
(210)
|
|
|
|
(901)
|
|
|
|
(867)
|
|
|
|
(278)
|
|
|
|
(207)
|
|
|
Total charge-offs
|
|
|
(9,012)
|
|
|
|
(5,755)
|
|
|
|
(5,653)
|
|
|
|
(7,208)
|
|
|
|
(6,676)
|
|
|
Recoveries:
|
|
|
|
|
|
|
|
|
|
|
|
|
|
|
|
|
|
|
|
|
|
Commercial, financial and agricultural
|
|
|
66
|
|
|
|
125
|
|
|
|
361
|
|
|
|
97
|
|
|
|
-
|
|
|
Real estate - construction
|
|
|
296
|
|
|
|
58
|
|
|
|
180
|
|
|
|
53
|
|
|
|
108
|
|
|
Real estate - mortgage:
|
|
|
|
|
|
|
|
|
|
|
|
|
|
|
|
|
|
|
|
|
|
Owner occupied commercial
|
|
|
32
|
|
|
|
-
|
|
|
|
12
|
|
|
|
12
|
|
|
|
-
|
|
|
1-4 family mortgage
|
|
|
4
|
|
|
|
692
|
|
|
|
-
|
|
|
|
20
|
|
|
|
3
|
|
|
Other mortgage
|
|
|
-
|
|
|
|
-
|
|
|
|
-
|
|
|
|
-
|
|
|
|
-
|
|
|
Total real estate mortgage
|
|
|
36
|
|
|
|
692
|
|
|
|
12
|
|
|
|
32
|
|
|
|
3
|
|
|
Consumer
|
|
|
11
|
|
|
|
8
|
|
|
|
81
|
|
|
|
16
|
|
|
|
15
|
|
|
Total recoveries
|
|
|
409
|
|
|
|
883
|
|
|
|
634
|
|
|
|
198
|
|
|
|
126
|
|
|
|
|
|
|
|
|
|
|
|
|
|
|
|
|
|
|
|
|
|
|
|
|
Net charge-offs
|
|
|
(8,603)
|
|
|
|
(4,872)
|
|
|
|
(5,019)
|
|
|
|
(7,010)
|
|
|
|
(6,550)
|
|
|
|
|
|
|
|
|
|
|
|
|
|
|
|
|
|
|
|
|
|
|
|
|
Provision for loan losses charged to expense
|
|
|
13,008
|
|
|
|
9,100
|
|
|
|
8,972
|
|
|
|
10,350
|
|
|
|
10,685
|
|
|
|
|
|
|
|
|
|
|
|
|
|
|
|
|
|
|
|
|
|
|
|
|
Allowance for loan losses at end of period
|
|
$
|
30,663
|
|
|
$
|
26,258
|
|
|
$
|
22,030
|
|
|
$
|
18,077
|
|
|
$
|
14,737
|
|
|
|
|
|
|
|
|
|
|
|
|
|
|
|
|
|
|
|
|
|
|
|
|
As a percent of year to date average loans:
|
|
|
|
|
|
|
|
|
|
|
|
|
|
|
|
|
|
|
|
|
|
Net charge-offs
|
|
|
0.33
|
%
|
|
|
0.24
|
%
|
|
|
0.32
|
%
|
|
|
0.55
|
%
|
|
|
0.60
|
%
|
|
Provision for loan losses
|
|
|
0.50
|
%
|
|
|
0.45
|
%
|
|
|
0.57
|
%
|
|
|
0.81
|
%
|
|
|
1.00
|
%
|
|
Allowance for loan losses as a percentage of:
|
|
|
|
|
|
|
|
|
|
|
|
|
|
|
|
|
|
|
|
|
|
Year-end loans
|
|
|
1.07
|
%
|
|
|
1.11
|
%
|
|
|
1.20
|
%
|
|
|
1.30
|
%
|
|
|
1.24
|
%
|
|
Nonperforming assets
|
|
|
135.70
|
%
|
|
|
130.77
|
%
|
|
|
84.48
|
%
|
|
|
84.82
|
%
|
|
|
60.34
|
%
|
| 56 | ||
|
|
|
For the Years Ended December 31,
|
|
|||||||||||||||||||||||||||
|
|
|
2013
|
|
|
2012
|
|
|
2011
|
|
|
2010
|
|
|
2009
|
|
|||||||||||||||
|
|
|
|
|
|
Percentage
|
|
|
|
|
|
Percentage
|
|
|
|
|
|
Percentage
|
|
|
|
|
|
Percentage
|
|
|
|
|
|
Percentage
|
|
|
|
|
|
|
|
of loans in
|
|
|
|
|
|
of loans in
|
|
|
|
|
|
of loans in
|
|
|
|
|
|
of loans in
|
|
|
|
|
|
of loans in
|
|
|
|
|
|
|
|
each
|
|
|
|
|
|
each
|
|
|
|
|
|
each
|
|
|
|
|
|
each
|
|
|
|
|
|
each
|
|
|
|
|
|
|
|
category to
|
|
|
|
|
|
category to
|
|
|
|
|
|
category to
|
|
|
|
|
|
category to
|
|
|
|
|
|
category to
|
|
|
|
|
Amount
|
|
total loans
|
|
|
Amount
|
|
total loans
|
|
|
Amount
|
|
total loans
|
|
|
Amount
|
|
total loans
|
|
|
Amount
|
|
total loans
|
|
|||||
|
|
|
(Dollars in Thousands)
|
|
|||||||||||||||||||||||||||
|
Commercial, financial and
agricultural |
|
$
|
11,170
|
|
44.73
|
%
|
|
$
|
8,233
|
|
43.63
|
%
|
|
$
|
6,627
|
|
43.67
|
%
|
|
$
|
5,348
|
|
38.47
|
%
|
|
$
|
3,135
|
|
38.20
|
%
|
|
Real estate -
|
|
|
|
|
|
|
|
|
|
|
|
|
|
|
|
|
|
|
|
|
|
|
|
|
|
|
|
|
|
|
|
construction
|
|
|
5,809
|
|
5.31
|
|
|
|
6,511
|
|
6.70
|
|
|
|
6,542
|
|
8.26
|
|
|
|
6,373
|
|
12.34
|
|
|
|
6,295
|
|
18.57
|
|
|
Real estate -
mortgage |
|
|
7,495
|
|
48.28
|
|
|
|
4,912
|
|
47.71
|
|
|
|
3,295
|
|
45.83
|
|
|
|
2,443
|
|
46.51
|
|
|
|
2,102
|
|
40.53
|
|
|
|
|
|
|
|
|
|
|
|
|
|
|
|
|
|
|
|
|
|
|
|
|
|
|
|
|
|
|
|
|
|
|
Consumer
|
|
|
855
|
|
1.68
|
|
|
|
199
|
|
1.96
|
|
|
|
531
|
|
2.24
|
|
|
|
749
|
|
2.68
|
|
|
|
115
|
|
2.70
|
|
|
Qualitative factors
|
|
|
5,334
|
|
-
|
|
|
|
6,403
|
|
-
|
|
|
|
5,035
|
|
-
|
|
|
|
3,164
|
|
-
|
|
|
|
3,090
|
|
-
|
|
|
Total
|
|
$
|
30,663
|
|
100.00
|
%
|
|
$
|
26,258
|
|
100.00
|
%
|
|
$
|
22,030
|
|
100.00
|
%
|
|
$
|
18,077
|
|
100.00
|
%
|
|
$
|
14,737
|
|
100.00
|
%
|
| 57 | ||
| · | We closely monitor the past due and overdraft reports on a weekly basis to identify deterioration as early as possible and the placement of identified loans on the watch list. |
| · | We perform extensive monthly credit review for all watch list/classified loans, including formulation of aggressive workout or action plans. When a workout is not achievable, we move to collection/foreclosure proceedings to obtain control of the underlying collateral as rapidly as possible to minimize the deterioration of collateral and/or the loss of its value. |
| · | We require updated financial information, global inventory aging and interest carry analysis for existing builders to help identify potential future loan payment problems. |
| · | We generally limit loans for new construction to established builders and developers that have an established record of turning their inventories, and we restrict our funding of undeveloped lots and land. |
|
|
|
2013
|
|
2012
|
|
2011
|
|
2010
|
|
2009
|
|
||||||||||||||||||||
|
|
|
|
|
|
|
Number
|
|
|
|
|
|
Number
|
|
|
|
|
|
Number
|
|
|
|
|
|
Number
|
|
|
|
|
|
Number
|
|
|
|
|
Balance
|
|
|
of Loans
|
|
Balance
|
|
|
of Loans
|
|
Balance
|
|
|
of Loans
|
|
Balance
|
|
|
of Loans
|
|
Balance
|
|
|
of Loans
|
|
|||||
|
|
|
(Dollars in Thousands)
|
|
||||||||||||||||||||||||||||
|
Nonaccrual loans:
|
|
|
|
|
|
|
|
|
|
|
|
|
|
|
|
|
|
|
|
|
|
|
|
|
|
|
|
|
|
|
|
|
Commercial, financial
|
|
|
|
|
|
|
|
|
|
|
|
|
|
|
|
|
|
|
|
|
|
|
|
|
|
|
|
|
|
|
|
|
and agricultural
|
|
$
|
1,714
|
|
|
9
|
|
$
|
276
|
|
|
2
|
|
$
|
1,179
|
|
|
7
|
|
$
|
2,164
|
|
|
8
|
|
$
|
2,032
|
|
|
2
|
|
|
Real estate -
|
|
|
|
|
|
|
|
|
|
|
|
|
|
|
|
|
|
|
|
|
|
|
|
|
|
|
|
|
|
|
|
|
construction
|
|
|
3,749
|
|
|
14
|
|
|
6,460
|
|
|
19
|
|
|
10,063
|
|
|
21
|
|
|
10,722
|
|
|
24
|
|
|
8,100
|
|
|
13
|
|
|
Real estate - mortgage:
|
|
|
|
|
|
|
|
|
|
|
|
|
|
|
|
|
|
|
|
|
|
|
|
|
|
|
|
|
|
|
|
|
Owner-occupied
|
|
|
|
|
|
|
|
|
|
|
|
|
|
|
|
|
|
|
|
|
|
|
|
|
|
|
|
|
|
|
|
|
commercial
|
|
|
1,435
|
|
|
3
|
|
|
2,786
|
|
|
3
|
|
|
792
|
|
|
2
|
|
|
635
|
|
|
1
|
|
|
909
|
|
|
2
|
|
|
1-4 family mortgage
|
|
|
1,878
|
|
|
3
|
|
|
453
|
|
|
2
|
|
|
670
|
|
|
4
|
|
|
202
|
|
|
1
|
|
|
265
|
|
|
2
|
|
|
Other mortgage
|
|
|
243
|
|
|
1
|
|
|
240
|
|
|
1
|
|
|
693
|
|
|
1
|
|
|
-
|
|
|
-
|
|
|
615
|
|
|
1
|
|
|
Total real estate -
|
|
|
|
|
|
|
|
|
|
|
|
|
|
|
|
|
|
|
|
|
|
|
|
|
|
|
|
|
|
|
|
|
mortgage
|
|
|
3,556
|
|
|
7
|
|
|
3,479
|
|
|
6
|
|
|
2,155
|
|
|
7
|
|
|
837
|
|
|
2
|
|
|
1,789
|
|
|
5
|
|
|
Consumer
|
|
|
602
|
|
|
4
|
|
|
135
|
|
|
2
|
|
|
375
|
|
|
1
|
|
|
624
|
|
|
1
|
|
|
-
|
|
|
-
|
|
|
Total nonaccrual loans
|
|
$
|
9,621
|
|
|
34
|
|
$
|
10,350
|
|
|
29
|
|
$
|
13,772
|
|
|
36
|
|
$
|
14,347
|
|
|
35
|
|
$
|
11,921
|
|
|
20
|
|
|
|
|
|
|
|
|
|
|
|
|
|
|
|
|
|
|
|
|
|
|
|
|
|
|
|
|
|
|
|
|
|
|
|
90+ days past due
|
|
|
|
|
|
|
|
|
|
|
|
|
|
|
|
|
|
|
|
|
|
|
|
|
|
|
|
|
|
|
|
|
and accruing:
|
|
|
|
|
|
|
|
|
|
|
|
|
|
|
|
|
|
|
|
|
|
|
|
|
|
|
|
|
|
|
|
|
Commercial, financial
|
|
|
|
|
|
|
|
|
|
|
|
|
|
|
|
|
|
|
|
|
|
|
|
|
|
|
|
|
|
|
|
|
and agricultural
|
|
$
|
-
|
|
|
-
|
|
$
|
-
|
|
|
-
|
|
$
|
-
|
|
|
-
|
|
$
|
-
|
|
|
-
|
|
$
|
14
|
|
|
1
|
|
|
Real estate -
|
|
|
|
|
|
|
|
|
|
|
|
|
|
|
|
|
|
|
|
|
|
|
|
|
|
|
|
|
|
|
|
|
construction
|
|
|
-
|
|
|
-
|
|
|
-
|
|
|
-
|
|
|
-
|
|
|
-
|
|
|
-
|
|
|
-
|
|
|
-
|
|
|
-
|
|
|
Real estate - mortgage:
|
|
|
|
|
|
|
|
|
|
|
|
|
|
|
|
|
|
|
|
|
|
|
|
|
|
|
|
|
|
|
|
|
Owner-occupied
|
|
|
|
|
|
|
|
|
|
|
|
|
|
|
|
|
|
|
|
|
|
|
|
|
|
|
|
|
|
|
|
|
commercial
|
|
|
-
|
|
|
-
|
|
|
-
|
|
|
-
|
|
|
-
|
|
|
-
|
|
|
-
|
|
|
-
|
|
|
-
|
|
|
-
|
|
|
1-4 family mortgage
|
|
|
19
|
|
|
1
|
|
|
-
|
|
|
-
|
|
|
-
|
|
|
-
|
|
|
-
|
|
|
-
|
|
|
253
|
|
|
1
|
|
|
Other mortgage
|
|
|
-
|
|
|
-
|
|
|
-
|
|
|
-
|
|
|
-
|
|
|
-
|
|
|
-
|
|
|
-
|
|
|
-
|
|
|
-
|
|
|
Total real estate
|
|
|
|
|
|
|
|
|
|
|
|
|
|
|
|
|
|
|
|
|
|
|
|
|
|
|
|
|
|
|
|
|
mortgage
|
|
|
19
|
|
|
1
|
|
|
-
|
|
|
-
|
|
|
-
|
|
|
-
|
|
|
-
|
|
|
-
|
|
|
253
|
|
|
1
|
|
|
Consumer
|
|
|
96
|
|
|
1
|
|
|
8
|
|
|
4
|
|
|
-
|
|
|
-
|
|
|
-
|
|
|
-
|
|
|
-
|
|
|
-
|
|
|
Total 90+ days past due
|
|
|
|
|
|
|
|
|
|
|
|
|
|
|
|
|
|
|
|
|
|
|
|
|
|
|
|
|
|
|
|
|
and accruing
|
|
$
|
115
|
|
|
2
|
|
$
|
8
|
|
|
4
|
|
$
|
-
|
|
|
-
|
|
$
|
-
|
|
|
-
|
|
$
|
267
|
|
|
2
|
|
|
Total nonperforming
|
|
|
|
|
|
|
|
|
|
|
|
|
|
|
|
|
|
|
|
|
|
|
|
|
|
|
|
|
|
|
|
|
loans
|
|
$
|
9,736
|
|
|
36
|
|
$
|
10,358
|
|
|
33
|
|
$
|
13,772
|
|
|
36
|
|
$
|
14,347
|
|
|
35
|
|
$
|
12,188
|
|
|
22
|
|
|
Plus: Other real estate
|
|
|
|
|
|
|
|
|
|
|
|
|
|
|
|
|
|
|
|
|
|
|
|
|
|
|
|
|
|
|
|
|
owned and repossessions
|
|
|
12,861
|
|
|
51
|
|
|
9,721
|
|
|
38
|
|
|
12,305
|
|
|
39
|
|
|
6,966
|
|
|
39
|
|
|
12,525
|
|
|
51
|
|
|
Total nonperforming
|
|
|
|
|
|
|
|
|
|
|
|
|
|
|
|
|
|
|
|
|
|
|
|
|
|
|
|
|
|
|
|
|
assets
|
|
$
|
22,597
|
|
|
87
|
|
$
|
20,079
|
|
|
71
|
|
$
|
26,077
|
|
|
75
|
|
$
|
21,313
|
|
|
74
|
|
$
|
24,713
|
|
|
73
|
|
|
|
|
|
|
|
|
|
|
|
|
|
|
|
|
|
|
|
|
|
|
|
|
|
|
|
|
|
|
|
|
|
|
|
Restructured accruing loans:
|
|
|
|
|
|
|
|
|
|
|
|
|
|
|
|
|
|
|
|
|
|
|
|
|
|
|
|
|
|
|
|
|
Commercial, financial
|
|
|
|
|
|
|
|
|
|
|
|
|
|
|
|
|
|
|
|
|
|
|
|
|
|
|
|
|
|
|
|
|
and agricultural
|
|
$
|
962
|
|
|
2
|
|
$
|
1,168
|
|
|
2
|
|
$
|
1,369
|
|
|
2
|
|
$
|
2,398
|
|
|
9
|
|
$
|
-
|
|
|
-
|
|
|
Real estate -
|
|
|
|
|
|
|
|
|
|
|
|
|
|
|
|
|
|
|
|
|
|
|
|
|
|
|
|
|
|
|
|
|
construction
|
|
|
217
|
|
|
1
|
|
|
3,213
|
|
|
15
|
|
|
-
|
|
|
-
|
|
|
-
|
|
|
-
|
|
|
-
|
|
|
-
|
|
|
Real estate - mortgage:
|
|
|
|
|
|
|
|
|
|
|
|
|
|
|
|
|
|
|
|
|
|
|
|
|
|
|
|
|
|
|
|
|
Owner-occupied
|
|
|
|
|
|
|
|
|
|
|
|
|
|
|
|
|
|
|
|
|
|
|
|
|
|
|
|
|
|
|
|
|
commercial
|
|
|
-
|
|
|
-
|
|
|
3,121
|
|
|
3
|
|
|
2,785
|
|
|
3
|
|
|
-
|
|
|
-
|
|
|
845
|
|
|
1
|
|
|
1-4 family mortgage
|
|
|
8,225
|
|
|
2
|
|
|
1,709
|
|
|
5
|
|
|
-
|
|
|
-
|
|
|
-
|
|
|
-
|
|
|
-
|
|
|
-
|
|
|
Other mortgage
|
|
|
285
|
|
|
1
|
|
|
302
|
|
|
1
|
|
|
331
|
|
|
1
|
|
|
-
|
|
|
-
|
|
|
-
|
|
|
-
|
|
|
Total real estate -
|
|
|
|
|
|
|
|
|
|
|
|
|
|
|
|
|
|
|
|
|
|
|
|
|
|
|
|
|
|
|
|
|
mortgage
|
|
|
8,510
|
|
|
3
|
|
|
5,132
|
|
|
9
|
|
|
3,116
|
|
|
4
|
|
|
-
|
|
|
-
|
|
|
845
|
|
|
1
|
|
|
Consumer
|
|
|
-
|
|
|
-
|
|
|
-
|
|
|
-
|
|
|
-
|
|
|
-
|
|
|
-
|
|
|
-
|
|
|
-
|
|
|
-
|
|
|
Total restructured
|
|
|
|
|
|
|
|
|
|
|
|
|
|
|
|
|
|
|
|
|
|
|
|
|
|
|
|
|
|
|
|
|
accruing loans
|
|
$
|
9,689
|
|
|
6
|
|
$
|
9,513
|
|
|
26
|
|
$
|
4,485
|
|
|
6
|
|
$
|
2,398
|
|
|
9
|
|
$
|
845
|
|
|
1
|
|
|
Total nonperforming
|
|
|
|
|
|
|
|
|
|
|
|
|
|
|
|
|
|
|
|
|
|
|
|
|
|
|
|
|
|
|
|
|
assets and restructured
|
|
|
|
|
|
|
|
|
|
|
|
|
|
|
|
|
|
|
|
|
|
|
|
|
|
|
|
|
|
|
|
|
accruing loans
|
|
$
|
32,286
|
|
|
93
|
|
$
|
29,592
|
|
|
97
|
|
$
|
30,562
|
|
|
81
|
|
$
|
23,711
|
|
|
83
|
|
$
|
25,558
|
|
|
74
|
|
|
|
|
|
|
|
|
|
|
|
|
|
|
|
|
|
|
|
|
|
|
|
|
|
|
|
|
|
|
|
|
|
|
|
Gross interest income
|
|
|
|
|
|
|
|
|
|
|
|
|
|
|
|
|
|
|
|
|
|
|
|
|
|
|
|
|
|
|
|
|
foregone on nonaccrual
|
|
|
|
|
|
|
|
|
|
|
|
|
|
|
|
|
|
|
|
|
|
|
|
|
|
|
|
|
|
|
|
|
loans througout year
|
|
$
|
972
|
|
|
|
|
$
|
850
|
|
|
|
|
$
|
1,371
|
|
|
|
|
$
|
510
|
|
|
|
|
$
|
647
|
|
|
|
|
|
Interest income
|
|
|
|
|
|
|
|
|
|
|
|
|
|
|
|
|
|
|
|
|
|
|
|
|
|
|
|
|
|
|
|
|
recognized on nonaccrual
|
|
|
|
|
|
|
|
|
|
|
|
|
|
|
|
|
|
|
|
|
|
|
|
|
|
|
|
|
|
|
|
|
loans througout year
|
|
$
|
433
|
|
|
|
|
$
|
155
|
|
|
|
|
$
|
263
|
|
|
|
|
$
|
418
|
|
|
|
|
$
|
310
|
|
|
|
|
|
|
|
|
|
|
|
|
|
|
|
|
|
|
|
|
|
|
|
|
|
|
|
|
|
|
|
|
|
|
|
|
|
|
Ratios:
|
|
|
|
|
|
|
|
|
|
|
|
|
|
|
|
|
|
|
|
|
|
|
|
|
|
|
|
|
|
|
|
|
Nonperforming loans
|
|
|
|
|
|
|
|
|
|
|
|
|
|
|
|
|
|
|
|
|
|
|
|
|
|
|
|
|
|
|
|
|
to total loans
|
|
|
0.34
|
%
|
|
|
|
|
0.44
|
%
|
|
|
|
|
0.75
|
%
|
|
|
|
|
1.03
|
%
|
|
|
|
|
1.01
|
%
|
|
|
|
|
Nonperforming assets to
|
|
|
|
|
|
|
|
|
|
|
|
|
|
|
|
|
|
|
|
|
|
|
|
|
|
|
|
|
|
|
|
|
total loans plus other
|
|
|
|
|
|
|
|
|
|
|
|
|
|
|
|
|
|
|
|
|
|
|
|
|
|
|
|
|
|
|
|
|
real estate owned
|
|
|
0.79
|
%
|
|
|
|
|
0.85
|
%
|
|
|
|
|
1.41
|
%
|
|
|
|
|
1.52
|
%
|
|
|
|
|
2.02
|
%
|
|
|
|
|
Nonperforming loans plus
|
|
|
|
|
|
|
|
|
|
|
|
|
|
|
|
|
|
|
|
|
|
|
|
|
|
|
|
|
|
|
|
|
restructured accruing
|
|
|
|
|
|
|
|
|
|
|
|
|
|
|
|
|
|
|
|
|
|
|
|
|
|
|
|
|
|
|
|
|
loans to total loans
|
|
|
|
|
|
|
|
|
|
|
|
|
|
|
|
|
|
|
|
|
|
|
|
|
|
|
|
|
|
|
|
|
plus other real estate
|
|
|
|
|
|
|
|
|
|
|
|
|
|
|
|
|
|
|
|
|
|
|
|
|
|
|
|
|
|
|
|
|
owned and repossessions
|
|
|
0.68
|
%
|
|
|
|
|
0.84
|
%
|
|
|
|
|
0.99
|
%
|
|
|
|
|
1.19
|
%
|
|
|
|
|
1.06
|
%
|
|
|
|
| 58 | ||
|
|
|
Average Deposits
|
|
|||||||||||||||
|
|
|
Average for Years Ended December 31,
|
|
|||||||||||||||
|
|
|
2013
|
|
|
2012
|
|
|
2011
|
|
|||||||||
|
|
|
Average
Balance |
|
Average Rate
Paid |
|
|
Average
Balance |
|
Average Rate
Paid |
|
|
Average
Balance |
|
Average Rate
Paid |
|
|||
|
Types of Deposits:
|
|
(Dollars in Thousands)
|
|
|||||||||||||||
|
Non-interest-bearing demand deposits
|
|
$
|
576,072
|
|
-
|
%
|
|
$
|
474,284
|
|
-
|
%
|
|
$
|
315,781
|
|
-
|
%
|
|
Interest-bearing demand deposits
|
|
|
433,931
|
|
0.28
|
%
|
|
|
351,975
|
|
0.31
|
%
|
|
|
303,165
|
|
0.37
|
%
|
|
Money market accounts
|
|
|
1,244,957
|
|
0.47
|
%
|
|
|
1,042,870
|
|
0.56
|
%
|
|
|
902,290
|
|
0.74
|
%
|
|
Savings accounts
|
|
|
21,793
|
|
0.28
|
%
|
|
|
17,081
|
|
0.28
|
%
|
|
|
10,088
|
|
0.47
|
%
|
|
Time deposits
|
|
|
69,247
|
|
1.01
|
%
|
|
|
69,906
|
|
1.24
|
%
|
|
|
65,484
|
|
1.44
|
%
|
|
Time deposits, $100,000 and over
|
|
|
335,680
|
|
1.13
|
%
|
|
|
328,646
|
|
1.35
|
%
|
|
|
264,737
|
|
1.60
|
%
|
|
Total deposits
|
|
$
|
2,681,680
|
|
|
|
|
$
|
2,284,762
|
|
|
|
|
$
|
1,861,545
|
|
|
|
|
At December 31, 2013
|
|
$100,000 or more
|
|
Less than $100,000
|
|
Total
|
|
|||
|
Maturity
|
|
(In Thousands)
|
|
|
|
|
|
|
|
|
|
Three months or less
|
|
$
|
56,566
|
|
$
|
15,105
|
|
$
|
71,671
|
|
|
Over three through six months
|
|
|
62,916
|
|
|
12,863
|
|
|
75,779
|
|
|
Over six months through one year
|
|
|
90,609
|
|
|
22,429
|
|
|
113,038
|
|
|
Over one year
|
|
|
134,214
|
|
|
19,918
|
|
|
154,132
|
|
|
Total
|
|
$
|
344,305
|
|
$
|
70,315
|
|
$
|
414,620
|
|
|
At December 31, 2012
|
|
$100,000 or more
|
|
Less than $100,000
|
|
Total
|
|
|||
|
Maturity
|
|
(In Thousands)
|
|
|
|
|
|
|
|
|
|
Three months or less
|
|
$
|
81,299
|
|
$
|
20,910
|
|
$
|
102,209
|
|
|
Over three through six months
|
|
|
33,712
|
|
|
9,351
|
|
|
43,063
|
|
|
Over six months through one year
|
|
|
89,215
|
|
|
17,236
|
|
|
106,451
|
|
|
Over one year
|
|
|
122,275
|
|
|
21,682
|
|
|
143,957
|
|
|
Total
|
|
$
|
326,501
|
|
$
|
69,179
|
|
$
|
395,680
|
|
| 59 | ||
| 60 | ||
|
|
|
2013
|
|
2012
|
|
2011
|
|
|||
|
|
|
(In Thousands)
|
|
|||||||
|
Commitments to extend credit
|
|
$
|
1,052,902
|
|
$
|
860,421
|
|
$
|
697,939
|
|
|
Credit card arrangements
|
|
|
38,122
|
|
|
25,699
|
|
|
19,686
|
|
|
Standby letters of credit and financial guarantees
|
|
|
40,371
|
|
|
36,374
|
|
|
42,937
|
|
|
Total
|
|
$
|
1,131,395
|
|
$
|
922,494
|
|
$
|
760,562
|
|
| 61 | ||
|
|
|
Payments due by Period
|
|
|||||||||||||
|
|
|
|
|
|
|
|
|
Over 1 - 3
|
|
Over 3 - 5
|
|
|
|
|
||
|
|
|
Total
|
|
1 year or less
|
|
years
|
|
years
|
|
Over 5 years
|
|
|||||
|
|
|
(In Thousands)
|
|
|||||||||||||
|
Contractual Obligations (1)
|
|
|
|
|
|
|
|
|
|
|
|
|
|
|
|
|
|
|
|
|
|
|
|
|
|
|
|
|
|
|
|
|
|
|
|
Deposits without a stated maturity
|
|
$
|
2,605,022
|
|
$
|
-
|
|
$
|
-
|
|
$
|
-
|
|
$
|
-
|
|
|
Certificates of deposit (2)
|
|
|
414,620
|
|
|
260,489
|
|
|
106,796
|
|
|
47,335
|
|
|
-
|
|
|
Federal funds purchased
|
|
|
174,380
|
|
|
174,380
|
|
|
-
|
|
|
-
|
|
|
-
|
|
|
Other borrowings
|
|
|
19,940
|
|
|
-
|
|
|
-
|
|
|
-
|
|
|
19,940
|
|
|
Operating lease commitments
|
|
|
16,064
|
|
|
2,453
|
|
|
4,891
|
|
|
4,098
|
|
|
4,622
|
|
|
Total
|
|
$
|
3,230,026
|
|
$
|
437,322
|
|
$
|
111,687
|
|
$
|
51,433
|
|
$
|
24,562
|
|
| 62 | ||
|
|
|
Well-
Capitalized |
|
Actual at
December 31, 2013 |
|
|
Total risk-based capital
|
|
10.00
|
%
|
11.73
|
%
|
|
Tier 1 capital
|
|
6.00
|
%
|
10.00
|
%
|
|
Leverage ratio
|
|
5.00
|
%
|
8.48
|
%
|
| 63 | ||
|
|
|
Rate Sensitive Gap Analysis
|
|
|
|
|
|
|
|
|
|
|||||||||
|
|
|
1-3 Months
|
|
|
4-12 Months
|
|
|
1-5 Years
|
|
|
Over 5 Years
|
|
|
Total
|
|
|||||
|
|
|
(Dollars in Thousands)
|
|
|||||||||||||||||
|
Interest-earning assets:
|
|
|
|
|
|
|
|
|
|
|
|
|
|
|
|
|
|
|
|
|
|
Loans, including mortgages
|
|
|
|
|
|
|
|
|
|
|
|
|
|
|
|
|
|
|
|
|
|
held for sale
|
|
$
|
1,589,067
|
|
|
$
|
318,304
|
|
|
$
|
849,949
|
|
|
$
|
109,682
|
|
|
$
|
2,867,002
|
|
|
Securities
|
|
|
28,893
|
|
|
|
23,324
|
|
|
|
174,084
|
|
|
|
75,931
|
|
|
|
302,232
|
|
|
Federal funds sold
|
|
|
8,634
|
|
|
|
-
|
|
|
|
-
|
|
|
|
-
|
|
|
|
8,634
|
|
|
Interest bearing balances
|
|
|
|
|
|
|
|
|
|
|
|
|
|
|
|
|
|
|
|
|
|
with banks
|
|
|
186,206
|
|
|
|
1,715
|
|
|
|
490
|
|
|
|
-
|
|
|
|
188,411
|
|
|
Total interest-earning assets
|
|
$
|
1,812,800
|
|
|
$
|
343,343
|
|
|
$
|
1,024,523
|
|
|
$
|
185,613
|
|
|
$
|
3,366,279
|
|
|
|
|
|
|
|
|
|
|
|
|
|
|
|
|
|
|
|
|
|
|
|
|
Interest-bearing liabilities:
|
|
|
|
|
|
|
|
|
|
|
|
|
|
|
|
|
|
|
|
|
|
Deposits:
|
|
|
|
|
|
|
|
|
|
|
|
|
|
|
|
|
|
|
|
|
|
Interest-bearing checking
|
|
$
|
500,128
|
|
|
$
|
-
|
|
|
$
|
-
|
|
|
$
|
-
|
|
|
$
|
500,128
|
|
|
Money market and savings
|
|
|
1,454,438
|
|
|
|
-
|
|
|
|
-
|
|
|
|
-
|
|
|
|
1,454,438
|
|
|
Time deposits
|
|
|
71,671
|
|
|
|
188,817
|
|
|
|
154,140
|
|
|
|
(8)
|
|
|
|
414,620
|
|
|
Federal funds purchased
|
|
|
174,380
|
|
|
|
-
|
|
|
|
-
|
|
|
|
-
|
|
|
|
174,380
|
|
|
Other borrowings
|
|
|
-
|
|
|
|
-
|
|
|
|
-
|
|
|
|
19,940
|
|
|
|
19,940
|
|
|
Total interest-bearing liabilities
|
|
|
2,200,617
|
|
|
|
188,817
|
|
|
|
154,140
|
|
|
|
19,932
|
|
|
|
2,563,506
|
|
|
Interest sensitivity gap
|
|
$
|
(387,817)
|
|
|
$
|
154,526
|
|
|
$
|
870,383
|
|
|
$
|
165,681
|
|
|
$
|
802,773
|
|
|
Cumulative sensitivity gap
|
|
$
|
(387,817)
|
|
|
$
|
(233,291)
|
|
|
$
|
637,092
|
|
|
$
|
802,773
|
|
|
$
|
-
|
|
|
Percent of cumulative sensitivity Gap
|
|
|
|
|
|
|
|
|
|
|
|
|
|
|
|
|
|
|
|
|
|
to total interest-earning assets
|
|
|
(11.5)
|
%
|
|
|
(6.9)
|
%
|
|
|
18.9
|
%
|
|
|
23.8
|
%
|
|
|
|
|
| 64 | ||
|
|
|
0 bps
|
|
+100 bps
|
|
|
+200 bps
|
|
|||
|
|
|
(Dollars in Thousands)
|
|
||||||||
|
Economic value of equity
|
|
$
|
297,192
|
|
$
|
297,341
|
|
|
$
|
298,054
|
|
|
|
|
|
|
|
|
|
|
|
|
|
|
|
Actual dollar change
|
|
|
|
|
$
|
149
|
|
|
$
|
862
|
|
|
|
|
|
|
|
|
|
|
|
|
|
|
|
Percent change
|
|
|
|
|
|
0.05
|
%
|
|
|
0.29
|
%
|
| 65 | ||
|
|
Page
|
|
Report of Independent Registered Public Accounting Firm on Consolidated Financial Statements
|
66
|
|
Report of Management on Internal Control over Financial Reporting
|
67
|
|
Report of Independent Registered Public Accounting Firm on Internal Control over Financial Reporting
|
68
|
|
Consolidated Balance Sheets at December 31, 2013 and 2012
|
69
|
|
Consolidated Statements of Income for the Years Ended December 31, 2013, 2012 and 2011
|
70
|
|
Consolidated Statements of Comprehensive Income for the Years Ended December 31, 2013, 2012 and 2011
|
71
|
|
Consolidated Statements of Stockholders' Equity for the Years Ended December 31, 2013, 2012 and 2011
|
72
|
|
Consolidated Statements of Cash Flows for the Years Ended December 31, 2013, 2012 and 2011
|
73
|
|
Notes to Consolidated Financial Statements
|
74
|
| 66 | ||
|
/s/ KPMG LLP
|
|
|
|
|
|
Birmingham, Alabama
|
|
|
March 7, 2014
|
|
| 67 | ||
|
|
|
|
SERVISFIRST BANCSHARES, INC.
|
|
|
|
|
|
|
|
by
|
|
/s/THOMAS A. BROUGHTON, III
|
|
|
|
|
THOMAS A. BROUGHTON, III
|
|
|
|
|
President and Chief Executive Officer
|
|
|
|
|
|
|
|
by
|
|
/s/WILLIAM M. FOSHEE
|
|
|
|
|
WILLIAM M. FOSHEE
|
|
|
|
|
Chief Financial Officer
|
| 68 | ||
|
/s/ KPMG LLP
|
|
|
|
|
|
Birmingham, Alabama
|
|
|
March 7, 2014
|
|
| 69 | ||
|
SERVISFIRST BANCSHARES, INC. AND SUBSIDIARIES
|
|
||||||
|
CONSOLIDATED BALANCE SHEETS
|
|
||||||
|
(In thousands, except share and per share amounts)
|
|
||||||
|
|
|
|
|
|
|
|
|
|
|
|
December 31, 2013
|
|
December 31, 2012
|
|
||
|
|
|
|
|
||||
|
ASSETS
|
|
|
|
|
|
|
|
|
Cash and due from banks
|
|
$
|
61,370
|
|
$
|
58,031
|
|
|
Interest-bearing balances due from depository institutions
|
|
|
188,411
|
|
|
119,423
|
|
|
Federal funds sold
|
|
|
8,634
|
|
|
3,291
|
|
|
Cash and cash equivalents
|
|
|
258,415
|
|
|
180,745
|
|
|
Available for sale debt securities, at fair value
|
|
|
266,220
|
|
|
233,877
|
|
|
Held to maturity debt securities (fair value of $31,315 and $27,350 at
|
|
|
|
|
|
|
|
|
December 31, 2013 and 2012, respectively)
|
|
|
32,274
|
|
|
25,967
|
|
|
Restricted equity securities
|
|
|
3,738
|
|
|
3,941
|
|
|
Mortgage loans held for sale
|
|
|
8,134
|
|
|
25,826
|
|
|
Loans
|
|
|
2,858,868
|
|
|
2,363,182
|
|
|
Less allowance for loan losses
|
|
|
(30,663)
|
|
|
(26,258)
|
|
|
Loans, net
|
|
|
2,828,205
|
|
|
2,336,924
|
|
|
Premises and equipment, net
|
|
|
8,351
|
|
|
8,847
|
|
|
Accrued interest and dividends receivable
|
|
|
10,262
|
|
|
9,158
|
|
|
Deferred tax asset, net
|
|
|
11,018
|
|
|
7,386
|
|
|
Other real estate owned
|
|
|
12,861
|
|
|
9,685
|
|
|
Bank owned life insurance contracts
|
|
|
69,008
|
|
|
57,014
|
|
|
Other assets
|
|
|
12,213
|
|
|
6,944
|
|
|
Total assets
|
|
$
|
3,520,699
|
|
$
|
2,906,314
|
|
|
LIABILITIES AND STOCKHOLDERS' EQUITY
|
|
|
|
|
|
|
|
|
Liabilities:
|
|
|
|
|
|
|
|
|
Deposits:
|
|
|
|
|
|
|
|
|
Noninterest-bearing
|
|
$
|
650,456
|
|
$
|
545,174
|
|
|
Interest-bearing
|
|
|
2,369,186
|
|
|
1,966,398
|
|
|
Total deposits
|
|
|
3,019,642
|
|
|
2,511,572
|
|
|
Federal funds purchased
|
|
|
174,380
|
|
|
117,065
|
|
|
Other borrowings
|
|
|
19,940
|
|
|
19,917
|
|
|
Subordinated debentures
|
|
|
-
|
|
|
15,050
|
|
|
Accrued interest payable
|
|
|
769
|
|
|
942
|
|
|
Other liabilities
|
|
|
8,776
|
|
|
8,511
|
|
|
Total liabilities
|
|
|
3,223,507
|
|
|
2,673,057
|
|
|
Stockholders' equity:
|
|
|
|
|
|
|
|
|
Preferred stock, Series A Senior Non-Cumulative Perpetual, par value $0.001
|
|
|
|
|
|
|
|
|
(liquidation preference $1,000), net of discount; 40,000 shares authorized,
|
|
|
|
|
|
|
|
|
40,000 shares issued and outstanding at December 31, 2013 and at
|
|
|
|
|
|
|
|
|
December 31, 2012
|
|
|
39,958
|
|
|
39,958
|
|
|
Preferred stock, par value $0.001 per share; 1,000,000 authorized and
|
|
|
|
|
|
|
|
|
960,000 currently undesignated
|
|
|
-
|
|
|
-
|
|
|
Common stock, par value $0.001 per share; 50,000,000 shares authorized;
|
|
|
|
|
|
|
|
|
7,350,012 shares issued and outstanding at December 31, 2013 and
|
|
|
|
|
|
|
|
|
6,268,812 shares issued and outstanding at December 31, 2012
|
|
|
7
|
|
|
6
|
|
|
Additional paid-in capital
|
|
|
123,325
|
|
|
93,505
|
|
|
Retained earnings
|
|
|
130,011
|
|
|
92,492
|
|
|
Accumulated other comprehensive income
|
|
|
3,891
|
|
|
7,296
|
|
|
Total stockholders' equity
|
|
|
297,192
|
|
|
233,257
|
|
|
Total liabilities and stockholders' equity
|
|
$
|
3,520,699
|
|
$
|
2,906,314
|
|
| 70 | ||
|
SERVISFIRST BANCSHARES, INC. AND SUBSIDIARIES
|
|
||||||||
|
CONSOLIDATED STATEMENTS OF INCOME
|
|
||||||||
|
(In thousands, except per share amounts)
|
|
||||||||
|
|
|
|
|
|
|
|
|
|
|
|
|
Year Ended December 31,
|
|
|||||||
|
|
2013
|
|
2012
|
|
2011
|
|
|||
|
Interest income:
|
|
|
|
|
|
|
|
|
|
|
Interest and fees on loans
|
$
|
118,285
|
|
$
|
100,462
|
|
$
|
82,294
|
|
|
Taxable securities
|
|
3,888
|
|
|
4,814
|
|
|
5,721
|
|
|
Nontaxable securities
|
|
3,407
|
|
|
3,246
|
|
|
2,943
|
|
|
Federal funds sold
|
|
128
|
|
|
196
|
|
|
176
|
|
|
Other interest and dividends
|
|
373
|
|
|
305
|
|
|
277
|
|
|
Total interest income
|
|
126,081
|
|
|
109,023
|
|
|
91,411
|
|
|
Interest expense:
|
|
|
|
|
|
|
|
|
|
|
Deposits
|
|
11,830
|
|
|
12,249
|
|
|
13,047
|
|
|
Borrowed funds
|
|
1,789
|
|
|
2,652
|
|
|
3,033
|
|
|
Total interest expense
|
|
13,619
|
|
|
14,901
|
|
|
16,080
|
|
|
Net interest income
|
|
112,462
|
|
|
94,122
|
|
|
75,331
|
|
|
Provision for loan losses
|
|
13,008
|
|
|
9,100
|
|
|
8,972
|
|
|
Net interest income after provision for loan losses
|
|
99,454
|
|
|
85,022
|
|
|
66,359
|
|
|
Noninterest income:
|
|
|
|
|
|
|
|
|
|
|
Service charges on deposit accounts
|
|
3,228
|
|
|
2,756
|
|
|
2,290
|
|
|
Mortgage banking
|
|
2,513
|
|
|
3,560
|
|
|
2,373
|
|
|
Securities gains
|
|
131
|
|
|
-
|
|
|
666
|
|
|
Increase in cash surrender value life insurance
|
|
1,994
|
|
|
1,624
|
|
|
390
|
|
|
Other operating income
|
|
2,144
|
|
|
1,703
|
|
|
1,207
|
|
|
Total noninterest income
|
|
10,010
|
|
|
9,643
|
|
|
6,926
|
|
|
Noninterest expenses:
|
|
|
|
|
|
|
|
|
|
|
Salaries and employee benefits
|
|
26,324
|
|
|
22,587
|
|
|
19,518
|
|
|
Equipment and occupancy expense
|
|
5,202
|
|
|
4,014
|
|
|
3,697
|
|
|
Professional services
|
|
1,809
|
|
|
1,455
|
|
|
1,213
|
|
|
FDIC and other regulatory assessments
|
|
1,799
|
|
|
1,595
|
|
|
1,796
|
|
|
Other real estate owned expense
|
|
1,426
|
|
|
2,727
|
|
|
820
|
|
|
Other operating expenses
|
|
10,929
|
|
|
10,722
|
|
|
10,414
|
|
|
Total noninterest expenses
|
|
47,489
|
|
|
43,100
|
|
|
37,458
|
|
|
Income before income taxes
|
|
61,975
|
|
|
51,565
|
|
|
35,827
|
|
|
Provision for income taxes
|
|
20,358
|
|
|
17,120
|
|
|
12,389
|
|
|
Net income
|
|
41,617
|
|
|
34,445
|
|
|
23,438
|
|
|
Dividends on preferred stock
|
|
416
|
|
|
400
|
|
|
200
|
|
|
Net income available to common stockholders
|
$
|
41,201
|
|
$
|
34,045
|
|
$
|
23,238
|
|
|
|
|
|
|
|
|
|
|
|
|
|
Basic earnings per common share
|
$
|
6.00
|
|
$
|
5.68
|
|
$
|
4.03
|
|
|
|
|
|
|
|
|
|
|
|
|
|
Diluted earnings per common share
|
$
|
5.69
|
|
$
|
4.99
|
|
$
|
3.53
|
|
| 71 | ||
|
SERVISFIRST BANCSHARES, INC. AND SUBSIDIARIES
|
||||||||||
|
CONSOLIDATED STATEMENTS OF COMPREHENSIVE INCOME
|
||||||||||
|
YEARS ENDED DECEMBER 31, 2013, 2012 AND 2011
|
||||||||||
|
(In thousands)
|
||||||||||
|
|
|
|
|
|
|
|
|
|
|
|
|
|
|
2013
|
|
2012
|
|
2011
|
|
|||
|
Net income
|
|
$
|
41,617
|
|
$
|
34,445
|
|
$
|
23,438
|
|
|
Other comprehensive (loss) income, net of tax:
|
|
|
|
|
|
|
|
|
|
|
|
Unrealized holding (losses) gains arising during period from
|
|
|
|
|
|
|
|
|
|
|
|
securities available for sale, net of tax (benefit) of $(1,781),
|
|
|
|
|
|
|
|
|
|
|
|
$191 and $2,944 for 2013, 2012 and 2011, respectively
|
|
|
(3,319)
|
|
|
354
|
|
|
4,519
|
|
|
Reclassification adjustment for net gains on sale of securities in
|
|
|
|
|
|
|
|
|
|
|
|
net income, net of tax of $45 and $252 for 2013
|
|
|
|
|
|
|
|
|
|
|
|
and 2011, respectively
|
|
|
(86)
|
|
|
-
|
|
|
(414)
|
|
|
Other comprehensive (loss) income, net of tax
|
|
|
(3,405)
|
|
|
354
|
|
|
4,105
|
|
|
Comprehensive income
|
|
$
|
38,212
|
|
$
|
34,799
|
|
$
|
27,543
|
|
|
|
|
|
|
|
|
|
|
|
|
|
|
See Notes to Consolidated Financial Statements
|
|
|
|
|
|
|
|
|
|
|
| 72 | ||
|
SERVISFIRST BANCSHARES, INC. AND SUBSIDIARIES
|
|
||||||||||||||||||
|
CONSOLIDATED STATEMENT OF STOCKHOLDERS' EQUITY
|
|
||||||||||||||||||
|
YEARS ENDED DECEMBER 31, 2013, 2012 AND 2011
|
|
||||||||||||||||||
|
(In thousands, except share amounts)
|
|
||||||||||||||||||
|
|
|
|
|
|
|
|
|
|
|
|
|
|
|
|
|
|
|
|
|
|
|
|
Preferred
Stock |
|
Common
Stock |
|
Additional
Paid-in Capital |
|
Retained
Earnings |
|
Accumulated
Other Comprehensive Income |
|
Total
Stockholders' Equity |
|
||||||
|
Balance, December 31, 2010
|
|
$
|
-
|
|
$
|
6
|
|
$
|
75,914
|
|
$
|
38,343
|
|
$
|
2,837
|
|
$
|
117,100
|
|
|
Sale of 340,000 shares of common
stock |
|
|
-
|
|
|
-
|
|
|
10,159
|
|
|
-
|
|
|
-
|
|
|
10,159
|
|
|
Sale of 40,000 shares of preferred
stock, net |
|
|
39,958
|
|
|
-
|
|
|
-
|
|
|
-
|
|
|
-
|
|
|
39,958
|
|
|
Preferred dividends paid
|
|
|
-
|
|
|
-
|
|
|
-
|
|
|
(200)
|
|
|
-
|
|
|
(200)
|
|
|
Exercise 64,700 stock options, including
tax benefit |
|
|
-
|
|
|
-
|
|
|
757
|
|
|
-
|
|
|
-
|
|
|
757
|
|
|
Stock-based compensation expense
|
|
|
-
|
|
|
-
|
|
|
975
|
|
|
-
|
|
|
-
|
|
|
975
|
|
|
Other comprehensive income
|
|
|
-
|
|
|
-
|
|
|
-
|
|
|
-
|
|
|
4,105
|
|
|
4,105
|
|
|
Net income
|
|
|
-
|
|
|
-
|
|
|
-
|
|
|
23,438
|
|
|
-
|
|
|
23,438
|
|
|
Balance, December 31, 2011
|
|
|
39,958
|
|
|
6
|
|
|
87,805
|
|
|
61,581
|
|
|
6,942
|
|
|
196,292
|
|
|
Dividends paid
|
|
|
-
|
|
|
-
|
|
|
-
|
|
|
(3,134)
|
|
|
-
|
|
|
(3,134)
|
|
|
Preferred dividends paid
|
|
|
-
|
|
|
-
|
|
|
-
|
|
|
(400)
|
|
|
-
|
|
|
(400)
|
|
|
Exercise 332,630 stock options
and warrants, including tax benefit |
|
|
-
|
|
|
-
|
|
|
4,651
|
|
|
-
|
|
|
-
|
|
|
4,651
|
|
|
Stock-based compensation expense
|
|
|
-
|
|
|
-
|
|
|
1,049
|
|
|
-
|
|
|
-
|
|
|
1,049
|
|
|
Other comprehensive income
|
|
|
-
|
|
|
-
|
|
|
-
|
|
|
-
|
|
|
354
|
|
|
354
|
|
|
Net income
|
|
|
-
|
|
|
-
|
|
|
-
|
|
|
34,445
|
|
|
-
|
|
|
34,445
|
|
|
Balance, December 31, 2012
|
|
|
39,958
|
|
|
6
|
|
|
93,505
|
|
|
92,492
|
|
|
7,296
|
|
|
233,257
|
|
|
Sale of 250,000 shares of common
stock |
|
|
-
|
|
|
-
|
|
|
10,337
|
|
|
-
|
|
|
-
|
|
|
10,337
|
|
|
Dividends paid
|
|
|
-
|
|
|
-
|
|
|
-
|
|
|
(3,682)
|
|
|
-
|
|
|
(3,682)
|
|
|
Preferred dividends paid
|
|
|
-
|
|
|
-
|
|
|
-
|
|
|
(416)
|
|
|
-
|
|
|
(416)
|
|
|
Exercise 164,700 stock options and
warrants, including tax benefit |
|
|
-
|
|
|
-
|
|
|
3,279
|
|
|
-
|
|
|
-
|
|
|
3,279
|
|
|
Issuance of 600,000 shares upon
mandatory conversion of subordinated mandatorily convertible debentures |
|
|
-
|
|
|
1
|
|
|
14,999
|
|
|
-
|
|
|
-
|
|
|
15,000
|
|
|
Stock-based compensation expense
|
|
|
-
|
|
|
-
|
|
|
1,205
|
|
|
-
|
|
|
-
|
|
|
1,205
|
|
|
Other comprehensive loss
|
|
|
-
|
|
|
-
|
|
|
-
|
|
|
-
|
|
|
(3,405)
|
|
|
(3,405)
|
|
|
Net income
|
|
|
-
|
|
|
-
|
|
|
-
|
|
|
41,617
|
|
|
-
|
|
|
41,617
|
|
|
Balance, December 31, 2013
|
|
$
|
39,958
|
|
$
|
7
|
|
$
|
123,325
|
|
$
|
130,011
|
|
$
|
3,891
|
|
$
|
297,192
|
|
|
See Notes to Consolidated Financial Statements
|
| 73 | ||
|
SERVISFIRST BANCSHARES, INC. AND SUBSIDIARIES
|
|
|||||||||
|
CONSOLIDATED STATEMENTS OF CASH FLOWS
|
|
|||||||||
|
YEARS ENDED DECEMBER 31, 2013, 2012 AND 2011
|
|
|||||||||
|
(In thousands)
|
|
|||||||||
|
|
|
|
|
|
|
|
|
|
|
|
|
|
|
2013
|
|
2012
|
|
2011
|
|
|||
|
OPERATING ACTIVITIES
|
|
|
|
|
|
|
|
|
|
|
|
Net income
|
|
$
|
41,617
|
|
$
|
34,445
|
|
$
|
23,438
|
|
|
Adjustments to reconcile net income to net cash provided by
|
|
|
|
|
|
|
|
|
|
|
|
Deferred tax benefit
|
|
|
(1,805)
|
|
|
(2,181)
|
|
|
(1,240)
|
|
|
Provision for loan losses
|
|
|
13,008
|
|
|
9,100
|
|
|
8,972
|
|
|
Depreciation and amortization
|
|
|
1,841
|
|
|
1,218
|
|
|
1,173
|
|
|
Net amortization of investments
|
|
|
1,122
|
|
|
1,079
|
|
|
958
|
|
|
Market value adjustment of interest rate cap
|
|
|
-
|
|
|
9
|
|
|
106
|
|
|
Increase in accrued interest and dividends receivable
|
|
|
(1,104)
|
|
|
(966)
|
|
|
(1,202)
|
|
|
Stock-based compensation expense
|
|
|
1,205
|
|
|
1,049
|
|
|
975
|
|
|
(Decrease) increase in accrued interest payable
|
|
|
(173)
|
|
|
(3)
|
|
|
47
|
|
|
Proceeds from sale of mortgage loans held for sale
|
|
|
192,576
|
|
|
239,292
|
|
|
169,172
|
|
|
Originations of mortgage loans held for sale
|
|
|
(172,371)
|
|
|
(243,699)
|
|
|
(177,200)
|
|
|
Gain on sale of securities available for sale
|
|
|
(131)
|
|
|
-
|
|
|
(666)
|
|
|
Gain on sale of mortgage loans held for sale
|
|
|
(2,513)
|
|
|
(3,560)
|
|
|
(2,373)
|
|
|
Net loss (gain) on sale of other real estate owned
|
|
|
159
|
|
|
105
|
|
|
(76)
|
|
|
Write down of other real estate owned
|
|
|
433
|
|
|
2,189
|
|
|
326
|
|
|
Decrease in special prepaid FDIC insurance assessments
|
|
|
2,498
|
|
|
1,322
|
|
|
1,492
|
|
|
Increase in cash surrender value of life insurance contracts
|
|
|
(1,994)
|
|
|
(1,624)
|
|
|
(390)
|
|
|
Loss on prepayment of other borrowings
|
|
|
-
|
|
|
-
|
|
|
738
|
|
|
Excess tax benefits from the exercise of warrants
|
|
|
(262)
|
|
|
(381)
|
|
|
(127)
|
|
|
Net change in other assets, liabilities, and other
|
|
|
|
|
|
|
|
|
|
|
|
operating activities
|
|
|
92
|
|
|
3,790
|
|
|
200
|
|
|
Net cash provided by operating activities
|
|
|
74,198
|
|
|
41,184
|
|
|
24,323
|
|
|
INVESTMENT ACTIVITIES
|
|
|
|
|
|
|
|
|
|
|
|
Purchase of securities available for sale
|
|
|
(83,455)
|
|
|
(47,867)
|
|
|
(102,190)
|
|
|
Proceeds from maturities, calls and paydowns of securities
|
|
|
|
|
|
|
|
|
|
|
|
available for sale
|
|
|
40,959
|
|
|
106,783
|
|
|
28,575
|
|
|
Purchase of securities held to maturity
|
|
|
(10,668)
|
|
|
(11,701)
|
|
|
(15,441)
|
|
|
Proceeds from maturities, calls and paydowns of securities
|
|
|
|
|
|
|
|
|
|
|
|
held to maturity
|
|
|
4,361
|
|
|
943
|
|
|
5,466
|
|
|
Increase in loans
|
|
|
(515,644)
|
|
|
(540,019)
|
|
|
(449,449)
|
|
|
Purchase of premises and equipment
|
|
|
(1,346)
|
|
|
(5,474)
|
|
|
(1,314)
|
|
|
Purchase of restricted equity securities
|
|
|
-
|
|
|
(787)
|
|
|
(543)
|
|
|
Purchase of bank-owned life insurance contracts
|
|
|
(10,000)
|
|
|
(15,000)
|
|
|
(40,000)
|
|
|
Proceeds from sale of securities available for sale
|
|
|
4,140
|
|
|
-
|
|
|
63,270
|
|
|
Proceeds from sale of restricted equity securities
|
|
|
203
|
|
|
347
|
|
|
552
|
|
|
Proceeds from sale of other real estate owned and repossessed assets
|
|
|
7,664
|
|
|
2,967
|
|
|
3,334
|
|
|
Investment in tax credit partnerships
|
|
|
(7,907)
|
|
|
-
|
|
|
-
|
|
|
Net cash used in investing activities
|
|
|
(571,693)
|
|
|
(509,808)
|
|
|
(507,740)
|
|
|
FINANCING ACTIVITIES
|
|
|
|
|
|
|
|
|
|
|
|
Net increase in noninterest-bearing deposits
|
|
|
105,282
|
|
|
126,364
|
|
|
168,320
|
|
|
Net increase in interest-bearing deposits
|
|
|
402,788
|
|
|
241,321
|
|
|
216,851
|
|
|
Net increase in federal funds purchased
|
|
|
57,315
|
|
|
37,800
|
|
|
79,265
|
|
|
Proceeds from other borrowings
|
|
|
-
|
|
|
19,917
|
|
|
-
|
|
|
Redemption of subordinated debentures
|
|
|
-
|
|
|
(15,464)
|
|
|
-
|
|
|
Proceeds from sale of common stock, net
|
|
|
10,337
|
|
|
-
|
|
|
10,032
|
|
|
Proceeds from sale of preferred stock, net
|
|
|
-
|
|
|
-
|
|
|
39,958
|
|
|
Proceeds from exercise of stock options and warrants
|
|
|
3,279
|
|
|
4,651
|
|
|
757
|
|
|
Excess tax benefits from exercise of stock options and warrants
|
|
|
262
|
|
|
381
|
|
|
127
|
|
|
Repayment of other borrowings
|
|
|
-
|
|
|
(5,000)
|
|
|
(20,738)
|
|
|
Dividends on common stock
|
|
|
(3,682)
|
|
|
(3,134)
|
|
|
-
|
|
|
Dividends on preferred stock
|
|
|
(416)
|
|
|
(400)
|
|
|
(200)
|
|
|
Net cash provided by financing activities
|
|
|
575,165
|
|
|
406,436
|
|
|
494,372
|
|
|
Net increase (decrease) in cash and cash equivalents
|
|
|
77,670
|
|
|
(62,188)
|
|
|
10,955
|
|
|
Cash and cash equivalents at beginning of year
|
|
|
180,745
|
|
|
242,933
|
|
|
231,978
|
|
|
Cash and cash equivalents at end of year
|
|
$
|
258,415
|
|
$
|
180,745
|
|
$
|
242,933
|
|
|
SUPPLEMENTAL DISCLOSURE
|
|
|
|
|
|
|
|
|
|
|
|
Cash paid for:
|
|
|
|
|
|
|
|
|
|
|
|
Interest
|
|
$
|
13,792
|
|
$
|
14,904
|
|
$
|
16,033
|
|
|
Income taxes
|
|
|
20,878
|
|
|
13,134
|
|
|
15,837
|
|
|
NONCASH TRANSACTIONS
|
|
|
|
|
|
|
|
|
|
|
|
Conversion of mandatorily convertible subordinated debentures
|
|
$
|
(15,000)
|
|
$
|
-
|
|
$
|
-
|
|
|
Transfers of loans from held for sale to held for investment
|
|
|
-
|
|
|
-
|
|
|
417
|
|
|
Other real estate acquired in settlement of loans
|
|
|
11,355
|
|
|
2,695
|
|
|
9,029
|
|
|
Internally financed sales of other real estate owned
|
|
|
-
|
|
|
24
|
|
|
136
|
|
|
See Notes to Consolidated Financial Statements.
|
| 74 | ||
| 75 | ||
|
|
Loans
|
|
|
Loans are reported at unpaid principal balances, less unearned fees and the allowance for loan losses. Interest on all loans is recognized as income based upon the applicable rate applied to the daily outstanding principal balance of the loans. Interest income on nonaccrual loans is recognized on a cash basis or cost recovery basis until the loan is returned to accrual status. A loan may be returned to accrual status if the Company is reasonably assured of repayment of principal and interest and the borrower has demonstrated sustained performance for a period of at least six months. Loan fees, net of direct costs, are reflected as an adjustment to the yield of the related loan over the term of the loan. The Company does not have a concentration of loans to any one industry or geographic market.
|
|
|
Allowance for Loan Losses
|
|
|
The allowance for loan losses is maintained at a level which, in management’s judgment, is adequate to absorb credit losses inherent in the loan portfolio. The amount of the allowance is based on management’s evaluation of the collectability of the loan portfolio, including the nature of the portfolio, credit concentrations, trends in historical loss experience, specific impaired loans, economic conditions, and other risks inherent in the portfolio. Allowances for impaired loans are generally determined based on collateral values or the present value of the estimated cash flows. The allowance is increased by a provision for loan losses, which is charged to expense, and reduced by charge-offs, net of recoveries. In addition, various regulatory agencies, as an integral part of their examination process, periodically review the allowance for losses on loans. Such agencies may require the Company to recognize adjustments to the allowance based on their judgments about information available to them at the time of their examination.
|
| 76 | ||
|
|
As part of its overall interest rate risk management, the Company uses derivative instruments, which can include interest rate swaps, caps, and floors. Financial Accounting Standards Board (“FASB”) ASC 815-10, Derivatives and Hedging, requires all derivative instruments to be carried at fair value on the balance sheet. This accounting standard provides special accounting provisions for derivative instruments that qualify for hedge accounting. To be eligible, the Company must specifically identify a derivative as a hedging instrument and identify the risk being hedged. The derivative instrument must be shown to meet specific requirements under this accounting standard.
|
|
|
The Company designates the derivative on the date the derivative contract is entered into as (1) a hedge of the fair value of a recognized asset or liability or of an unrecognized firm commitment (a “fair-value” hedge) or (2) a hedge of a forecasted transaction of the variability of cash flows to be received or paid related to a recognized asset or liability (a “cash-flow” hedge). Changes in the fair value of a derivative that is highly effective as a fair-value hedge, and that is designated and qualifies as a fair-value hedge, along with the loss or gain on the hedged asset or liability that is attributable to the hedged risk (including losses or gains on firm commitments), are recorded in current-period earnings. The effective portion of the changes in the fair value of a derivative that is highly effective and that is designated and qualifies as a cash-flow hedge is recorded in other comprehensive income, until earnings are affected by the variability of cash flows (e.g., when periodic settlements on a variable-rate asset or liability are recorded in earnings). The remaining gain or loss on the derivative, if any, in excess of the cumulative change in the present value of future cash flows of the hedged item is recognized in earnings.
|
|
|
The Company formally documents all relationships between hedging instruments and hedged items, as well as its risk-management objective and strategy for undertaking various hedge transactions. This process includes linking all derivatives that are designated as fair-value or cash-flow hedges to specific assets and liabilities on the balance sheet or to specific firm commitments or forecasted transactions. The Company also formally assessed, both at the hedge’s inception and on an ongoing basis (if the hedges do not qualify for short-cut accounting), whether the derivatives that are used in hedging transactions are highly effective in offsetting changes in fair values or cash flows of hedged items. When it is determined that a derivative is not highly effective as a hedge or that it has ceased to be a highly effective hedge, the Company discontinues hedge accounting prospectively, as discussed below. The Company discontinues hedge accounting prospectively when: (1) it is determined that the derivative is no longer effective in offsetting changes in the fair value or cash flows of a hedged item (including firm commitments or forecasted transactions); (2) the derivative expires or is sold, terminated, or exercised; (3) the derivative is re-designated as a hedge instrument, because it is unlikely that a forecasted transaction will occur; (4) a hedged firm commitment no longer meets the definition of a firm commitment; or (5) management determines that designation of the derivative as a hedge instrument is no longer appropriate.
|
| 77 | ||
|
|
Income Taxes
|
|
|
Income tax expense is the total of the current year income tax due or refundable and the change in deferred tax assets and liabilities. Deferred tax assets and liabilities are the expected future tax amounts for the temporary differences between carrying amounts and tax bases of assets and liabilities, computed using enacted tax rates. A valuation allowance, if needed, reduces deferred tax assets to the amount expected to be realized.
|
|
|
At December 31, 2013, the Company had two stock-based employee compensation plans for grants of equity compensation to key employees. These plans have been accounted for under the provisions of FASB ASC 718-10, Compensation – Stock Compensation. The stock-based employee compensation plans are more fully described in Note 13.
|
|
|
Earnings per Common Share
|
|
|
Basic earnings per common share are computed by dividing net income by the weighted average number of common shares outstanding during the period. Diluted earnings per common share include the dilutive effect of additional potential common shares issuable under stock options and warrants.
|
|
|
Loan Commitments and Related Financial Instruments
|
|
|
Fair Value of Financial Instruments
|
|
|
Fair values of financial instruments are estimated using relevant market information and other assumptions, as more fully disclosed in Note 22. Fair value estimates involve uncertainties and matters of significant judgment regarding interest rates, credit risk, prepayments, and other factors, especially in the absence of broad markets for particular items. Changes in assumptions or in market conditions could significantly affect the estimates.
|
|
|
Comprehensive Income
|
|
|
Comprehensive income consists of net income and other comprehensive income. Accumulated comprehensive income, which is recognized as a separate component of equity, includes unrealized gains and losses on securities available for sale.
|
|
|
Advertising
|
|
|
Advertising costs are expensed as incurred. Advertising expense for the years ended December 31, 2013, 2012 and 2011 was $532,000, $454,000 and $406,000, respectively. Advertising typically consists of local print media aimed at businesses that the Company targets as well as sponsorships of local events that the Company’s clients and prospects are involved with.
|
| 78 | ||
| 79 | ||
|
|
|
|
|
|
Gross
|
|
Gross
|
|
|
|
|
||
|
|
|
Amortized
|
|
Unrealized
|
|
Unrealized
|
|
Market
|
|
||||
|
|
|
Cost
|
|
Gain
|
|
Loss
|
|
Value
|
|
||||
|
|
|
(In Thousands)
|
|
||||||||||
|
December 31, 2013
|
|
|
|
||||||||||
|
Securities Available for Sale
|
|
|
|
|
|
|
|
|
|
|
|
|
|
|
U.S. Treasury and government sponsored agencies
|
|
$
|
31,641
|
|
$
|
674
|
|
$
|
(41)
|
|
$
|
32,274
|
|
|
Mortgage-backed securities
|
|
|
85,764
|
|
|
2,574
|
|
|
(98)
|
|
|
88,240
|
|
|
State and municipal securities
|
|
|
127,083
|
|
|
3,430
|
|
|
(682)
|
|
|
129,831
|
|
|
Corporate debt
|
|
|
15,738
|
|
|
163
|
|
|
(26)
|
|
|
15,875
|
|
|
Total
|
|
|
260,226
|
|
|
6,841
|
|
|
(847)
|
|
|
266,220
|
|
|
Securities Held to Maturity
|
|
|
|
|
|
|
|
|
|
|
|
|
|
|
Mortgage-backed securities
|
|
|
26,730
|
|
|
266
|
|
|
(1,422)
|
|
|
25,574
|
|
|
State and municipal securities
|
|
|
5,544
|
|
|
197
|
|
|
-
|
|
|
5,741
|
|
|
Total
|
|
$
|
32,274
|
|
$
|
463
|
|
$
|
(1,422)
|
|
$
|
31,315
|
|
|
|
|
|
|
|
|
|
|
|
|
|
|
|
|
|
December 31, 2012
|
|
|
|
|
|
|
|
|
|
|
|
|
|
|
Securities Available for Sale
|
|
|
|
|
|
|
|
|
|
|
|
|
|
|
U.S. Treasury and government sponsored agencies
|
|
$
|
27,360
|
|
$
|
1,026
|
|
$
|
-
|
|
$
|
28,386
|
|
|
Mortgage-backed securities
|
|
|
69,298
|
|
|
4,168
|
|
|
-
|
|
|
73,466
|
|
|
State and municipal securities
|
|
|
112,319
|
|
|
5,941
|
|
|
(83)
|
|
|
118,177
|
|
|
Corporate debt
|
|
|
13,677
|
|
|
210
|
|
|
(39)
|
|
|
13,848
|
|
|
Total
|
|
|
222,654
|
|
|
11,345
|
|
|
(122)
|
|
|
233,877
|
|
|
Securities Held to Maturity
|
|
|
|
|
|
|
|
|
|
|
|
|
|
|
Mortgage-backed securities
|
|
|
20,429
|
|
|
768
|
|
|
(40)
|
|
|
21,157
|
|
|
State and municipal securities
|
|
|
5,538
|
|
|
655
|
|
|
-
|
|
|
6,193
|
|
|
Total
|
|
$
|
25,967
|
|
$
|
1,423
|
|
$
|
(40)
|
|
$
|
27,350
|
|
| 80 | ||
|
|
|
December 31, 2013
|
|
December 31, 2012
|
|
||||||||
|
|
|
Amortized Cost
|
|
Market Value
|
|
Amortized Cost
|
|
Market Value
|
|
||||
|
|
|
|
|
|
|
|
|
|
|
|
|
|
|
|
|
|
(In Thousands)
|
|
||||||||||
|
Securities available for sale
|
|
|
|
|
|
|
|
|
|
|
|
|
|
|
Due within one year
|
|
$
|
5,659
|
|
$
|
5,717
|
|
$
|
11,971
|
|
$
|
12,052
|
|
|
Due from one to five years
|
|
|
102,535
|
|
|
104,887
|
|
|
79,192
|
|
|
81,940
|
|
|
Due from five to ten years
|
|
|
65,174
|
|
|
66,229
|
|
|
59,825
|
|
|
63,801
|
|
|
Due after ten years
|
|
|
1,094
|
|
|
1,147
|
|
|
2,368
|
|
|
2,618
|
|
|
Mortgage-backed securities
|
|
|
85,764
|
|
|
88,240
|
|
|
69,298
|
|
|
73,466
|
|
|
|
|
$
|
260,226
|
|
$
|
266,220
|
|
$
|
222,654
|
|
$
|
233,877
|
|
|
|
|
|
|
|
|
|
|
|
|
|
|
|
|
|
Securities held to maturity
|
|
|
|
|
|
|
|
|
|
|
|
|
|
|
Due after ten years
|
|
$
|
5,544
|
|
$
|
5,741
|
|
$
|
5,538
|
|
$
|
6,193
|
|
|
Mortgage-backed securities
|
|
|
26,730
|
|
|
25,574
|
|
|
20,429
|
|
|
21,157
|
|
|
|
|
$
|
32,274
|
|
$
|
31,315
|
|
$
|
25,967
|
|
$
|
27,350
|
|
|
|
|
Less Than Twelve Months
|
|
Twelve Months or More
|
|
Total
|
|
||||||||||||
|
|
|
Gross
|
|
|
|
|
Gross
|
|
|
|
|
Gross
|
|
|
|
|
|||
|
|
|
Unrealized
|
|
|
|
|
Unrealized
|
|
|
|
|
Unrealized
|
|
|
|
|
|||
|
|
|
Losses
|
|
Fair Value
|
|
Losses
|
|
Fair Value
|
|
Losses
|
|
Fair Value
|
|
||||||
|
|
|
|
|
|
|
|
|
|
|
|
|
|
|
|
|
|
|
|
|
|
|
|
(In Thousands)
|
|
||||||||||||||||
|
December 31, 2013
|
|
|
|
|
|
|
|
|
|
|
|
|
|
|
|
|
|
|
|
|
U.S. Treasury and government
|
|
|
|
|
|
|
|
|
|
|
|
|
|
|
|
|
|
|
|
|
sponsored agencies
|
|
$
|
(41)
|
|
$
|
5,854
|
|
$
|
-
|
|
$
|
-
|
|
$
|
(41)
|
|
$
|
5,854
|
|
|
Mortgage-backed securities
|
|
|
(852)
|
|
|
21,365
|
|
|
(668)
|
|
|
6,691
|
|
|
(1,520)
|
|
|
28,056
|
|
|
State and municipal securities
|
|
|
(607)
|
|
|
30,666
|
|
|
(75)
|
|
|
3,443
|
|
|
(682)
|
|
|
34,109
|
|
|
Corporate debt
|
|
|
(26)
|
|
|
5,958
|
|
|
-
|
|
|
-
|
|
|
(26)
|
|
|
5,958
|
|
|
Total
|
|
$
|
(1,526)
|
|
$
|
63,843
|
|
$
|
(743)
|
|
$
|
10,134
|
|
$
|
(2,269)
|
|
$
|
73,977
|
|
|
|
|
|
|
|
|
|
|
|
|
|
|
|
|
|
|
|
|
|
|
|
December 31, 2012
|
|
|
|
|
|
|
|
|
|
|
|
|
|
|
|
|
|
|
|
|
U.S. Treasury and government sponsored agencies
|
|
|
|
|
|
|
|
|
|
|
|
|
|
|
|
|
|
|
|
|
Mortgage-backed securities
|
|
|
(40)
|
|
|
4,439
|
|
|
-
|
|
|
-
|
|
|
(40)
|
|
|
4,439
|
|
|
State and municipal securities
|
|
|
(83)
|
|
|
8,801
|
|
|
-
|
|
|
166
|
|
|
(83)
|
|
|
8,967
|
|
|
Corporate debt
|
|
|
(39)
|
|
|
4,882
|
|
|
-
|
|
|
-
|
|
|
(39)
|
|
|
4,882
|
|
|
Total
|
|
$
|
(162)
|
|
$
|
18,122
|
|
$
|
-
|
|
$
|
166
|
|
$
|
(162)
|
|
$
|
18,288
|
|
| 81 | ||
|
|
|
December 31,
|
|
||||
|
|
|
2013
|
|
2012
|
|
||
|
|
|
(In Thousands)
|
|
||||
|
Commercial, financial and agricultural
|
|
$
|
1,278,649
|
|
$
|
1,030,990
|
|
|
Real estate - construction
|
|
|
151,868
|
|
|
158,361
|
|
|
Real estate - mortgage:
|
|
|
|
|
|
|
|
|
Owner-occupied commercial
|
|
|
710,372
|
|
|
568,041
|
|
|
1-4 family mortgage
|
|
|
278,621
|
|
|
235,909
|
|
|
Other mortgage
|
|
|
391,396
|
|
|
323,599
|
|
|
Total real estate - mortgage
|
|
|
1,380,389
|
|
|
1,127,549
|
|
|
Consumer
|
|
|
47,962
|
|
|
46,282
|
|
|
Total Loans
|
|
|
2,858,868
|
|
|
2,363,182
|
|
|
Less: Allowance for loan losses
|
|
|
(30,663)
|
|
|
(26,258)
|
|
|
Net Loans
|
|
$
|
2,828,205
|
|
$
|
2,336,924
|
|
|
|
|
Years Ended December 31,
|
|
|||||||
|
|
|
2013
|
|
2012
|
|
2011
|
|
|||
|
|
|
(In Thousands)
|
|
|||||||
|
Balance, beginning of year
|
|
$
|
26,258
|
|
$
|
22,030
|
|
$
|
18,077
|
|
|
Loans charged off
|
|
|
(9,012)
|
|
|
(5,755)
|
|
|
(5,653)
|
|
|
Recoveries
|
|
|
409
|
|
|
883
|
|
|
634
|
|
|
Provision for loan losses
|
|
|
13,008
|
|
|
9,100
|
|
|
8,972
|
|
|
Balance, end of year
|
|
$
|
30,663
|
|
$
|
26,258
|
|
$
|
22,030
|
|
| 82 | ||
| 83 | ||
|
|
|
Commercial,
|
|
|
|
|
|
|
|
|
|
|
|
|
|
|
|
|
|
|
|
|
financial and
|
|
Real estate -
|
|
Real estate -
|
|
|
|
|
Qualitative
|
|
|
|
|
||||
|
|
|
agricultural
|
|
construction
|
|
mortgage
|
|
Consumer
|
|
Factors
|
|
Total
|
|
||||||
|
|
|
(In Thousands)
|
|
||||||||||||||||
|
|
|
Year Ended December 31, 2013
|
|
||||||||||||||||
|
Allowance for loan losses:
|
|
|
|
|
|
|
|
|
|
|
|
|
|
|
|
|
|
|
|
|
Balance at December 31, 2012
|
|
$
|
8,233
|
|
$
|
6,511
|
|
$
|
4,912
|
|
$
|
199
|
|
$
|
6,403
|
|
$
|
26,258
|
|
|
Chargeoffs
|
|
|
(1,932)
|
|
|
(4,829)
|
|
|
(2,041)
|
|
|
(210)
|
|
|
-
|
|
|
(9,012)
|
|
|
Recoveries
|
|
|
66
|
|
|
296
|
|
|
36
|
|
|
11
|
|
|
-
|
|
|
409
|
|
|
Provision
|
|
|
4,803
|
|
|
3,831
|
|
|
4,588
|
|
|
855
|
|
|
(1,069)
|
|
|
13,008
|
|
|
Balance at December 31, 2013
|
|
$
|
11,170
|
|
$
|
5,809
|
|
$
|
7,495
|
|
$
|
855
|
|
$
|
5,334
|
|
$
|
30,663
|
|
|
|
|
|
|
|
|
|
|
|
|
|
|
|
|
|
|
|
|
|
|
|
|
|
December 31, 2013
|
|
||||||||||||||||
|
Individually Evaluated for Impairment
|
|
$
|
1,992
|
|
$
|
1,597
|
|
$
|
1,982
|
|
$
|
699
|
|
$
|
-
|
|
$
|
6,270
|
|
|
Collectively Evaluated for Impairment
|
|
|
9,178
|
|
|
4,212
|
|
|
5,513
|
|
|
156
|
|
|
5,334
|
|
|
24,393
|
|
|
|
|
|
|
|
|
|
|
|
|
|
|
|
|
|
|
|
|
|
|
|
Loans:
|
|
|
|
|
|
|
|
|
|
|
|
|
|
|
|
|
|
|
|
|
Ending Balance
|
|
$
|
1,278,649
|
|
$
|
151,868
|
|
$
|
1,380,389
|
|
$
|
47,962
|
|
$
|
-
|
|
$
|
2,858,868
|
|
|
Individually Evaluated for Impairment
|
|
|
3,827
|
|
|
9,238
|
|
|
18,202
|
|
|
699
|
|
|
-
|
|
|
31,966
|
|
|
Collectively Evaluated for Impairment
|
|
|
1,274,822
|
|
|
142,630
|
|
|
1,362,187
|
|
|
47,263
|
|
|
-
|
|
|
2,826,902
|
|
|
|
|
|
|
|
|
|
|
|
|
|
|
|
|
|
|
|
|
|
|
|
|
|
Year Ended December 31, 2012
|
|
||||||||||||||||
|
Allowance for loan losses:
|
|
|
|
|
|
|
|
|
|
|
|
|
|
|
|
|
|
|
|
|
Balance at December 31, 2011
|
|
$
|
6,627
|
|
$
|
6,542
|
|
$
|
3,295
|
|
$
|
531
|
|
$
|
5,035
|
|
$
|
22,030
|
|
|
Chargeoffs
|
|
|
(1,106)
|
|
|
(3,088)
|
|
|
(660)
|
|
|
(901)
|
|
|
-
|
|
|
(5,755)
|
|
|
Recoveries
|
|
|
125
|
|
|
58
|
|
|
692
|
|
|
8
|
|
|
-
|
|
|
883
|
|
|
Provision
|
|
|
2,587
|
|
|
2,999
|
|
|
1,585
|
|
|
561
|
|
|
1,368
|
|
|
9,100
|
|
|
Balance at December 31, 2012
|
|
$
|
8,233
|
|
$
|
6,511
|
|
$
|
4,912
|
|
$
|
199
|
|
$
|
6,403
|
|
$
|
26,258
|
|
|
|
|
|
|
|
|
|
|
|
|
|
|
|
|
|
|
|
|
|
|
|
|
|
December 31, 2012
|
|
||||||||||||||||
|
Individually Evaluated for Impairment
|
|
$
|
577
|
|
$
|
1,013
|
|
$
|
1,921
|
|
$
|
-
|
|
$
|
-
|
|
$
|
3,511
|
|
|
Collectively Evaluated for Impairment
|
|
|
7,656
|
|
|
5,498
|
|
|
2,991
|
|
|
199
|
|
|
6,403
|
|
|
22,747
|
|
|
|
|
|
|
|
|
|
|
|
|
|
|
|
|
|
|
|
|
|
|
|
Loans:
|
|
|
|
|
|
|
|
|
|
|
|
|
|
|
|
|
|
|
|
|
Ending Balance
|
|
$
|
1,030,990
|
|
$
|
158,361
|
|
$
|
1,127,549
|
|
$
|
46,282
|
|
$
|
-
|
|
$
|
2,363,182
|
|
|
Individually Evaluated for Impairment
|
|
|
3,910
|
|
|
14,422
|
|
|
18,927
|
|
|
135
|
|
|
-
|
|
|
37,394
|
|
|
Collectively Evaluated for Impairment
|
|
|
1,027,080
|
|
|
143,939
|
|
|
1,108,622
|
|
|
46,147
|
|
|
-
|
|
|
2,325,788
|
|
|
|
·
|
Pass – loans which are well protected by the current net worth and paying capacity of the obligor (or obligors, if any) or by the fair value, less cost to acquire and sell, of any underlying collateral.
|
|
|
·
|
Special Mention – loans with potential weakness that may, if not reversed or corrected, weaken the credit or inadequately protect the Company’s position at some future date. These loans are not adversely classified and do not expose an institution to sufficient risk to warrant an adverse classification.
|
|
|
·
|
Substandard – loans that exhibit well-defined weakness or weaknesses that presently jeopardize debt repayment. These loans are characterized by the distinct possibility that the institution will sustain some loss if the weaknesses are not corrected.
|
|
|
·
|
Doubtful – loans that have all the weaknesses inherent in loans classified substandard, plus the added characteristic that the weaknesses make collection or liquidation in full on the basis of currently existing facts, conditions, and values highly questionable and improbable.
|
| 84 | ||
|
|
|
|
|
|
Special
|
|
|
|
|
|
|
|
|
|
|
|
|
December 31, 2013
|
|
Pass
|
|
Mention
|
|
Substandard
|
|
Doubtful
|
|
Total
|
|
|||||
|
|
|
(In Thousands)
|
|
|||||||||||||
|
Commercial, financial
|
|
|
|
|
|
|
|
|
|
|
|
|
|
|
|
|
|
and agricultural
|
|
$
|
1,238,109
|
|
$
|
34,883
|
|
$
|
5,657
|
|
$
|
-
|
|
$
|
1,278,649
|
|
|
Real estate - construction
|
|
|
139,239
|
|
|
3,392
|
|
|
9,237
|
|
|
-
|
|
|
151,868
|
|
|
Real estate - mortgage:
|
|
|
|
|
|
|
|
|
|
|
|
|
|
|
|
|
|
Owner-occupied
|
|
|
|
|
|
|
|
|
|
|
|
|
|
|
|
|
|
commercial
|
|
|
696,687
|
|
|
11,545
|
|
|
2,140
|
|
|
-
|
|
|
710,372
|
|
|
1-4 family mortgage
|
|
|
265,019
|
|
|
1,253
|
|
|
12,349
|
|
|
-
|
|
|
278,621
|
|
|
Other mortgage
|
|
|
379,419
|
|
|
8,179
|
|
|
3,798
|
|
|
-
|
|
|
391,396
|
|
|
Total real estate mortgage
|
|
|
1,341,125
|
|
|
20,977
|
|
|
18,287
|
|
|
-
|
|
|
1,380,389
|
|
|
Consumer
|
|
|
47,243
|
|
|
3
|
|
|
716
|
|
|
-
|
|
|
47,962
|
|
|
Total
|
|
$
|
2,765,716
|
|
$
|
59,255
|
|
$
|
33,897
|
|
$
|
-
|
|
$
|
2,858,868
|
|
|
|
|
|
|
|
|
|
|
|
|
|
|
|
|
|
|
|
|
|
|
|
|
|
Special
|
|
|
|
|
|
|
|
|
|
|
|
|
December 31, 2012
|
|
Pass
|
|
Mention
|
|
Substandard
|
|
Doubtful
|
|
Total
|
|
|||||
|
|
|
(In Thousands)
|
|
|||||||||||||
|
Commercial, financial
|
|
|
|
|
|
|
|
|
|
|
|
|
|
|
|
|
|
and agricultural
|
|
$
|
1,004,043
|
|
$
|
19,172
|
|
$
|
7,775
|
|
$
|
-
|
|
$
|
1,030,990
|
|
|
Real estate - construction
|
|
|
121,168
|
|
|
22,771
|
|
|
14,422
|
|
|
-
|
|
|
158,361
|
|
|
Real estate - mortgage:
|
|
|
|
|
|
|
|
|
|
|
|
|
|
|
|
|
|
Owner-occupied
|
|
|
|
|
|
|
|
|
|
|
|
|
|
|
|
|
|
commercial
|
|
|
555,536
|
|
|
4,142
|
|
|
8,363
|
|
|
-
|
|
|
568,041
|
|
|
1-4 family mortgage
|
|
|
223,152
|
|
|
6,379
|
|
|
6,378
|
|
|
-
|
|
|
235,909
|
|
|
Other mortgage
|
|
|
312,473
|
|
|
6,674
|
|
|
4,452
|
|
|
-
|
|
|
323,599
|
|
|
Total real estate mortgage
|
|
|
1,091,161
|
|
|
17,195
|
|
|
19,193
|
|
|
-
|
|
|
1,127,549
|
|
|
Consumer
|
|
|
46,076
|
|
|
71
|
|
|
135
|
|
|
-
|
|
|
46,282
|
|
|
Total
|
|
$
|
2,262,448
|
|
$
|
59,209
|
|
$
|
41,525
|
|
$
|
-
|
|
$
|
2,363,182
|
|
| 85 | ||
|
December 31, 2013
|
|
Performing
|
|
Nonperforming
|
|
Total
|
|
|||
|
|
|
(In Thousands)
|
|
|||||||
|
Commercial, financial
|
|
|
|
|
|
|
|
|
|
|
|
and agricultural
|
|
$
|
1,276,935
|
|
$
|
1,714
|
|
$
|
1,278,649
|
|
|
Real estate - construction
|
|
|
148,118
|
|
|
3,750
|
|
|
151,868
|
|
|
Real estate - mortgage:
|
|
|
|
|
|
|
|
|
|
|
|
Owner-occupied
|
|
|
|
|
|
|
|
|
|
|
|
commercial
|
|
|
708,937
|
|
|
1,435
|
|
|
710,372
|
|
|
1-4 family mortgage
|
|
|
276,725
|
|
|
1,896
|
|
|
278,621
|
|
|
Other mortgage
|
|
|
391,153
|
|
|
243
|
|
|
391,396
|
|
|
Total real estate mortgage
|
|
|
1,376,815
|
|
|
3,574
|
|
|
1,380,389
|
|
|
Consumer
|
|
|
47,264
|
|
|
698
|
|
|
47,962
|
|
|
Total
|
|
$
|
2,849,132
|
|
$
|
9,736
|
|
$
|
2,858,868
|
|
|
|
|
|
|
|
|
|
|
|
|
|
|
December 31, 2012
|
|
Performing
|
|
Nonperforming
|
|
Total
|
|
|||
|
|
|
(In Thousands)
|
|
|||||||
|
Commercial, financial
|
|
|
|
|
|
|
|
|
|
|
|
and agricultural
|
|
$
|
1,030,714
|
|
$
|
276
|
|
$
|
1,030,990
|
|
|
Real estate - construction
|
|
|
151,901
|
|
|
6,460
|
|
|
158,361
|
|
|
Real estate - mortgage:
|
|
|
|
|
|
|
|
|
|
|
|
Owner-occupied
|
|
|
|
|
|
|
|
|
|
|
|
commercial
|
|
|
565,255
|
|
|
2,786
|
|
|
568,041
|
|
|
1-4 family mortgage
|
|
|
235,456
|
|
|
453
|
|
|
235,909
|
|
|
Other mortgage
|
|
|
323,359
|
|
|
240
|
|
|
323,599
|
|
|
Total real estate mortgage
|
|
|
1,124,070
|
|
|
3,479
|
|
|
1,127,549
|
|
|
Consumer
|
|
|
46,139
|
|
|
143
|
|
|
46,282
|
|
|
Total
|
|
$
|
2,352,824
|
|
$
|
10,358
|
|
$
|
2,363,182
|
|
| 86 | ||
|
December 31, 2013
|
|
Past Due Status (Accruing Loans)
|
|
|
|
|
|
|
|
|
|
|
||||||||||
|
|
|
|
|
|
|
|
|
|
|
|
Total Past
|
|
|
|
|
|
|
|
|
|
|
|
|
|
|
30-59 Days
|
|
60-89 Days
|
|
90+ Days
|
|
Due
|
|
Non-Accrual
|
|
Current
|
|
Total Loans
|
|
|||||||
|
|
|
(In Thousands)
|
|
|||||||||||||||||||
|
Commercial, financial
|
|
|
|
|
|
|
|
|
|
|
|
|
|
|
|
|
|
|
|
|
|
|
|
and agricultural
|
|
$
|
73
|
|
$
|
-
|
|
$
|
-
|
|
$
|
73
|
|
$
|
1,714
|
|
$
|
1,276,862
|
|
$
|
1,278,649
|
|
|
Real estate - construction
|
|
|
-
|
|
|
-
|
|
|
-
|
|
|
-
|
|
|
3,750
|
|
|
148,118
|
|
|
151,868
|
|
|
Real estate - mortgage:
|
|
|
|
|
|
|
|
|
|
|
|
|
|
|
|
|
|
|
|
|
|
|
|
Owner-occupied
|
|
|
|
|
|
|
|
|
|
|
|
|
|
|
|
|
|
|
|
|
|
|
|
commercial
|
|
|
-
|
|
|
-
|
|
|
-
|
|
|
-
|
|
|
1,435
|
|
|
708,937
|
|
|
710,372
|
|
|
1-4 family mortgage
|
|
|
177
|
|
|
-
|
|
|
19
|
|
|
196
|
|
|
1,877
|
|
|
276,548
|
|
|
278,621
|
|
|
Other mortgage
|
|
|
-
|
|
|
-
|
|
|
-
|
|
|
-
|
|
|
243
|
|
|
391,153
|
|
|
391,396
|
|
|
Total real estate -
|
|
|
|
|
|
|
|
|
|
|
|
|
|
|
|
|
|
|
|
|
|
|
|
mortgage
|
|
|
177
|
|
|
-
|
|
|
19
|
|
|
196
|
|
|
3,555
|
|
|
1,376,638
|
|
|
1,380,389
|
|
|
Consumer
|
|
|
89
|
|
|
97
|
|
|
96
|
|
|
282
|
|
|
602
|
|
|
47,078
|
|
|
47,962
|
|
|
Total
|
|
$
|
339
|
|
$
|
97
|
|
$
|
115
|
|
$
|
551
|
|
$
|
9,621
|
|
$
|
2,848,696
|
|
$
|
2,858,868
|
|
|
|
|
|
|
|
|
|
|
|
|
|
|
|
|
|
|
|
|
|
|
|
|
|
|
December 31, 2012
|
|
Past Due Status (Accruing Loans)
|
|
|
|
|
|
|
|
|
|
|
||||||||||
|
|
|
|
|
|
|
|
|
|
|
|
Total Past
|
|
|
|
|
|
|
|
|
|
|
|
|
|
|
30-59 Days
|
|
60-89 Days
|
|
90+ Days
|
|
Due
|
|
Non-Accrual
|
|
Current
|
|
Total Loans
|
|
|||||||
|
|
|
(In Thousands)
|
|
|||||||||||||||||||
|
Commercial, financial
|
|
|
|
|
|
|
|
|
|
|
|
|
|
|
|
|
|
|
|
|
|
|
|
and agricultural
|
|
$
|
1,699
|
|
$
|
385
|
|
$
|
-
|
|
$
|
2,084
|
|
$
|
276
|
|
$
|
1,028,630
|
|
$
|
1,030,990
|
|
|
Real estate - construction
|
|
|
-
|
|
|
-
|
|
|
-
|
|
|
-
|
|
|
6,460
|
|
|
151,901
|
|
|
158,361
|
|
|
Real estate - mortgage:
|
|
|
|
|
|
|
|
|
|
|
|
|
|
|
|
|
|
|
|
|
|
|
|
Owner-occupied
|
|
|
|
|
|
|
|
|
|
|
|
|
|
|
|
|
|
|
|
|
|
|
|
commercial
|
|
|
1,480
|
|
|
10
|
|
|
-
|
|
|
1,490
|
|
|
2,786
|
|
|
563,765
|
|
|
568,041
|
|
|
1-4 family mortgage
|
|
|
420
|
|
|
16
|
|
|
-
|
|
|
436
|
|
|
453
|
|
|
235,020
|
|
|
235,909
|
|
|
Other mortgage
|
|
|
516
|
|
|
-
|
|
|
-
|
|
|
516
|
|
|
240
|
|
|
322,843
|
|
|
323,599
|
|
|
Total real estate -
|
|
|
|
|
|
|
|
|
|
|
|
|
|
|
|
|
|
|
|
|
|
|
|
mortgage
|
|
|
2,416
|
|
|
26
|
|
|
-
|
|
|
2,442
|
|
|
3,479
|
|
|
1,121,628
|
|
|
1,127,549
|
|
|
Consumer
|
|
|
108
|
|
|
-
|
|
|
8
|
|
|
116
|
|
|
135
|
|
|
46,031
|
|
|
46,282
|
|
|
Total
|
|
$
|
4,223
|
|
$
|
411
|
|
$
|
8
|
|
$
|
4,642
|
|
$
|
10,350
|
|
$
|
2,348,190
|
|
$
|
2,363,182
|
|
| 87 | ||
|
|
|
December 31, 2013
|
|
|
|
|
|
|
|
|||||||
|
|
|
|
|
|
|
|
|
|
|
|
|
|
|
|
|
|
|
|
|
|
|
|
Unpaid
|
|
|
|
|
Average
|
|
Interest Income
|
|
|||
|
|
|
Recorded
|
|
Principal
|
|
Related
|
|
Recorded
|
|
Recognized
|
|
|||||
|
|
|
Investment
|
|
Balance
|
|
Allowance
|
|
Investment
|
|
in Period
|
|
|||||
|
|
|
(In Thousands)
|
|
|||||||||||||
|
With no allowance recorded:
|
|
|
|
|
|
|
|
|
|
|
|
|
|
|
|
|
|
Commercial, financial
|
|
|
|
|
|
|
|
|
|
|
|
|
|
|
|
|
|
and agricultural
|
|
$
|
1,210
|
|
$
|
1,210
|
|
$
|
-
|
|
$
|
1,196
|
|
$
|
63
|
|
|
Real estate - construction
|
|
|
1,967
|
|
|
2,405
|
|
|
-
|
|
|
1,363
|
|
|
32
|
|
|
Real estate - mortgage:
|
|
|
|
|
|
|
|
|
|
|
|
|
|
|
|
|
|
Owner-occupied commercial
|
|
|
577
|
|
|
577
|
|
|
-
|
|
|
603
|
|
|
32
|
|
|
1-4 family mortgage
|
|
|
1,198
|
|
|
1,198
|
|
|
-
|
|
|
1,200
|
|
|
55
|
|
|
Other mortgage
|
|
|
2,311
|
|
|
2,311
|
|
|
-
|
|
|
1,901
|
|
|
123
|
|
|
Total real estate - mortgage
|
|
|
4,086
|
|
|
4,086
|
|
|
-
|
|
|
3,704
|
|
|
210
|
|
|
Consumer
|
|
|
-
|
|
|
-
|
|
|
-
|
|
|
-
|
|
|
-
|
|
|
Total with no allowance recorded
|
|
|
7,263
|
|
|
7,701
|
|
|
-
|
|
|
6,263
|
|
|
305
|
|
|
|
|
|
|
|
|
|
|
|
|
|
|
|
|
|
|
|
|
With an allowance recorded:
|
|
|
|
|
|
|
|
|
|
|
|
|
|
|
|
|
|
Commercial, financial
|
|
|
|
|
|
|
|
|
|
|
|
|
|
|
|
|
|
and agricultural
|
|
|
2,618
|
|
|
2,958
|
|
|
1,992
|
|
|
2,844
|
|
|
98
|
|
|
Real estate - construction
|
|
|
7,270
|
|
|
7,750
|
|
|
1,597
|
|
|
6,564
|
|
|
200
|
|
|
Real estate - mortgage:
|
|
|
|
|
|
|
|
|
|
|
|
|
|
|
|
|
|
Owner-occupied commercial
|
|
|
1,509
|
|
|
1,509
|
|
|
620
|
|
|
1,573
|
|
|
38
|
|
|
1-4 family mortgage
|
|
|
11,120
|
|
|
11,120
|
|
|
1,210
|
|
|
10,743
|
|
|
342
|
|
|
Other mortgage
|
|
|
1,487
|
|
|
1,586
|
|
|
152
|
|
|
1,873
|
|
|
96
|
|
|
Total real estate - mortgage
|
|
|
14,116
|
|
|
14,215
|
|
|
1,982
|
|
|
14,189
|
|
|
476
|
|
|
Consumer
|
|
|
699
|
|
|
699
|
|
|
699
|
|
|
790
|
|
|
28
|
|
|
Total with allowance recorded
|
|
|
24,703
|
|
|
25,622
|
|
|
6,270
|
|
|
24,387
|
|
|
802
|
|
|
|
|
|
|
|
|
|
|
|
|
|
|
|
|
|
|
|
|
Total Impaired Loans:
|
|
|
|
|
|
|
|
|
|
|
|
|
|
|
|
|
|
Commercial, financial
|
|
|
|
|
|
|
|
|
|
|
|
|
|
|
|
|
|
and agricultural
|
|
|
3,828
|
|
|
4,168
|
|
|
1,992
|
|
|
4,040
|
|
|
161
|
|
|
Real estate - construction
|
|
|
9,237
|
|
|
10,155
|
|
|
1,597
|
|
|
7,927
|
|
|
232
|
|
|
Real estate - mortgage:
|
|
|
|
|
|
|
|
|
|
|
|
|
|
|
|
|
|
Owner-occupied commercial
|
|
|
2,086
|
|
|
2,086
|
|
|
620
|
|
|
2,176
|
|
|
70
|
|
|
1-4 family mortgage
|
|
|
12,318
|
|
|
12,318
|
|
|
1,210
|
|
|
11,943
|
|
|
397
|
|
|
Other mortgage
|
|
|
3,798
|
|
|
3,897
|
|
|
152
|
|
|
3,774
|
|
|
219
|
|
|
Total real estate - mortgage
|
|
|
18,202
|
|
|
18,301
|
|
|
1,982
|
|
|
17,893
|
|
|
686
|
|
|
Consumer
|
|
|
699
|
|
|
699
|
|
|
699
|
|
|
790
|
|
|
28
|
|
|
Total impaired loans
|
|
$
|
31,966
|
|
$
|
33,323
|
|
$
|
6,270
|
|
$
|
30,650
|
|
$
|
1,107
|
|
| 88 | ||
|
|
|
December 31, 2012
|
|
|
|
|
|
|
|
|||||||
|
|
|
|
|
|
|
|
|
|
|
|
|
|
|
|
|
|
|
|
|
|
|
|
Unpaid
|
|
|
|
|
Average
|
|
Interest Income
|
|
|||
|
|
|
Recorded
|
|
Principal
|
|
Related
|
|
Recorded
|
|
Recognized in
|
|
|||||
|
|
|
Investment
|
|
Balance
|
|
Allowance
|
|
Investment
|
|
Period
|
|
|||||
|
|
|
(In Thousands)
|
|
|||||||||||||
|
With no allowance recorded:
|
|
|
|
|
|
|
|
|
|
|
|
|
|
|
|
|
|
Commercial, financial
|
|
|
|
|
|
|
|
|
|
|
|
|
|
|
|
|
|
and agricultural
|
|
$
|
2,602
|
|
$
|
2,856
|
|
$
|
-
|
|
$
|
2,313
|
|
$
|
105
|
|
|
Real estate - construction
|
|
|
6,872
|
|
|
7,894
|
|
|
-
|
|
|
7,631
|
|
|
188
|
|
|
Owner-occupied commercial
|
|
|
5,111
|
|
|
5,361
|
|
|
-
|
|
|
5,411
|
|
|
145
|
|
|
1-4 family mortgage
|
|
|
2,166
|
|
|
2,388
|
|
|
-
|
|
|
2,177
|
|
|
108
|
|
|
Other mortgage
|
|
|
4,151
|
|
|
4,249
|
|
|
-
|
|
|
4,206
|
|
|
275
|
|
|
Total real estate - mortgage
|
|
|
11,428
|
|
|
11,998
|
|
|
-
|
|
|
11,794
|
|
|
528
|
|
|
Consumer
|
|
|
135
|
|
|
344
|
|
|
-
|
|
|
296
|
|
|
6
|
|
|
Total with no allowance recorded
|
|
|
21,037
|
|
|
23,092
|
|
|
-
|
|
|
22,034
|
|
|
827
|
|
|
|
|
|
|
|
|
|
|
|
|
|
|
|
|
|
|
|
|
With an allowance recorded:
|
|
|
|
|
|
|
|
|
|
|
|
|
|
|
|
|
|
Commercial, financial
|
|
|
|
|
|
|
|
|
|
|
|
|
|
|
|
|
|
and agricultural
|
|
|
1,308
|
|
|
1,308
|
|
|
577
|
|
|
1,325
|
|
|
90
|
|
|
Real estate - construction
|
|
|
7,550
|
|
|
8,137
|
|
|
1,013
|
|
|
6,961
|
|
|
154
|
|
|
Real estate - mortgage:
|
|
|
|
|
|
|
|
|
|
|
|
|
|
|
|
|
|
Owner-occupied commercial
|
|
|
3,195
|
|
|
3,195
|
|
|
779
|
|
|
3,277
|
|
|
77
|
|
|
1-4 family mortgage
|
|
|
4,002
|
|
|
4,002
|
|
|
1,007
|
|
|
4,001
|
|
|
139
|
|
|
Other mortgage
|
|
|
302
|
|
|
302
|
|
|
135
|
|
|
307
|
|
|
20
|
|
|
Total real estate - mortgage
|
|
|
7,499
|
|
|
7,499
|
|
|
1,921
|
|
|
7,585
|
|
|
236
|
|
|
Total with allowance recorded
|
|
|
16,357
|
|
|
16,944
|
|
|
3,511
|
|
|
15,871
|
|
|
480
|
|
|
|
|
|
|
|
|
|
|
|
|
|
|
|
|
|
|
|
|
Total Impaired Loans:
|
|
|
|
|
|
|
|
|
|
|
|
|
|
|
|
|
|
Commercial, financial
|
|
|
|
|
|
|
|
|
|
|
|
|
|
|
|
|
|
and agricultural
|
|
|
3,910
|
|
|
4,164
|
|
|
577
|
|
|
3,638
|
|
|
195
|
|
|
Real estate - construction
|
|
|
14,422
|
|
|
16,031
|
|
|
1,013
|
|
|
14,592
|
|
|
342
|
|
|
Real estate - mortgage:
|
|
|
|
|
|
|
|
|
|
|
|
|
|
|
|
|
|
Owner-occupied commercial
|
|
|
8,306
|
|
|
8,556
|
|
|
779
|
|
|
8,688
|
|
|
222
|
|
|
1-4 family mortgage
|
|
|
6,168
|
|
|
6,390
|
|
|
1,007
|
|
|
6,178
|
|
|
247
|
|
|
Other mortgage
|
|
|
4,453
|
|
|
4,551
|
|
|
135
|
|
|
4,513
|
|
|
295
|
|
|
Total real estate - mortgage
|
|
|
18,927
|
|
|
19,497
|
|
|
1,921
|
|
|
19,379
|
|
|
764
|
|
|
Consumer
|
|
|
135
|
|
|
344
|
|
|
-
|
|
|
296
|
|
|
6
|
|
|
Total impaired loans
|
|
$
|
37,394
|
|
$
|
40,036
|
|
$
|
3,511
|
|
$
|
37,905
|
|
$
|
1,307
|
|
| 89 | ||
|
|
December 31, 2013
|
|
December 31, 2012
|
|
||||||||||||||
|
|
|
|
|
Pre-
|
|
Post-
|
|
|
|
|
Pre-
|
|
Post-
|
|
||||
|
|
|
|
|
Modification
|
|
Modification
|
|
|
|
|
Modification
|
|
Modification
|
|
||||
|
|
|
|
|
Outstanding
|
|
Outstanding
|
|
|
|
|
Outstanding
|
|
Outstanding
|
|
||||
|
|
Number of
|
|
Recorded
|
|
Recorded
|
|
Number of
|
|
Recorded
|
|
Recorded
|
|
||||||
|
|
Contracts
|
|
Investment
|
|
Investment
|
|
Contracts
|
|
Investment
|
|
Investment
|
|
||||||
|
|
(In Thousands)
|
|
||||||||||||||||
|
Troubled Debt Restructurings
|
|
|
|
|
|
|
|
|
|
|
|
|
|
|
|
|
|
|
|
Commercial, financial and
|
|
|
|
|
|
|
|
|
|
|
|
|
|
|
|
|
|
|
|
agricultural
|
|
5
|
|
$
|
2,029
|
|
$
|
2,029
|
|
|
2
|
|
$
|
1,168
|
|
$
|
1,168
|
|
|
Real estate - construction
|
|
7
|
|
|
1,781
|
|
|
1,781
|
|
|
15
|
|
|
3,213
|
|
|
3,213
|
|
|
Real estate - mortgage:
|
|
|
|
|
|
|
|
|
|
|
|
|
|
|
|
|
|
|
|
Owner-occupied
|
|
|
|
|
|
|
|
|
|
|
|
|
|
|
|
|
|
|
|
commercial
|
|
-
|
|
|
-
|
|
|
-
|
|
|
6
|
|
|
5,907
|
|
|
5,907
|
|
|
1-4 family mortgage
|
|
4
|
|
|
10,073
|
|
|
10,073
|
|
|
5
|
|
|
1,709
|
|
|
1,709
|
|
|
Other mortgage
|
|
1
|
|
|
285
|
|
|
285
|
|
|
1
|
|
|
302
|
|
|
302
|
|
|
Total real estate mortgage
|
|
5
|
|
|
10,358
|
|
|
10,358
|
|
|
12
|
|
|
7,918
|
|
|
7,918
|
|
|
Consumer
|
|
-
|
|
|
-
|
|
|
-
|
|
|
-
|
|
|
-
|
|
|
-
|
|
|
|
|
17
|
|
$
|
14,168
|
|
$
|
14,168
|
|
|
29
|
|
$
|
12,299
|
|
$
|
12,299
|
|
|
|
|
|
|
|
|
|
|
|
|
|
|
|
|
|
|
|
|
|
|
|
Number of
|
|
Recorded
|
|
|
|
|
Number of
|
|
Recorded
|
|
|
|
|
||||
|
|
Contracts
|
|
Investment
|
|
|
|
|
Contracts
|
|
Investment
|
|
|
|
|
||||
|
|
|
|
|
|
|
|
|
|
|
|
|
|
|
|
|
|
|
|
|
Troubled Debt Restructurings
|
|
|
|
|
|
|
|
|
|
|
|
|
|
|
|
|
|
|
|
That Subsequently Defaulted
|
|
|
|
|
|
|
|
|
|
|
|
|
|
|
|
|
|
|
|
Commercial, financial and
|
|
|
|
|
|
|
|
|
|
|
|
|
|
|
|
|
|
|
|
agricultural
|
|
3
|
|
$
|
1,067
|
|
|
|
|
|
-
|
|
$
|
-
|
|
|
|
|
|
Real estate - construction
|
|
6
|
|
|
1,564
|
|
|
|
|
|
-
|
|
|
-
|
|
|
|
|
|
Real estate - mortgage:
|
|
|
|
|
|
|
|
|
|
|
|
|
|
|
|
|
|
|
|
Owner-occupied
|
|
|
|
|
|
|
|
|
|
|
|
|
|
|
|
|
|
|
|
commercial
|
|
-
|
|
|
-
|
|
|
|
|
|
3
|
|
|
2,786
|
|
|
|
|
|
1-4 family mortgage
|
|
2
|
|
|
1,848
|
|
|
|
|
|
-
|
|
|
-
|
|
|
|
|
|
Other mortgage
|
|
-
|
|
|
-
|
|
|
|
|
|
-
|
|
|
-
|
|
|
|
|
|
Total real estate - mortgage
|
|
2
|
|
|
1,848
|
|
|
|
|
|
3
|
|
|
2,786
|
|
|
|
|
|
Consumer
|
|
-
|
|
|
-
|
|
|
|
|
|
-
|
|
|
-
|
|
|
|
|
|
|
|
11
|
|
$
|
4,479
|
|
|
|
|
|
3
|
|
$
|
2,786
|
|
|
|
|
|
|
|
Years Ended December 31,
|
|
||||
|
|
|
2013
|
|
2012
|
|
||
|
|
|
(In Thousands)
|
|
||||
|
Balance, beginning of year
|
|
$
|
12,400
|
|
$
|
9,047
|
|
|
Advances
|
|
|
4,975
|
|
|
7,630
|
|
|
Repayments
|
|
|
(4,258)
|
|
|
(8,096)
|
|
|
Participations
|
|
|
-
|
|
|
3,819
|
|
|
Balance, end of year
|
|
$
|
13,117
|
|
$
|
12,400
|
|
| 90 | ||
|
|
|
2013
|
|
2012
|
|
2011
|
|
|||
|
Balance at beginning of year
|
|
$
|
9,685
|
|
$
|
12,275
|
|
$
|
6,966
|
|
|
Transfers from loans and capitalized expenses
|
|
|
11,244
|
|
|
2,695
|
|
|
9,029
|
|
|
Foreclosed properties sold
|
|
|
(7,664)
|
|
|
(2,967)
|
|
|
(3,334)
|
|
|
Writedowns and partial liquidations
|
|
|
(593)
|
|
|
(2,318)
|
|
|
(386)
|
|
|
Balance at end of year
|
|
$
|
12,672
|
|
$
|
9,685
|
|
$
|
12,275
|
|
|
|
|
December 31,
|
|
||||
|
|
|
2013
|
|
2012
|
|
||
|
|
|
|
|
|
|
|
|
|
Land and building
|
|
$
|
1,724
|
|
$
|
1,724
|
|
|
Furniture and equipment
|
|
|
9,579
|
|
|
8,642
|
|
|
Leasehold improvements
|
|
|
5,131
|
|
|
4,742
|
|
|
|
|
|
16,434
|
|
|
15,108
|
|
|
Accumulated depreciation
|
|
|
(8,083)
|
|
|
(6,261)
|
|
|
|
|
$
|
8,351
|
|
$
|
8,847
|
|
|
|
|
|
(In Thousands)
|
|
|
2014
|
|
$
|
2,453
|
|
|
2015
|
|
|
2,462
|
|
|
2016
|
|
|
2,429
|
|
|
2017
|
|
|
2,164
|
|
|
2018
|
|
|
1,934
|
|
|
Thereafter
|
|
|
4,622
|
|
|
|
|
$
|
16,064
|
|
| 91 | ||
|
|
|
December 31,
|
|
||||
|
|
|
2013
|
|
2012
|
|
||
|
|
|
(In Thousands)
|
|
||||
|
Noninterest-bearing demand
|
|
$
|
650,456
|
|
$
|
545,174
|
|
|
Interest-bearing checking
|
|
|
1,930,676
|
|
|
1,551,158
|
|
|
Savings
|
|
|
23,890
|
|
|
19,560
|
|
|
Time
|
|
|
70,316
|
|
|
69,179
|
|
|
Time, $100,000 and over
|
|
|
344,304
|
|
|
326,501
|
|
|
|
|
$
|
3,019,642
|
|
$
|
2,511,572
|
|
|
|
|
(In Thousands)
|
|
|
|
2014
|
|
$
|
260,487
|
|
|
2015
|
|
|
52,887
|
|
|
2016
|
|
|
53,911
|
|
|
2017
|
|
|
16,828
|
|
|
2018
|
|
|
30,507
|
|
|
|
|
$
|
414,620
|
|
| 92 | ||
|
|
NOTE 11.
|
PARTICIPATION IN THE SMALL BUSINESS LENDING FUND OF THE U.S. TREASURY DEPARTMENT
|
| 93 | ||
|
|
|
2013
|
|
|
2012
|
|
|
2011
|
|
|
|
Expected volatility
|
|
18.65
|
%
|
|
19.80
|
%
|
|
26.50
|
%
|
|
|
Expected dividends
|
|
-
|
%
|
|
-
|
%
|
|
0.37
|
%
|
|
|
Expected term (in years)
|
|
7
|
|
|
6
|
|
|
7
|
|
|
|
Risk-free rate
|
|
1.72
|
%
|
|
1.05
|
%
|
|
2.21
|
%
|
|
| 94 | ||
|
|
|
Shares
|
|
Weighted
Average Exercise Price |
|
Weighted
Average Remaining Contractual Term (years) |
|
Aggregate
Intrinsic Value |
|
||
|
|
|
|
|
|
|
|
|
|
(In Thousands)
|
|
|
|
Year Ended December 31, 2013:
|
|
|
|
|
|
|
|
|
|
|
|
|
Outstanding at beginning of year
|
|
816,500
|
|
$
|
20.87
|
|
5.8
|
|
$
|
9,905
|
|
|
Granted
|
|
60,000
|
|
|
37.96
|
|
9.7
|
|
|
213
|
|
|
Exercised
|
|
(94,200)
|
|
|
13.44
|
|
2.8
|
|
|
2,532
|
|
|
Forfeited
|
|
(6,000)
|
|
|
22.50
|
|
5.6
|
|
|
-
|
|
|
Outstanding at end of year
|
|
776,300
|
|
$
|
23.08
|
|
5.5
|
|
$
|
14,300
|
|
|
|
|
|
|
|
|
|
|
|
|
|
|
|
Exercisable at December 31, 2013:
|
|
387,244
|
|
$
|
16.20
|
|
3.2
|
|
$
|
9,797
|
|
|
|
|
|
|
|
|
|
|
|
|
|
|
|
Year Ended December 31, 2012:
|
|
|
|
|
|
|
|
|
|
|
|
|
Outstanding at beginning of year
|
|
1,073,800
|
|
$
|
18.33
|
|
6.0
|
|
$
|
12,508
|
|
|
Granted
|
|
45,500
|
|
|
30.00
|
|
9.3
|
|
|
130
|
|
|
Exercised
|
|
(288,130)
|
|
|
12.71
|
|
2.4
|
|
|
5,846
|
|
|
Forfeited
|
|
(14,670)
|
|
|
24.54
|
|
-
|
|
|
-
|
|
|
Outstanding at end of year
|
|
816,500
|
|
$
|
20.87
|
|
5.8
|
|
$
|
9,905
|
|
|
|
|
|
|
|
|
|
|
|
|
|
|
|
Exercisable at December 31, 2012
|
|
412,825
|
|
$
|
14.03
|
|
3.6
|
|
$
|
7,831
|
|
|
|
|
|
|
|
|
|
|
|
|
|
|
|
Year Ended December 31, 2011:
|
|
|
|
|
|
|
|
|
|
|
|
|
Outstanding at beginning of year
|
|
881,000
|
|
$
|
15.65
|
|
6.9
|
|
$
|
8,238
|
|
|
Granted
|
|
233,500
|
|
|
27.16
|
|
9.3
|
|
|
-
|
|
|
Exercised
|
|
(40,700)
|
|
|
10.53
|
|
3.8
|
|
|
792
|
|
|
Forfeited
|
|
-
|
|
|
15.00
|
|
-
|
|
|
-
|
|
|
Outstanding at end of year
|
|
1,073,800
|
|
$
|
18.33
|
|
6.0
|
|
$
|
12,508
|
|
|
|
|
|
|
|
|
|
|
|
|
|
|
|
Exercisable at December 31, 2011
|
|
442,940
|
|
$
|
13.19
|
|
4.4
|
|
$
|
7,447
|
|
|
Range of
Exercise Price |
|
Shares
|
|
Weighted
Average Exercise Price |
|
Weighted
Average Remaining Contractual Term (years) |
|
Aggregate
Intrinsic Value |
|
|||
|
|
|
|
|
|
|
|
|
|
|
(In Thousands)
|
|
|
|
$
|
10.00
|
|
33,000
|
|
$
|
10.00
|
|
1.4
|
|
$
|
1,040
|
|
|
|
11.00
|
|
108,000
|
|
|
11.00
|
|
2.3
|
|
|
3,294
|
|
|
|
15.00
|
|
113,500
|
|
|
15.00
|
|
3.0
|
|
|
3,008
|
|
|
|
20.00
|
|
52,994
|
|
|
20.00
|
|
4.1
|
|
|
1,139
|
|
|
|
25.00
|
|
79,750
|
|
|
25.00
|
|
4.7
|
|
|
1,316
|
|
|
|
|
|
387,244
|
|
$
|
16.20
|
|
3.2
|
|
$
|
9,797
|
|
| 95 | ||
| 96 | ||
|
|
|
Actual
|
|
|
For Capital Adequacy
Purposes |
|
|
To Be Well Capitalized Under
Prompt Corrective Action Provisions |
|
|
|||||||||
|
|
|
Amount
|
|
Ratio
|
|
|
Amount
|
|
Ratio
|
|
|
Amount
|
|
Ratio
|
|
|
|||
|
As of December 31, 2013:
|
|
|
|
|
|
|
|
|
|
|
|
|
|
|
|
|
|
|
|
|
Total Capital to Risk
Weighted Assets: |
|
|
|
|
|
|
|
|
|
|
|
|
|
|
|
|
|
|
|
|
Consolidated
|
|
$
|
343,904
|
|
11.73
|
%
|
|
$
|
234,617
|
|
8.00
|
%
|
|
|
N/A
|
|
N/A
|
|
|
|
ServisFirst Bank
|
|
|
341,256
|
|
11.64
|
%
|
|
|
234,601
|
|
8.00
|
%
|
|
$
|
293,252
|
|
10.00
|
%
|
|
|
Tier I Capital to Risk
Weighted Assets: |
|
|
|
|
|
|
|
|
|
|
|
|
|
|
|
|
|
|
|
|
Consolidated
|
|
|
293,301
|
|
10.00
|
%
|
|
|
117,308
|
|
4.00
|
%
|
|
|
N/A
|
|
N/A
|
|
|
|
ServisFirst Bank
|
|
|
310,593
|
|
10.59
|
%
|
|
|
117,301
|
|
4.00
|
%
|
|
|
175,951
|
|
6.00
|
%
|
|
|
Tier I Capital to Average
Assets: |
|
|
|
|
|
|
|
|
|
|
|
|
|
|
|
|
|
|
|
|
Consolidated
|
|
|
293,301
|
|
8.48
|
%
|
|
|
138,373
|
|
4.00
|
%
|
|
|
N/A
|
|
N/A
|
|
|
|
ServisFirst Bank
|
|
|
310,593
|
|
8.98
|
%
|
|
|
138,331
|
|
4.00
|
%
|
|
|
172,913
|
|
5.00
|
%
|
|
|
|
|
|
|
|
|
|
|
|
|
|
|
|
|
|
|
|
|
|
|
|
As of December 31, 2012:
|
|
|
|
|
|
|
|
|
|
|
|
|
|
|
|
|
|
|
|
|
Total Capital to Risk
Weighted Assets: |
|
|
|
|
|
|
|
|
|
|
|
|
|
|
|
|
|
|
|
|
Consolidated
|
|
$
|
287,136
|
|
11.78
|
%
|
|
$
|
194,943
|
|
8.00
|
%
|
|
|
N/A
|
|
N/A
|
|
|
|
ServisFirst Bank
|
|
|
284,141
|
|
11.66
|
%
|
|
|
194,942
|
|
8.00
|
%
|
|
$
|
243,678
|
|
10.00
|
%
|
|
|
Tier I Capital to Risk
Weighted Assets: |
|
|
|
|
|
|
|
|
|
|
|
|
|
|
|
|
|
|
|
|
Consolidated
|
|
|
240,961
|
|
9.89
|
%
|
|
|
97,472
|
|
4.00
|
%
|
|
|
N/A
|
|
N/A
|
|
|
|
ServisFirst Bank
|
|
|
257,883
|
|
10.58
|
%
|
|
|
97,471
|
|
4.00
|
%
|
|
|
146,207
|
|
6.00
|
%
|
|
|
Tier I Capital to Average
Assets: |
|
|
|
|
|
|
|
|
|
|
|
|
|
|
|
|
|
|
|
|
Consolidated
|
|
|
240,961
|
|
8.43
|
%
|
|
|
114,323
|
|
4.00
|
%
|
|
|
N/A
|
|
N/A
|
|
|
|
ServisFirst Bank
|
|
|
257,883
|
|
9.03
|
%
|
|
|
114,227
|
|
4.00
|
%
|
|
|
142,784
|
|
5.00
|
%
|
|
|
|
|
Years Ended December 31,
|
|
|||||||
|
|
|
2013
|
|
2012
|
|
2011
|
|
|||
|
|
|
(In Thousands)
|
|
|||||||
|
Other Operating Income
|
|
|
|
|
|
|
|
|
|
|
|
(Loss) gain on sale of other real estate owned
|
|
$
|
(159)
|
|
$
|
(105)
|
|
$
|
76
|
|
|
Credit card income
|
|
|
1,425
|
|
|
1,064
|
|
|
481
|
|
|
Other
|
|
|
878
|
|
|
744
|
|
|
650
|
|
|
|
|
$
|
2,144
|
|
$
|
1,703
|
|
$
|
1,207
|
|
|
|
|
|
|
|
|
|
|
|
|
|
|
Other Operating Expenses
|
|
|
|
|
|
|
|
|
|
|
|
Postage
|
|
$
|
195
|
|
$
|
159
|
|
$
|
194
|
|
|
Telephone
|
|
|
465
|
|
|
385
|
|
|
409
|
|
|
Data processing
|
|
|
2,535
|
|
|
2,202
|
|
|
2,023
|
|
|
Other loan expenses
|
|
|
1,882
|
|
|
2,836
|
|
|
2,406
|
|
|
Supplies
|
|
|
380
|
|
|
320
|
|
|
356
|
|
|
Customer and public relations
|
|
|
838
|
|
|
791
|
|
|
689
|
|
|
Marketing
|
|
|
532
|
|
|
454
|
|
|
406
|
|
|
Sales and use tax
|
|
|
309
|
|
|
198
|
|
|
208
|
|
|
Donations and contributions
|
|
|
370
|
|
|
482
|
|
|
437
|
|
|
Directors fees
|
|
|
341
|
|
|
286
|
|
|
235
|
|
|
Prepayment penalties FHLB advances
|
|
|
-
|
|
|
-
|
|
|
738
|
|
|
Other
|
|
|
3,082
|
|
|
2,609
|
|
|
2,313
|
|
|
|
|
$
|
10,929
|
|
$
|
10,722
|
|
$
|
10,414
|
|
| 97 | ||
|
|
|
Year Ended December 31,
|
|
|||||||
|
|
|
2013
|
|
2012
|
|
2011
|
|
|||
|
|
|
(In Thousands)
|
|
|||||||
|
Current tax expense:
|
|
|
|
|
|
|
|
|
|
|
|
Federal
|
|
$
|
21,264
|
|
$
|
17,993
|
|
$
|
12,045
|
|
|
State
|
|
|
899
|
|
|
1,308
|
|
|
1,584
|
|
|
Total current tax expense
|
|
|
22,163
|
|
|
19,301
|
|
|
13,629
|
|
|
Deferred tax expense (benefit):
|
|
|
|
|
|
|
|
|
|
|
|
Federal
|
|
|
(1,616)
|
|
|
(1,999)
|
|
|
(1,100)
|
|
|
State
|
|
|
(189)
|
|
|
(182)
|
|
|
(140)
|
|
|
Total deferred tax expense
|
|
|
(1,805)
|
|
|
(2,181)
|
|
|
(1,240)
|
|
|
Total income tax expense
|
|
$
|
20,358
|
|
$
|
17,120
|
|
$
|
12,389
|
|
|
|
|
Year Ended December 31, 2013
|
|
|||
|
|
|
Amount
|
|
% of Pre-tax
Earnings |
|
|
|
|
|
(In Thousands)
|
|
|
|
|
|
Income tax at statutory federal rate
|
|
$
|
21,691
|
|
35.00
|
%
|
|
Effect on rate of:
|
|
|
|
|
|
|
|
State income tax, net of federal tax effect
|
|
|
558
|
|
0.90
|
%
|
|
Tax-exempt income, net of expenses
|
|
|
(1,200)
|
|
(1.94)
|
%
|
|
Bank owned life insurance contracts
|
|
|
(698)
|
|
(1.13)
|
%
|
|
Incentive stock option expense
|
|
|
66
|
|
0.11
|
%
|
|
Other
|
|
|
(59)
|
|
(0.09)
|
%
|
|
Effective income tax and rate
|
|
$
|
20,358
|
|
32.85
|
%
|
|
|
|
|
|
|
|
|
|
|
|
Year Ended December 31, 2012
|
|
|||
|
|
|
Amount
|
|
% of Pre-tax
Earnings |
|
|
|
|
|
(In Thousands)
|
|
|
|
|
|
Income tax at statutory federal rate
|
|
$
|
18,047
|
|
35.00
|
%
|
|
Effect on rate of:
|
|
|
|
|
|
|
|
State income tax, net of federal tax effect
|
|
|
709
|
|
1.37
|
%
|
|
Tax-exempt income, net of expenses
|
|
|
(1,007)
|
|
(1.95)
|
%
|
|
Bank owned life insurance contracts
|
|
|
(568)
|
|
(1.10)
|
%
|
|
Incentive stock option expense
|
|
|
121
|
|
0.23
|
%
|
|
Other
|
|
|
(182)
|
|
(0.35)
|
%
|
|
Effective income tax and rate
|
|
$
|
17,120
|
|
33.20
|
%
|
|
|
|
|
|
|
|
|
|
|
|
Year Ended December 31, 2011
|
|
|||
|
|
|
Amount
|
|
% of Pre-tax
Earnings |
|
|
|
|
|
(In Thousands)
|
|
|
|
|
|
Income tax at statutory federal rate
|
|
$
|
12,540
|
|
35.00
|
%
|
|
Effect on rate of:
|
|
|
|
|
|
|
|
State income tax, net of federal tax effect
|
|
|
967
|
|
2.70
|
%
|
|
Tax-exempt income, net of expenses
|
|
|
(875)
|
|
(2.44)
|
%
|
|
Bank owned life insurance contracts
|
|
|
(137)
|
|
(0.38)
|
%
|
|
Incentive stock option expense
|
|
|
128
|
|
0.36
|
%
|
|
Other
|
|
|
(234)
|
|
(0.65)
|
%
|
|
Effective income tax and rate
|
|
$
|
12,389
|
|
34.59
|
%
|
| 98 | ||
|
|
|
December 31,
|
|||||
|
|
|
2013
|
|
2012
|
|
||
|
|
|
|
|
|
|
|
|
|
|
|
(In Thousands)
|
|||||
|
Deferred tax assets:
|
|
|
|
|
|
|
|
|
Allowance for loan losses
|
|
$
|
11,844
|
|
$
|
10,142
|
|
|
Other real estate owned
|
|
|
1,222
|
|
|
1,064
|
|
|
Nonqualified equity awards
|
|
|
773
|
|
|
583
|
|
|
Nonaccrual interest
|
|
|
374
|
|
|
491
|
|
|
Other deferred tax assets
|
|
|
141
|
|
|
114
|
|
|
Total deferred tax assets
|
|
|
14,354
|
|
|
12,394
|
|
|
|
|
|
|
|
|
|
|
|
Deferred tax liabilities:
|
|
|
|
|
|
|
|
|
Net unrealized gain on securities available for sale
|
|
|
2,102
|
|
|
3,929
|
|
|
Depreciation
|
|
|
514
|
|
|
510
|
|
|
Prepaid expenses
|
|
|
161
|
|
|
140
|
|
|
Deferred loan fees
|
|
|
83
|
|
|
237
|
|
|
Investments
|
|
|
229
|
|
|
93
|
|
|
Other deferred tax liabilities
|
|
|
247
|
|
|
99
|
|
|
Total deferred tax liabilities
|
|
|
3,336
|
|
|
5,008
|
|
|
Net deferred income tax assets
|
|
$
|
11,018
|
|
$
|
7,386
|
|
|
|
|
2013
|
|
2012
|
|
2011
|
|
|||
|
|
|
|
|
|
|
|
|
|
|
|
|
|
|
(In Thousands)
|
|
|||||||
|
Balance, beginning of year
|
|
$
|
161
|
|
$
|
-
|
|
$
|
-
|
|
|
Increases related to prior year tax positions
|
|
|
276
|
|
|
-
|
|
|
-
|
|
|
Decreases related to prior year tax positions
|
|
|
-
|
|
|
-
|
|
|
-
|
|
|
Increases related to current year tax positions
|
|
|
-
|
|
|
161
|
|
|
-
|
|
|
Settlements
|
|
|
-
|
|
|
-
|
|
|
-
|
|
|
Lapse of statute
|
|
|
-
|
|
|
-
|
|
|
-
|
|
|
Balance, end of year
|
|
$
|
437
|
|
$
|
161
|
|
$
|
-
|
|
| 99 | ||
|
|
|
2013
|
|
2012
|
|
2011
|
|
|||
|
|
|
(In Thousands)
|
|
|||||||
|
Commitments to extend credit
|
|
$
|
1,052,902
|
|
$
|
860,421
|
|
$
|
697,939
|
|
|
Credit card arrangements
|
|
|
38,122
|
|
|
25,699
|
|
|
19,686
|
|
|
Standby letters of credit and
|
|
|
|
|
|
|
|
|
|
|
|
financial guarantees
|
|
|
40,371
|
|
|
36,374
|
|
|
42,937
|
|
|
Total
|
|
$
|
1,131,395
|
|
$
|
922,494
|
|
$
|
760,562
|
|
| 100 | ||
|
|
|
Years Ended December 31,
|
|
|||||||
|
|
|
2013
|
|
2012
|
|
2011
|
|
|||
|
|
|
|
|
|
|
|
|
|
|
|
|
|
|
(Dollar Amounts In Thousands Except Per Share Amounts)
|
|
|||||||
|
Earnings Per Share
|
|
|
|
|
|
|
|
|
|
|
|
Weighted average common shares outstanding
|
|
|
6,869,071
|
|
|
5,996,437
|
|
|
5,759,524
|
|
|
Net income available to common stockholders
|
|
$
|
41,201
|
|
$
|
34,045
|
|
$
|
23,238
|
|
|
Basic earnings per common share
|
|
$
|
6.00
|
|
$
|
5.68
|
|
|
4.03
|
|
|
|
|
|
|
|
|
|
|
|
|
|
|
Weighted average common shares outstanding
|
|
|
6,869,071
|
|
|
5,996,437
|
|
|
5,759,524
|
|
|
Dilutive effects of assumed conversions and
|
|
|
|
|
|
|
|
|
|
|
|
exercise of stock options and warrants
|
|
|
399,604
|
|
|
945,315
|
|
|
989,639
|
|
|
Weighted average common and dilutive potential
|
|
|
|
|
|
|
|
|
|
|
|
common shares outstanding
|
|
|
7,268,675
|
|
|
6,941,752
|
|
|
6,749,163
|
|
|
Net income available to common stockholders
|
|
$
|
41,201
|
|
$
|
34,045
|
|
$
|
23,238
|
|
|
Effect of interest expense on convertible debt, net of tax
|
|
|
|
|
|
|
|
|
|
|
|
and discretionary expenditures related to conversion
|
|
$
|
115
|
|
$
|
569
|
|
$
|
568
|
|
|
Net income available to common stockholders, adjusted
|
|
|
|
|
|
|
|
|
|
|
|
for effect of debt conversion
|
|
$
|
41,316
|
|
$
|
34,614
|
|
$
|
23,806
|
|
|
Diluted earnings per common share
|
|
$
|
5.69
|
|
$
|
4.99
|
|
$
|
3.53
|
|
|
NOTE 22.
|
FAIR VALUE MEASUREMENT
|
| 101 | ||
| 102 | ||
|
|
|
|
|
Fair Value Measurements at December 31, 2013 Using
|
|
||||||||
|
|
|
Quoted Prices in
|
|
|
|
|
|
|
|
||||
|
|
|
Active Markets
|
|
Significant Other
|
|
Significant
|
|
|
|
||||
|
|
|
for Identical
|
|
Observable Inputs
|
|
Unobservable
|
|
|
|
||||
|
|
|
Assets (Level 1)
|
|
(Level 2)
|
|
Inputs (Level 3)
|
|
Total
|
|
||||
|
|
|
(In Thousands)
|
|
||||||||||
|
Assets Measured on a Recurring Basis:
|
|
|
|
||||||||||
|
Available-for-sale securities:
|
|
|
|
|
|
|
|
|
|
|
|
|
|
|
U.S. Treasury and government sponsored
agencies |
|
$
|
-
|
|
$
|
32,274
|
|
$
|
-
|
|
$
|
32,274
|
|
|
Mortgage-backed securities
|
|
|
-
|
|
|
88,240
|
|
|
-
|
|
|
88,240
|
|
|
State and municipal securities
|
|
|
-
|
|
|
129,831
|
|
|
-
|
|
|
129,831
|
|
|
Corporate debt
|
|
|
-
|
|
|
15,875
|
|
|
-
|
|
|
15,875
|
|
|
Total assets at fair value
|
|
$
|
-
|
|
$
|
266,220
|
|
$
|
-
|
|
$
|
266,220
|
|
|
|
|
|
|
|
Fair Value Measurements at December 31, 2012 Using
|
|
|||||||
|
|
|
Quoted Prices in
|
|
|
|
|
|
|
|||||
|
|
|
Active Markets
|
|
Significant Other
|
|
Significant
|
|
|
|
||||
|
|
|
for Identical
|
|
Observable Inputs
|
|
Unobservable
|
|
|
|
||||
|
|
|
Assets (Level 1)
|
|
(Level 2)
|
|
Inputs (Level 3)
|
|
Total
|
|
||||
|
|
|
(In Thousands)
|
|
||||||||||
|
Assets Measured on a Recurring Basis:
|
|
|
|
||||||||||
|
Available-for-sale securities
|
|
|
|
|
|
|
|
|
|
|
|
|
|
|
U.S. Treasury and government sponsored
agencies |
|
$
|
-
|
|
$
|
28,386
|
|
$
|
-
|
|
$
|
28,386
|
|
|
Mortgage-backed securities
|
|
|
-
|
|
|
73,466
|
|
|
-
|
|
|
73,466
|
|
|
State and municipal securities
|
|
|
-
|
|
|
118,177
|
|
|
-
|
|
|
118,177
|
|
|
Corporate debt
|
|
|
-
|
|
|
13,848
|
|
|
-
|
|
|
13,848
|
|
|
Interest rate swap agreements
|
|
|
-
|
|
|
389
|
|
|
-
|
|
|
389
|
|
|
Total assets at fair value
|
|
$
|
-
|
|
$
|
234,266
|
|
$
|
-
|
|
$
|
234,266
|
|
|
|
|
|
|
|
|
|
|
|
|
|
|
|
|
|
Liabilities Measured on a Recurring Basis:
|
|
|
|
|
|
|
|
|
|
|
|
|
|
|
Interest rate swap agreements
|
|
$
|
-
|
|
$
|
389
|
|
$
|
-
|
|
$
|
389
|
|
| 103 | ||
|
|
|
|
|
|
Fair Value Measurements at December 31, 2013 Using
|
|
||||||
|
|
|
Quoted Prices in
|
|
|
|
|
|
|
||||
|
|
|
Active Markets
|
Significant Other
|
|
Significant
|
|
|
|
||||
|
|
|
for Identical
|
Observable
|
|
Unobservable
|
|
|
|
||||
|
|
|
Assets (Level 1)
|
|
Inputs (Level 2)
|
|
Inputs (Level 3)
|
|
Total
|
|
|||
|
|
|
(In Thousands)
|
|
|||||||||
|
Assets Measured on a Nonrecurring Basis:
|
|
|
|
|||||||||
|
Impaired loans
|
|
$
|
-
|
|
-
|
|
$
|
25,696
|
|
$
|
25,696
|
|
|
Other real estate owned and repossessed assets
|
|
|
-
|
|
-
|
|
|
12,861
|
|
|
12,861
|
|
|
Total assets at fair value
|
|
|
-
|
|
-
|
|
$
|
38,557
|
|
$
|
38,557
|
|
|
|
|
|
|
Fair Value Measurements at December 31, 2012 Using
|
|
||||||||
|
|
|
Quoted Prices in
|
|
|
|
|
|
|
|
|
|
||
|
|
|
Active Markets
|
|
Significant Other
|
|
Significant
|
|
|
|
|
|||
|
|
|
for Identical
|
|
Observable
|
|
Unobservable
|
|
|
|
||||
|
|
|
Assets (Level 1)
|
|
Inputs (Level 2)
|
|
Inputs (Level 3)
|
|
Total
|
|
||||
|
|
|
(In Thousands)
|
|
||||||||||
|
Assets Measured on a Nonrecurring Basis:
|
|
|
|
||||||||||
|
Impaired loans
|
|
$
|
-
|
|
$
|
-
|
|
$
|
33,883
|
|
$
|
33,883
|
|
|
Other real estate owned
|
|
|
-
|
|
|
-
|
|
|
9,721
|
|
|
9,721
|
|
|
Total assets at fair value
|
|
$
|
-
|
|
$
|
-
|
|
$
|
43,604
|
|
$
|
43,604
|
|
| 104 | ||
| 105 | ||
|
|
|
December 31,
|
|
||||||||||
|
|
|
2013
|
|
2012
|
|
||||||||
|
|
|
Carrying
Amount |
|
Fair Value
|
|
Carrying Amount
|
|
Fair Value
|
|
||||
|
|
|
|
|
|
|
|
|
|
|
|
|
|
|
|
|
|
(In Thousands)
|
|
||||||||||
|
Financial Assets:
|
|
|
|
|
|
|
|
|
|
|
|
|
|
|
Level 2 Inputs:
|
|
|
|
|
|
|
|
|
|
|
|
|
|
|
Debt securities available for sale
|
|
$
|
266,220
|
|
$
|
266,220
|
|
$
|
233,877
|
|
$
|
233,877
|
|
|
Debt securities held to maturity
|
|
|
32,274
|
|
|
31,315
|
|
|
25,967
|
|
|
27,350
|
|
|
Restricted equity securities
|
|
|
3,738
|
|
|
3,738
|
|
|
3,941
|
|
|
3,941
|
|
|
Federal funds sold
|
|
|
8,634
|
|
|
8,634
|
|
|
3,291
|
|
|
3,291
|
|
|
Mortgage loans held for sale
|
|
|
8,134
|
|
|
8,134
|
|
|
25,826
|
|
|
25,826
|
|
|
Bank owned life insurance contracts
|
|
|
69,008
|
|
|
69,008
|
|
|
57,014
|
|
|
57,014
|
|
|
Derivatives
|
|
|
-
|
|
|
-
|
|
|
389
|
|
|
389
|
|
|
|
|
|
|
|
|
|
|
|
|
|
|
|
|
|
Level 3 Inputs:
|
|
|
|
|
|
|
|
|
|
|
|
|
|
|
Loans, net
|
|
$
|
2,828,205
|
|
$
|
2,825,924
|
|
$
|
2,336,924
|
|
$
|
2,327,780
|
|
|
|
|
|
|
|
|
|
|
|
|
|
|
|
|
|
Financial Liabilities:
|
|
|
|
|
|
|
|
|
|
|
|
|
|
|
Level 2 Inputs:
|
|
|
|
|
|
|
|
|
|
|
|
|
|
|
Deposits
|
|
$
|
3,019,642
|
|
$
|
3,021,847
|
|
$
|
2,511,572
|
|
$
|
2,516,320
|
|
|
Federal funds purchased
|
|
|
174,380
|
|
|
174,380
|
|
|
117,065
|
|
|
117,065
|
|
|
Other borrowings
|
|
|
19,940
|
|
|
19,940
|
|
|
19,917
|
|
|
19,917
|
|
|
Subordinated debentures
|
|
|
-
|
|
|
-
|
|
|
15,050
|
|
|
15,050
|
|
|
Derivatives
|
|
|
-
|
|
|
-
|
|
|
389
|
|
|
389
|
|
|
|
NOTE 23.
|
PARENT COMPANY FINANCIAL INFORMATION
|
|
CONDENSED BALANCE SHEETS DECEMBER 31, 2013 AND 2012
|
|||||||
|
(In Thousands)
|
|||||||
|
|
|
2013
|
|
2012
|
|
||
|
ASSETS
|
|
|
|
|
|
|
|
|
Cash and due from banks
|
|
$
|
2,562
|
|
$
|
3,264
|
|
|
Investment in subsidiary
|
|
|
314,489
|
|
|
265,229
|
|
|
Other assets
|
|
|
194
|
|
|
18
|
|
|
Total assets
|
|
$
|
317,245
|
|
$
|
268,511
|
|
|
|
|
|
|
|
|
|
|
|
LIABILITIES AND STOCKHOLDERS' EQUITY
|
|
|
|
|
|
|
|
|
Liabilities:
|
|
|
|
|
|
|
|
|
Other borrowings
|
|
$
|
19,940
|
|
$
|
19,917
|
|
|
Subordinated debentures
|
|
|
-
|
|
|
15,050
|
|
|
Other liabilities
|
|
|
113
|
|
|
287
|
|
|
Total liabilities
|
|
|
20,053
|
|
|
35,254
|
|
|
Stockholders' equity:
|
|
|
|
|
|
|
|
|
Preferred stock, Series A Senior Non-Cumulative Perpetual, par value $.001
|
|
|
|
|
|
|
|
|
(liquidation preference $1,000), net of discount; 40,000 shares authorized,
|
|
|
|
|
|
|
|
|
40,000 shares issued and outstanding at December 31, 2013 and 2012
|
|
|
39,958
|
|
|
39,958
|
|
|
Common stock, par value $.001 per share; 50,000,000 shares authorized;
|
|
|
|
|
|
|
|
|
7,350,012 shares issued and outstanding at December 31, 2013 and
|
|
|
|
|
|
|
|
|
6,268,812 shares issued and outstanding at December 31, 2012
|
|
|
7
|
|
|
6
|
|
|
Additional paid-in capital
|
|
|
123,325
|
|
|
93,505
|
|
|
Retained earnings
|
|
|
130,011
|
|
|
92,492
|
|
|
Accumulated other comprehensive income
|
|
|
3,891
|
|
|
7,296
|
|
|
Total stockholders' equity
|
|
|
297,192
|
|
|
233,257
|
|
|
Total liabilities and stockholders' equity
|
|
$
|
317,245
|
|
$
|
268,511
|
|
| 106 | ||
|
CONDENSED STATEMENTS OF INCOME
|
|
|||||||||
|
FOR THE YEARS ENDED DECEMBER 31,
|
|
|||||||||
|
(In Thousands)
|
|
|||||||||
|
|
|
|
|
|
|
|
|
|
|
|
|
|
|
2013
|
|
2012
|
|
2011
|
|
|||
|
Income:
|
|
|
|
|
|
|
|
|
|
|
|
Dividends received from subsidiary
|
|
$
|
4,750
|
|
$
|
-
|
|
$
|
800
|
|
|
Other income
|
|
|
1
|
|
|
41
|
|
|
43
|
|
|
Total income
|
|
|
4,751
|
|
|
41
|
|
|
843
|
|
|
Expense:
|
|
|
|
|
|
|
|
|
|
|
|
Other expenses
|
|
|
1,147
|
|
|
1,594
|
|
|
1,660
|
|
|
Total expenses
|
|
|
1,147
|
|
|
1,594
|
|
|
1,660
|
|
|
Equity in undistributed earnings of subsidiary
|
|
|
38,013
|
|
|
35,998
|
|
|
24,255
|
|
|
Net income
|
|
|
41,617
|
|
|
34,445
|
|
|
23,438
|
|
|
Dividends on preferred stock
|
|
|
400
|
|
|
400
|
|
|
200
|
|
|
Net income available to common stockholders
|
|
|
41,217
|
|
|
34,045
|
|
|
23,238
|
|
|
STATEMENT OF CASH FLOWS
|
|
|||||||||
|
FOR THE YEARS ENDED DECEMBER 31,
|
|
|||||||||
|
(In Thousands)
|
|
|||||||||
|
|
|
|
|
|
|
|
|
|
|
|
|
|
|
2013
|
|
2012
|
|
2011
|
|
|||
|
Operating activities
|
|
|
|
|
|
|
|
|
|
|
|
Net income
|
|
$
|
41,617
|
|
$
|
34,445
|
|
$
|
23,438
|
|
|
Adjustments to reconcile net income to net cash used
in operating activities: |
|
|
|
|
|
|
|
|
|
|
|
Other
|
|
|
(224)
|
|
|
878
|
|
|
(50)
|
|
|
Equity in undistributed earnings of subsidiary
|
|
|
(38,013)
|
|
|
(35,998)
|
|
|
(24,255)
|
|
|
Net cash (used in) provided by operating activities
|
|
|
3,380
|
|
|
(675)
|
|
|
(867)
|
|
|
Investing activities
|
|
|
|
|
|
|
|
|
|
|
|
Investment in subsidiary
|
|
|
(10,499)
|
|
|
-
|
|
|
(46,200)
|
|
|
Net cash used in investing activities
|
|
|
(10,499)
|
|
|
-
|
|
|
(46,200)
|
|
|
Financing activities
|
|
|
|
|
|
|
|
|
|
|
|
Proceeds from other borrowings
|
|
|
-
|
|
|
19,917
|
|
|
-
|
|
|
Repayment of subordinated debentures
|
|
|
-
|
|
|
(15,464)
|
|
|
-
|
|
|
Proceeds from issuance of preferred stock
|
|
|
-
|
|
|
-
|
|
|
39,958
|
|
|
Proceeds from issuance of common stock
|
|
|
10,499
|
|
|
112
|
|
|
10,166
|
|
|
Dividends on preferred stock
|
|
|
(400)
|
|
|
(400)
|
|
|
(200)
|
|
|
Dividends on common stock
|
|
|
(3,682)
|
|
|
(3,134)
|
|
|
-
|
|
|
Net cash provided by financing activities
|
|
|
6,417
|
|
|
1,031
|
|
|
49,924
|
|
|
(Decrease) increase in cash and cash equivalents
|
|
$
|
(702)
|
|
$
|
356
|
|
$
|
2,857
|
|
|
Cash and cash equivalents at beginning of year
|
|
|
3,264
|
|
|
2,908
|
|
|
51
|
|
|
Cash and cash equivalents at end of year
|
|
$
|
2,562
|
|
$
|
3,264
|
|
$
|
2,908
|
|
| 107 | ||
|
|
|
2013 Quarter Ended
|
|
||||||||||
|
|
|
(Dollars in thousands, except per share data)
|
|
||||||||||
|
|
|
March 31
|
|
June 30
|
|
September 30
|
|
December 31
|
|
||||
|
Interest income
|
|
$
|
29,165
|
|
$
|
30,692
|
|
$
|
32,499
|
|
$
|
33,725
|
|
|
Interest expense
|
|
|
3,264
|
|
|
3,211
|
|
|
3,534
|
|
|
3,610
|
|
|
Net interest income
|
|
|
25,901
|
|
|
27,481
|
|
|
28,965
|
|
|
30,115
|
|
|
Provision for loan losses
|
|
|
4,284
|
|
|
3,334
|
|
|
3,034
|
|
|
2,356
|
|
|
Net income available to common
stockholders |
|
|
9,151
|
|
|
9,586
|
|
|
10,712
|
|
|
11,752
|
|
|
Net income per common share, basic
|
|
$
|
1.44
|
|
$
|
1.39
|
|
$
|
1.53
|
|
$
|
1.64
|
|
|
Net income per common share, diluted
|
|
$
|
1.31
|
|
$
|
1.34
|
|
$
|
1.46
|
|
$
|
1.58
|
|
|
|
|
|
|
|
|
|
|
|
|
|
|
|
|
|
|
|
2012 Quarter Ended
|
|
||||||||||
|
|
|
(Dollars in thousands, except per share data)
|
|
||||||||||
|
|
|
March 31
|
|
June 30
|
|
September 30
|
|
December 31
|
|
||||
|
Interest income
|
|
$
|
25,571
|
|
$
|
26,654
|
|
$
|
27,743
|
|
$
|
29,055
|
|
|
Interest expense
|
|
|
3,833
|
|
|
3,749
|
|
|
3,695
|
|
|
3,624
|
|
|
Net interest income
|
|
|
21,738
|
|
|
22,905
|
|
|
24,048
|
|
|
25,431
|
|
|
Provision for loan losses
|
|
|
2,383
|
|
|
3,083
|
|
|
1,185
|
|
|
2,449
|
|
|
Net income available to common
stockholders |
|
|
8,155
|
|
|
8,231
|
|
|
9,202
|
|
|
8,457
|
|
|
Net income per common share, basic
|
|
$
|
1.37
|
|
$
|
1.38
|
|
$
|
1.53
|
|
$
|
1.40
|
|
|
Net income per common share, diluted
|
|
$
|
1.20
|
|
$
|
1.21
|
|
$
|
1.35
|
|
$
|
1.23
|
|
| ITEM 9. | CHANGES IN AND DISAGREEMENTS WITH ACCOUNTANTS ON ACCOUNTING AND FINANCIAL DISCLOSURE. |
| ITEM 9A. | CONTROLS AND PROCEDURES |
| 108 | ||
| ITEM 9B. | OTHER INFORMATION. |
| ITEM 10. | DIRECTORS, EXECUTIVE OFFICERS AND CORPORATE GOVERNANCE. |
| ITEM 11. | EXECUTIVE COMPENSATION. |
| ITEM 12. | SECURITY OWNERSHIP OF CERTAIN BENEFICIAL OWNERS AND MANAGEMENT AND RELATED STOCKHOLDER MATTERS. |
| ITEM 13. | CERTAIN RELATIONSHIPS AND RELATED TRANSACTIONS, AND DIRECTOR INDEPENDENCE. |
| ITEM 14. | PRINCIPAL ACCOUNTANT FEES AND SERVICES. |
| 109 | ||
| ITEM 15. | FINANCIAL STATEMENT SCHEDULES AND EXHIBITS |
| (a) | The following statements are filed as a part of this Annual Report on Form 10-K |
|
|
Page
|
|
Report of Independent Registered Public Accounting Firm on Consolidated Financial Statements
|
66
|
|
Report of Management on Internal Control over Financial Reporting
|
67
|
|
Report of Independent Registered Public Accounting Firm on Internal Control over Financial Reporting
|
68
|
|
Consolidated Balance Sheets at December 31, 2013 and 2012
|
69
|
|
Consolidated Statements of Income for the Years Ended December 31, 2013, 2012 and 2011
|
70
|
|
Consolidated Statements of Comprehensive Income for the Years Ended December 31, 2013, 2012 and 2011
|
71
|
|
Consolidated Statements of Stockholders' Equity for the Years Ended December 31, 2013, 2012 and 2011
|
72
|
|
Consolidated Statements of Cash Flows for the Years Ended December 31, 2013, 2012 and 2011
|
73
|
|
Notes to Consolidated Financial Statements
|
74
|
|
EXHIBIT NO.
|
|
NAME OF EXHIBIT
|
|
|
|
|
|
2.1
|
|
Plan of Reorganization and Agreement of Merger dated August 29, 2007 (1)
|
|
|
|
|
|
3.1
|
|
Certificate of Incorporation, as amended (Restated for SEC filing purposes only) (2)
|
|
|
|
|
|
3.2
|
|
Bylaws (Restated for SEC filing purposes only) (1)
|
|
|
|
|
|
4.1
|
|
Form of Common Stock Certificate (1)
|
|
|
|
|
|
4.2
|
|
Revised Form of Common Stock Certificate (3)
|
|
|
|
|
|
4.3
|
|
Form of Common Stock Purchase Warrant dated September 2, 2008 (4)
|
|
|
|
|
|
4.4
|
|
Warrant to Purchase Share of Common Stock dated June 23, 2009 (7)
|
|
|
|
|
|
4.5
|
|
Small Business Fund - Securities Purchase Agreement dated June 21, 2011 between the Secretary
|
|
|
|
of the Treasury and ServisFirst Bancshares, Inc. (9)
|
|
|
|
|
|
4.6
|
|
Certificate of Designation of Senior Non-cumulative Perpetual Preferred Stock, Series A of
|
|
|
|
ServisFirst Bancshares, Inc. (9)
|
|
|
|
|
|
4.7
|
|
Note Purchase Agreement, dated November 9, 2012, between ServisFirst Bancshares, Inc. and
|
|
|
|
certain accredited investors (9)
|
|
|
|
|
|
4.8
|
|
Form of 5.50% Subordinated Note due November 9, 2022 (9)
|
|
|
|
|
|
10.1
|
|
2005 Amended and Restated Stock Incentive Plan (1)*
|
|
|
|
|
|
10.2
|
|
Amended and Restated Change in Control Agreement with William M. Foshee dated March 5, 2014 (10)*
|
| 110 | ||
|
10.3
|
|
Amended and Restated Change in Control Agreement with Clarence C. Pouncey III dated March 5, 2014 (10)*
|
|
|
|
|
|
10.4
|
|
Employment Agreement of Andrew N. Kattos dated April 27, 2006 (1)*
|
|
|
|
|
|
10.5
|
|
Employment Agreement of G. Carlton Barker dated February 1, 2007 (1)*
|
|
|
|
|
|
10.6
|
|
2009 Stock Incentive Plan (5)*
|
|
|
|
|
|
11
|
|
Statement Regarding Computation of Earnings Per Share is included herein at Note 20 to the
|
|
|
|
Consolidated Financial Statements in Item 8.
|
|
|
|
|
|
14
|
|
Code of Ethics for Principal Financial Officers (6)
|
|
|
|
|
|
21
|
|
List of Subsidiaries
|
|
|
|
|
|
23
|
|
Consent of KPMG LLP
|
|
|
|
|
|
24
|
|
Power of Attorney
|
|
|
|
|
|
31.1
|
|
Certification of Chief Executive Officer pursuant to Rule 13a-14(a)
|
|
|
|
|
|
31.2
|
|
Certification of Chief Financial Officer pursuant to Rule 13a-14(a)
|
|
|
|
|
|
32.1
|
|
Certification of Chief Executive Officer pursuant to 18 U.S.C. Section 1350
|
|
|
|
|
|
32.2
|
|
Certification of Chief Financial Officer pursuant to 18 U.S.C. Section 1350
|
|
|
|
|
|
101.INS
|
|
XBRL Instance Document
|
|
|
|
|
|
101.SCH
|
|
XBRL Schema Documents
|
|
|
|
|
|
101.CAL
|
|
XBRL Calculation Linkbase Document
|
|
|
|
|
|
101.LAB
|
|
XBRL Label Linkbase Document
|
|
|
|
|
|
101.PRE
|
|
XBRL Presentation Linkbase Document
|
|
|
|
|
|
101.DEF
|
|
XBRL Definition Linkbase Document
|
| 111 | ||
|
|
|
|
SERVISFIRST BANCSHARES, INC.
|
|
|
|
|
|
|
By:
|
/s/Thomas A. Broughton, III
|
|
|
|
|
Thomas A. Broughton, III
|
|
|
|
|
President and Chief Executive Officer
|
|
|
|
Signature
|
|
Title
|
|
Date
|
|
|
|
|
|
|
|
/s/Thomas A. Broughton, III
|
|
President, Chief Executive
|
|
March 17, 2014
|
|
Thomas A. Broughton, III
|
|
Officer and Director (Principal
|
|
|
|
|
|
Executive Officer)
|
|
|
|
|
|
|
|
|
|
/s/ William M. Foshee
|
|
Executive Vice President
|
|
March 17, 2014
|
|
William M. Foshee
|
|
and Chief Financial Officer
|
|
|
|
|
|
(Principal Financial Officer and
|
|
|
|
|
|
Principal Accounting Officer)
|
|
|
|
|
|
|
|
|
|
*
|
|
Chairman of the Board
|
|
March 17, 2014
|
|
Stanley M. Brock
|
|
|
|
|
|
|
|
|
|
|
|
|
|
|
|
|
|
*
|
|
Director
|
|
March 17, 2014
|
|
Michael D. Fuller
|
|
|
|
|
|
|
|
|
|
|
|
*
|
|
Director
|
|
March 17, 2014
|
|
James J. Filler
|
|
|
|
|
|
|
|
|
|
|
|
*
|
|
Director
|
|
March 17, 2014
|
|
Joseph R. Cashio
|
|
|
|
|
|
|
|
|
|
|
|
*
|
|
Director
|
|
March 17, 2014
|
|
Hatton C. V. Smith
|
|
|
|
|
|
/s/ William M. Foshee
|
|
|
William M. Foshee
|
|
|
Attorney-in-Fact
|
|
|
March 17, 2014
|
|
|
EXHIBIT NO.
|
|
NAME OF EXHIBIT
|
|
|
|
|
|
|
|
21
|
|
List of Subsidiaries
|
|
|
|
|
|
|
|
23
|
|
Consent of KPMG LLP
|
|
|
|
|
|
|
|
24
|
|
Power of Attorney
|
|
|
|
|
|
|
|
31.1
|
|
Certification of Chief Executive Officer pursuant to Rule 13a-14(a)
|
|
|
|
|
|
|
|
31.2
|
|
Certification of Chief Financial Officer pursuant to Rule 13a-14(a)
|
|
|
|
|
|
|
|
32.1
|
|
Certification of Chief Executive Officer pursuant to 18 U.S.C. Section 1350
|
|
|
|
|
|
|
|
32.2
|
|
Certification of Chief Financial Officer pursuant to 18 U.S.C. Section 1350
|
|
|
|
|
|
|
|
101.INS
|
|
XBRL Instance Document
|
|
|
|
|
|
|
|
101.SCH
|
|
XBRL Schema Documents
|
|
|
|
|
|
|
|
101.CAL
|
|
XBRL Calculation Linkbase Document
|
|
|
|
|
|
|
|
101.LAB
|
|
XBRL Label Linkbase Document
|
|
|
|
|
|
|
|
101.PRE
|
|
XBRL Presentation Linkbase Document
|
|
|
|
|
|
|
|
101.DEF
|
|
XBRL Definition Linkbase Document
|
|