
UNITED STATES
SECURITIES AND EXCHANGE COMMISSION
WASHINGTON, D.C. 20549
FORM 10-K
(Mark One)
| x | ANNUAL REPORT PURSUANT TO SECTION 13 OR 15(d) OF THE SECURITIES EXCHANGE ACT OF 1934 |
| FOR THE FISCAL YEAR ENDED DECEMBER 31, 2012 |
OR
| ¨ | TRANSITION REPORT PURSUANT TO SECTION 13 OR 15(d) OF THE SECURITIES EXCHANGE ACT OF 1934 |
For the transition period from _______to_______
Commission file number 000-53149
SERVISFIRST BANCSHARES, INC.
(Exact Name of Registrant as Specified in Its Charter)
| Delaware | 26-0734029 | |
| (State or Other Jurisdiction of | (I.R.S. Employer | |
| Incorporation or Organization) | Identification No.) |
| 850 Shades Creek Parkway, Birmingham, Alabama | 35209 | |
| (Address of Principal Executive Offices) | (Zip Code) |
(205) 949-0302
(Registrant's Telephone Number, Including Area Code)
Securities registered pursuant to Section 12(b) of the Act:
NONE
Securities registered pursuant to Section 12(g) of the Act:
Common Stock, par value $.001 per share
(Titles of Class)
Indicate by check mark if the registrant is a well-known seasoned issuer, as defined in Rule 405 of the Securities Act.
Yes ¨ No x
Indicate by check mark if the registrant is not required to file reports pursuant to Section 13 or Section 15(d) of the Act.
Yes ¨ No x
Indicate by check mark whether the registrant: (1) has filed all reports required to be filed by Section 13 or Section 15(d) of the Securities Exchange Act of 1934 during the preceding 12 months (or such shorter period that the registrant was required to file such reports), and (2) has been subject to such filing requirements for the past 90 days. Yes x No ¨
Indicate by check mark whether the registrant has submitted electronically and posted on its corporate Web site, if any, every Interactive Data File required to be submitted and posted pursuant to Rule 405 of Regulation S-T during the preceding 12 months (or for such shorter period that the registrant was required to submit and post such files).
Yes x No ¨
Indicate by check mark whether the registrant is a large accelerated filer, an accelerated filer, a non-accelerated filer, or a smaller reporting company. See the definition of “large accelerated filer”, “accelerated filer”, and small reporting company” in Rule 12b-2 of the Exchange Act (Check one):
Large accelerated filer ¨ Accelerated filer x Non-accelerated filer ¨ Smaller reporting company ¨
Indicate by check mark whether the registrant is a shell company (as defined in Rule 12b-2 of the Act). Yes ¨ No x
As of June 30, 2012, the aggregate market value of the voting common stock held by non-affiliates of the registrant, based on a stock price of $30.00 per share of Common Stock, was $159,534,480.
Indicate the number of shares outstanding of each of the issuer’s classes of common stock, as of the latest practicable date.
| Class | Outstanding as of February 28, 2013 | |
| Common stock, $.001 par value | 6,268,812 |
DOCUMENTS INCORPORATED BY REFERENCE
Portions of the registrant’s definitive proxy statement to be filed with the Securities and Exchange Commission in connection with its 2013 Annual Meeting of Stockholders are incorporated by reference into Part III of this annual report on Form 10-K.
SERVISFIRST BANCSHARE, INC.
TABLE OF CONTENTS
FORM 10-K
DECEMBER 31, 2012
| CAUTIONARY NOTE REGARDING FORWARD-LOOKING STATEMENTS | 3 | |
| PART I. | 4 | |
| ITEM 1. | BUSINESS | 4 |
| ITEM 1A. | RISK FACTORS | 22 |
| ITEM 1B. | UNRESOLVED STAFF COMMENTS | 30 |
| ITEM 2. | PROPERTIES | 31 |
| ITEM 3. | LEGAL PROCEEDINGS | 31 |
| ITEM 4. | MINE SAFETY DISCLOSURES | 31 |
| PART II. | 32 | |
| ITEM 5 | MARKET FOR REGISTRANT’S COMMON EQUITY, RELATED STOCKHOLDER MATTERS AND ISSUER PURCHASES OF EQUITY SECURITIES | 32 |
| ITEM 6. | SELECTED FINANCIAL DATA | 34 |
| ITEM 7. | MANAGEMENT’S DISCUSSION AND ANALYSIS OF FINANCIAL CONDITION AND RESULTS OF OPERATIONS | 36 |
| ITEM 7A. | QUANTITATIVE AND QUALITATIVE DISCLOSURES ABOUT MARKET RISK | 55 |
| ITEM 8. | FINANCIAL STATEMENTS AND SUPPLEMENTARY DATA | 57 |
| ITEM 9. | CHANGES IN AND DISAGREEMENTS WITH ACCOUNTANTS ON ACCOUNTING AND FINANCIAL DISCLOSURES | 99 |
| ITEM 9A. | CONTROLS AND PROCEDURES | 99 |
| ITEM 9B. | OTHER INFORMATION | 100 |
| PART III. | 100 | |
| ITEM 10. | DIRECTORS, EXECUTIVE OFFICERS AND CORPORATE GOVERNANCE | 100 |
| ITEM 11. | EXECUTIVE COMPENSATION | 100 |
| ITEM 12. | SECURITY OWNERSHIP OF CERTAIN BENEFICIAL OWNERS AND MANAGEMENT AND RELATED STOCKHOLDER MATTERS | 100 |
| ITEM 13. | CERTAIN RELATIONSHIPS AND RELATED TRANSACTIONS, AND DIRECTOR INDEPENDENCE | 100 |
| ITEM 14. | PRINCIPAL ACCOUNTING FEES AND SERVICES | 100 |
| PART IV. | 101 | |
| ITEM 15. | EXHIBITS AND FINANCIAL STATEMENT SCHEDULES | 101 |
| SIGNATURES | 103 | |
| EXHIBIT INDEX | 104 | |
| 2 |
CAUTIONARY NOTE REGARDING FORWARD-LOOKING STATEMENTS
Some of our statements contained in this Form 10-K, including matters discussed under the caption “Management’s Discussion and Analysis of Financial Condition and Results of Operations”, are “forward-looking statements” that are based upon our current expectations and projections about future events. Forward-looking statements relate to future events or our future financial performance and include statements about the competitiveness of the banking industry, potential regulatory obligations, our entrance and expansion into other markets, our other business strategies and other statements that are not historical facts. Forward-looking statements are not guarantees of performance or results. When we use words like “may,” “plan,” “contemplate,” “anticipate,” “believe,” “intend,” “continue,” “expect,” “project,” “predict,” “estimate,” “could,” “should,” “would,” “will,” and similar expressions, you should consider them as identifying forward-looking statements, although we may use other phrasing. These forward-looking statements involve risks and uncertainties and are based on our beliefs and assumptions, and on the information available to us at the time that these disclosures were prepared and may not be realized due to a variety of factors, including, but not limited to, the following:
| · | the effects of the continued slow economic recovery and high unemployment; |
| · | the effects of continued deleveraging of United States citizens and businesses; |
| · | the effects of potential federal spending cuts due to the United States debt ceiling crisis; |
| · | the effects of continued depression of residential housing values and the slow market for sales and resales; |
| · | credit risks, including credit risks resulting from the devaluation of collateralized debt obligations (CDOs) and/or structured investment vehicles to which we currently have no direct exposure; |
| · | the effects of governmental monetary and fiscal policies and legislative and regulatory changes; |
| · | the effect of changes in interest rates on the level and composition of deposits, loan demand and the values of loan collateral, securities and interest sensitive assets and liabilities; |
| · | the effects of terrorism and efforts to combat it; |
| · | the effects of hazardous weather such as the tornados that struck the state of Alabama in April 2011 and January 2012; |
| · | the effects of competition from other commercial banks, thrifts, mortgage banking firms, consumer finance companies, credit unions, securities brokerage firms, insurance companies, money market and other mutual funds and other financial institutions operating in our market area and elsewhere, including institutions operating regionally, nationally and internationally, together with competitors offering banking products and services by mail, telephone and the internet; |
| · | the effect of any merger, acquisition or other transaction to which we or our subsidiary may from time to time be a party, including our ability to successfully integrate any business that we acquire; and |
| · | the effect of inaccuracies in our assumptions underlying the establishment of our loan loss reserves. |
All written or oral forward-looking statements attributable to us are expressly qualified in their entirety by this Cautionary Note. Our actual results may differ significantly from those we discuss in these forward-looking statements. For certain other factors, risks and uncertainties that could cause our actual results to differ materially from estimates and projections contained in these forward-looking statements, please read the “Risk Factors” in Item 1A.
| 3 |
PART I
Unless this Form 10-K indicates otherwise, the terms “we,” ”our,” “us,” “the Company,” “ServisFirst Bancshares” or “ServisFirst” as used herein refer to ServisFirst Bancshares, Inc., and its subsidiaries, including ServisFirst Bank, which sometimes is referred to as “our bank subsidiary” or “the Bank” and its other subsidiaries. References herein to the fiscal years 2008, 2009, 2010, 2011 and 2012 mean our fiscal years ended December 31, 2008, 2009, 2010, 2011 and 2012, respectively.
ITEM 1. BUSINESS
Overview
We are a bank holding company within the meaning of the Bank Holding Company Act of 1956 and are headquartered in Birmingham, Alabama. Through our wholly-owned subsidiary bank, we operate 11 full-service banking offices located in Jefferson, Shelby, Madison, Montgomery and Houston Counties of Alabama and in Escambia County Florida in the metropolitan statistical areas (“MSAs”) of Birmingham-Hoover, Huntsville, Montgomery and Dothan, Alabama, and Pensacola-Ferry Pass-Brent, Florida. Additionally, we operate a loan production office in Mobile County of Alabama in the Mobile MSA. As of December 31, 2012, we had total assets of approximately $2.9 billion, total loans of approximately $2.4 billion, total deposits of approximately $2.5 billion and total stockholders’ equity of approximately $233 million.
In January 2012, we formed SF Holding 1, Inc., an Alabama corporation, and its subsidiary, SF Realty 1, Inc., an Alabama corporation. SF Realty 1 elected to be treated as a real estate investment trust (“REIT”) for U.S. income tax purposes. SF Realty 1 holds and manages participations in residential mortgages and commercial real estate loans originated by ServisFirst Bank. SF Holding 1, Inc. and SF Realty 1, Inc. are both consolidated into the Company.
We were originally incorporated as a Delaware corporation in August 2007 for the purpose of acquiring all of the common stock of ServisFirst Bank, an Alabama banking corporation (separately referred to herein as the “Bank”), which started operations on May 2, 2005. On November 29, 2007, we became the sole shareholder of the Bank by virtue of a plan of reorganization and agreement of merger pursuant to which (i) a wholly-owned subsidiary formed for the purpose of the reorganization was merged with and into the Bank, with the Bank surviving, and (ii) each shareholder of the Bank exchanged their shares of the Bank’s common stock for an equal number of shares of our common stock.
The holding company structure provides flexibility for expansion of our banking business through the possible acquisition of other financial institutions, the provision of additional banking-related services which the traditional commercial bank may not provide under current law, and additional financing alternatives such as the issuance of trust preferred securities. We have no current plans to acquire any operating subsidiaries in addition to the Bank, but we may make acquisitions in the future if we deem them to be in the best interest of our stockholders. Any such acquisitions would be subject to applicable regulatory approvals and requirements.
Our principal business is to accept deposits from the public and to make loans and other investments. Our principal sources of funds for loans and investments are demand, time, savings and other deposits (including negotiable orders of withdrawal, or NOW accounts) and the amortization and prepayment of loans and borrowings. Our principal sources of income are interest and fees collected on loans, interest and dividends collected on other investments, and service charges. Our principal expenses are interest paid on savings and other deposits (including NOW accounts), interest paid on our other borrowings, employee compensation, office expenses and other overhead expenses.
Market Growth and Competition
The markets in which we operate enjoyed steady expansion in their deposit base until being negatively affected by the recession and credit crisis beginning in 2008. We believe that the long-term growth potential of each of our markets is substantial, and further believe that many local affluent professionals and small business owners will do their banking with local, autonomous institutions that offer a higher level of personalized service. According to FDIC reports, total deposits in each of our market areas have expanded from 2002 to 2012 (deposit data reflects totals as reported by financial institutions as of June 30th of each year) as follows:
| 4 |
| 2012 | 2002 | Compound Annual Growth Rate | ||||||||||
| (Dollars in Billions) | ||||||||||||
| Jefferson/Shelby County, Alabama | $ | 26.6 | $ | 15.1 | 5.83 | % | ||||||
| Madison County, Alabama | 5.9 | 3.4 | 5.67 | % | ||||||||
| Montgomery County, Alabama | 6.6 | 3.2 | 7.51 | % | ||||||||
| Houston County, Alabama | 2.1 | 1.3 | 4.91 | % | ||||||||
| Escambia County, Florida | 3.5 | 2.6 | 3.02 | % | ||||||||
The Bank is subject to intense competition from various financial institutions and other financial service providers. The Bank competes for deposits with other local and regional commercial banks, savings and loan associations, credit unions and issuers of commercial paper and other securities, such as money-market and mutual funds. In making loans, the Bank competes with other commercial banks, savings and loan associations, consumer finance companies, credit unions, leasing companies and other lenders.
The following table illustrates our market share, by insured deposits, in our primary service areas at June 30, 2012, as reported by the FDIC:
| Market | Number of Branches | Our Market Deposits | Total Market Deposits | Ranking | Market Share Percentage | |||||||||||||||
| (Dollars in Millions) | ||||||||||||||||||||
| Alabama: | ||||||||||||||||||||
| Birmingham-Hoover MSA | 3 | $ | 975.2 | $ | 29,406.0 | 6 | 3.32 | % | ||||||||||||
| Huntsville MSA | 2 | 500.5 | 6,606.7 | 5 | 7.58 | % | ||||||||||||||
| Montgomery MSA | 2 | 376.9 | 7,909.1 | 6 | 4.76 | % | ||||||||||||||
| Dothan MSA | 2 | 249.9 | 2,800.0 | 3 | 8.92 | % | ||||||||||||||
| Florida: | ||||||||||||||||||||
| Pensacola-Ferry Pass-Brent MSA | 1 | 140.8 | 4,686.3 | 11 | 3.00 | % | ||||||||||||||
Together, deposits for all institutions in Jefferson, Shelby, Montgomery, Madison, and Houston Counties represented approximately 48.75% of all the deposits in the State of Alabama at June 30, 2012. Deposits for all institutions in Escambia County represent approximately 0.82% of all the deposits in the state of Florida at June 30, 2012.
Our retail and commercial divisions operate in highly competitive markets. We compete directly in retail and commercial banking markets with other commercial banks, savings and loan associations, credit unions, mortgage brokers and mortgage companies, mutual funds, securities brokers, consumer finance companies, other lenders and insurance companies, locally, regionally and nationally. Many of our competitors compete by using offerings by mail, telephone, computer and/or the Internet. Interest rates, both on loans and deposits, and prices of services are significant competitive factors among financial institutions generally. Providing convenient locations, desired financial products and services, convenient office hours, quality customer service, quick local decision making, a strong community reputation and long-term personal relationships are all important competitive factors that we emphasize.
In our primary service areas, our five largest competitors are Regions Bank, Wells Fargo Bank, Compass Bank, BB&T and PNC Bank, NA. These institutions, as well as other competitors of ours, have greater resources, serve broader geographic markets, have higher lending limits, offer various services that we do not offer and can better afford, and make broader use of, media advertising, support services, and electronic technology than we can. To offset these competitive disadvantages, we depend on our reputation for greater personal service, consistency, and flexibility and the ability to make credit and other business decisions quickly.
Business Strategy
Management Philosophy
Our philosophy is to operate as an urban community bank emphasizing prompt, personalized customer service to the individuals and businesses located in our primary service areas. We believe this philosophy has attracted and will continue to attract customers and capture market share historically controlled by other financial institutions operating in our market. Our management and employees focus on recognizing customers’ needs and delivering products and services to meet those needs. We aggressively market to businesses, professionals and affluent consumers that may be underserved by the large regional banks that operate in their service areas. We believe that local ownership and control allows us to serve customers more efficiently and effectively and will aid in our growth and success.
| 5 |
Operating Strategy
In order for us to achieve the level of prompt, responsive service necessary to attract customers and to develop our desired reputation as an urban bank with a community focus, we have employed the following operating strategies:
| · | Quality Employees. We strive to hire a highly trained and experienced staff. Employees are trained to answer questions about all of our products and services, so that the first employee the customer encounters can usually resolve most questions the customer may have. |
| · | Experienced Senior Management. Our senior management has extensive experience in the banking industry and substantial business and banking contacts in our markets. |
| · | Relationship Banking. We focus on cross-selling financial products and services to our customers. Our customer-contact employees are highly trained to recognize customer needs and to meet those needs with a sophisticated array of products and services. We view cross-selling as a means to leverage relationships and help provide useful financial services to retain customers, attract new customers and remain competitive. |
| · | Community-Oriented Directors. The boards of directors for the holding company and the Bank currently consist of residents of Birmingham, but we also have a non-voting advisory board of directors in each of the Huntsville, Montgomery, Dothan and Pensacola markets. These advisory directors represent a broad spectrum of business experience and community involvement in the service areas where they live. As residents of our primary service areas, they are sensitive and responsive to the needs of our customers and prospects in their respective areas. In addition, our directors and advisory directors bring substantial business and banking contacts to us. |
| · | Highly Visible Offices. Our local headquarters buildings are highly visible in Birmingham’s south Jefferson County, and in the metropolitan areas of Huntsville, Montgomery, Dothan and Pensacola. We believe that a highly visible headquarters building gives us a powerful presence in each local market. |
| · | Individual Customer Focus. We focus on providing individual service and attention to our target customers, which include privately held businesses with $2 million to $250 million in sales, professionals, and affluent consumers. As our officers and directors become familiar with our customers on an individual basis, they are able to respond to credit requests quickly. |
| · | Market Segmentation and Advertising. We utilize traditional advertising media, such as local periodicals and event sponsorships, to increase our public visibility. The majority of our marketing and advertising efforts, however, are focused on leveraging our management’s, directors’, advisory directors’ and stockholders’ existing relationship networks. |
| · | Telephone and Internet Banking Services. We offer various banking services by telephone through 24-hour voice response and through internet banking. |
Growth Strategy
Because we believe that growth and expansion of our operations are significant factors in our success, we have implemented the following growth strategies:
| · | Capitalize on Community Orientation. We seek to capitalize on the extensive relationships that our management, directors, advisory directors and stockholders have with businesses and professionals in our markets. We believe that these market sectors are not adequately served by the existing banks in such areas. |
| · | Emphasize Local Decision-Making. We emphasize local decision-making by experienced bankers. We believe this helps us attract local businesses and service-minded customers. |
| · | Offer Fee-Generating Products and Services. Our range of services, pricing strategies, interest rates paid and charged, and hours of operation are structured to attract our target customers and increase our market share. We strive to offer the businessperson, professional, entrepreneur and consumer the best loan services available while pricing these services competitively. |
| 6 |
| · | Office Location Strategy. We located our offices within each of our local markets in areas that we believe provide visibility, convenience and access to our target customers. |
Lending Services
Lending Policy
Our lending policies are established to support the credit needs of our primary market areas. Consequently, we aggressively seek high-quality borrowers within a limited geographic area and in competition with other well-established financial institutions in our primary service areas that have greater resources and lending limits than we have.
Loan Approval and Review
Our loan approval policies set various levels of officer lending authority. When the total amount of loans to a single borrower exceeds an individual officer’s lending authority, further approval must be obtained from the Regional CEO and/or our Chief Executive Officer, Chief Risk Officer or Chief Credit Officer, based on our loan policies.
Commercial Loans
Our commercial lending activity is directed principally toward businesses and professional service firms whose demand for funds fall within our legal lending limits. We make loans to small- and medium-sized businesses in our primary service areas for the purpose of upgrading plant and equipment, buying inventory and for general working capital. Typically, targeted business borrowers have annual sales between $2 million and $250 million. This category of loans includes loans made to individual, partnership or corporate borrowers, and such loans are obtained for a variety of business purposes. We offer a variety of commercial lending products to meet the needs of business and professional service firms in our service areas. These commercial lending products include seasonal loans, bridge loans and term loans for working capital, expansion of the business, or acquisition of property, plant and equipment. We also offer commercial lines of credit. The repayment terms of our commercial loans will vary according to the needs of each customer.
Our commercial loans usually will be collateralized. Generally, collateral consists of business assets, including any or all of general intangibles, accounts receivables, inventory, equipment, or real estate. Collateral is subject to the risk that we may have difficulty converting it to a liquid asset if necessary, as well as risks associated with degree of specialization, mobility and general collectability in a default situation. To mitigate this risk, we underwrite collateral to strict standards, including valuations and general acceptability based on our ability to monitor its ongoing condition and value.
We underwrite our commercial loans primarily on the basis of the borrower’s cash flow, ability to service debt, and degree of management expertise. As a general practice, we take as collateral a security interest in any available real estate, equipment or personal property. Under limited circumstances, we may make commercial loans on an unsecured basis. This type loan may be subject to many different types of risks, including fraud, bankruptcy, economic downturn, deteriorated or non-existent collateral, and changes in interest rates such as have occurred in the recent economic recession and credit market crisis. Perceived risks may differ depending on the particular industry in which a borrower operates. General risks to an industry, such as the recent economic recession and credit market crisis, or to a particular segment of an industry are monitored by senior management on an ongoing basis. When warranted, loans to individual borrowers who may be at risk due to an industry condition may be more closely analyzed and reviewed by the credit review committee or board of directors. Commercial and industrial borrowers are required to submit financial statements to us on a regular basis. We analyze these statements, looking for weaknesses and trends, and will assign the loan a risk grade accordingly. Based on this risk grade, the loan may receive an increased degree of scrutiny by management, up to and including additional loss reserves being required.
Real Estate Loans
We make commercial real estate loans, construction and development loans and residential real estate loans.
Commercial Real Estate. Commercial real estate loans are generally limited to terms of five years or less, although payments are usually structured on the basis of a longer amortization. Interest rates may be fixed or adjustable, although rates generally will not be fixed for a period exceeding five years. In addition, we generally will require personal guarantees from the principal owners of the property supported by a review by our management of the principal owners’ personal financial statements.
| 7 |
Commercial real estate lending presents risks not found in traditional residential real estate lending. Repayment is dependent upon successful management and marketing of properties and on the level of expense necessary to maintain the property. Repayment of these loans may be adversely affected by conditions in the real estate market or the general economy. Also, commercial real estate loans typically involve relatively large loan balances to a single borrower. To mitigate these risks, we closely monitor our borrower concentration. These loans generally have shorter maturities than other loans, giving us an opportunity to reprice, restructure or decline renewal. As with other loans, all commercial real estate loans are graded depending upon strength of credit and performance. A higher risk grade will bring increased scrutiny by our management, the credit review committee and the board of directors.
Construction and Development Loans. We make construction and development loans both on a pre-sold and speculative basis. If the borrower has entered into an agreement to sell the property prior to beginning construction, then the loan is considered to be on a pre-sold basis. If the borrower has not entered into an agreement to sell the property prior to beginning construction, then the loan is considered to be on a speculative basis. Construction and development loans are generally made with a term of 12 to 24 months, and interest is paid monthly. The ratio of the loan principal to the value of the collateral as established by independent appraisal typically will not exceed 80% of residential construction loans. Speculative construction loans will be based on the borrower’s financial strength and cash flow position. Development loans are generally limited to 75% of appraised value. Loan proceeds will be disbursed based on the percentage of completion and only after the project has been inspected by an experienced construction lender or third-party inspector. During times of economic stress, this type loan has typically had a greater degree of risk than other loan types, as has been evident in the recent credit crisis.
Beginning in 2008, there have been numerous construction loan defaults among many commercial bank loan portfolios, including a number of Alabama-based banks. To mitigate the risk of such defaults in our portfolio, the board of directors and management tracks and monitors these loans closely. Total construction loans increased $7.1 million in 2012. We maintained our allocation of loan loss reserve for these loans at approximately $6.5 million, the same amount as allocated at the end 2011. Charge-offs for construction loans increased from $2.6 million for 2011 to $3.1 million for 2012, but the overall quality of the construction loan portfolio has improved with $14.4 million rated as substandard at December 31, 2012 compared to $19.5 million at December 31, 2011.
Residential Real Estate Loans. Our residential real estate loans consist primarily of residential second mortgage loans, residential construction loans and traditional mortgage lending for one-to-four family residences. We will originate fixed-rate mortgages with long-term maturities and balloon payments generally not exceeding five years. The majority of our fixed-rate loans are sold in the secondary mortgage market. All loans are made in accordance with our appraisal policy, with the ratio of the loan principal to the value of collateral as established by independent appraisal generally not exceeding 80%. Risks associated with these loans are generally less significant than those of other loans and involve fluctuations in the value of real estate, bankruptcies, economic downturn and customer financial problems. Real estate has recently experienced a period of declining prices which negatively affects real estate collateralized loans, but this negative effect has to date been more prevalent in regions of the United States other than our primary service areas; however, homes in our primary service areas may experience significant price declines in the future. We have not made and do not expect to make any “Alt-A” or subprime loans.
Consumer Loans
We offer a variety of loans to retail customers in the communities we serve. Consumer loans in general carry a moderate degree of risk compared to other loans. They are generally more risky than traditional residential real estate loans but less risky than commercial loans. Risk of default is usually determined by the well-being of the local economies. During times of economic stress, there is usually some level of job loss both nationally and locally, which directly affects the ability of the consumer to repay debt. Risk on consumer-type loans is generally managed though policy limitations on debt levels consumer borrowers may carry and limitations on loan terms and amounts depending upon collateral type.
Our consumer loans include home equity loans (open- and closed-end); vehicle financing; loans secured by deposits; and secured and unsecured personal loans. These various types of consumer loans all carry varying degrees of risk.
Commitments and Contingencies
As of December 31, 2012, we had commitments to extend credit beyond current fundings of approximately $860.4 million, had issued standby letters of credit in the amount of approximately $36.4 million, and had commitments for credit card arrangements of approximately $25.7 million.
| 8 |
Policy for Determining the Loan Loss Allowance
The allowance for loan losses represents our management’s assessment of the risk associated with extending credit and its evaluation of the quality of the loan portfolio. In calculating the adequacy of the loan loss allowance, our management evaluates the following factors:
| · | the asset quality of individual loans; |
| · | changes in the national and local economy and business conditions/development, including underwriting standards, collections, and charge-off and recovery practices; |
| · | changes in the nature and volume of the loan portfolio; |
| · | changes in the experience, ability and depth of our lending staff and management; |
| · | changes in the trend of the volume and severity of past-due loans and classified loans, and trends in the volume of non-accrual loans, troubled debt restructurings and other modifications, as has occurred in the residential mortgage markets and particularly for residential construction and development loans; |
| · | possible deterioration in collateral segments or other portfolio concentrations; |
| · | historical loss experience (when available) used for pools of loans (i.e. collateral types, borrowers, purposes, etc.); |
| · | changes in the quality of our loan review system and the degree of oversight by our board of directors; and |
| · | the effect of external factors such as competition and the legal and regulatory requirement on the level of estimated credit losses in our current loan portfolio. |
These factors are evaluated monthly, and changes in the asset quality of individual loans are evaluated as needed.
We assign all of our loans individual risk grades when they are underwritten. We have established minimum general reserves based on the asset quality grade of the loan. We also apply general reserve factors based on historical losses, management’s experience and common industry and regulatory guidelines.
After a loan is underwritten and booked, it is monitored or reviewed by the account officer, management, internal loan review, and external loan review personnel during the life of the loan. Payment performance is monitored monthly for the entire loan portfolio; account officers contact customers during the regular course of business and may be able to ascertain if weaknesses are developing with the borrower; independent loan consultants perform a review annually; and federal and state banking regulators perform annual reviews of the loan portfolio. If we detect weaknesses that have developed in an individual loan relationship, we downgrade the loan and assign higher reserves based upon management’s assessment of the weaknesses in the loan that may affect full collection of the debt. We have established a policy to discontinue accrual of interest (non-accrual status) after the loan has become 90 days delinquent as to payment of principal or interest unless the loan is considered to be well collateralized and is actively in process of collection. In addition, a loan will be placed on non-accrual status before it becomes 90 days delinquent if management believes that the borrower’s financial condition is such that the collection of interest or principal is doubtful. Interest previously accrued but uncollected on such loans is reversed and charged against current income when the receivable is determined to be uncollectible. Interest income on non-accrual loans is recognized only as received. If a loan will not be collected in full, we increase the allowance for loan losses to reflect our management’s estimate of any potential exposure or loss.
Our net loan losses to average total loans decreased to 0.24% for the year ended December 31, 2012 from 0.32% for the year ended December 31, 2011, which was down from 0.55% for the year ended December 31, 2010. Historical performance, however, is not an indicator of future performance, and our future results could differ materially. As of December 31, 2012, we had $10.4 million of non-accrual loans, of which 96% are secured real estate loans. We have allocated approximately $6.5 million of our allowance for loan losses to real estate construction, acquisition and development, and lot loans and $8.2 million to commercial and industrial loans, and have a total loan loss reserve as of December 31, 2012 allocable to specific loan types of $19.9 million. We also currently maintain a portion of the allowance for loan losses which is management’s evaluation of potential future losses that would arise in the loan portfolio should management’s assumption about qualitative and environmental conditions materialize. The qualitative factor portion of the allowance for loan losses is based on management’s judgment regarding various external and internal factors including macroeconomic trends, management’s assessment of the Company’s loan growth prospects and evaluations of internal risk controls. This qualitative factor portion of the allowance for loan losses totaled $6.4 million, resulting in a total allowance for loan losses of $26.3 million at December 31, 2012. Our management believes, based upon historical performance, known factors, overall judgment, and regulatory methodologies, that the current methodology used to determine the adequacy of the allowance for loan losses is reasonable, including after considering the effect of the current residential housing market defaults and business failures (particularly of real estate developers) plaguing financial institutions in general.
| 9 |
Our allowance for loan losses is also subject to regulatory examinations and determinations as to adequacy, which may take into account such factors as the methodology used to calculate the allowance for loan losses and the size of the allowance for loan losses in comparison to a group of peer banks identified by the regulators. During their routine examinations of banks, regulatory agencies may require a bank to make additional provisions to its allowance for loan losses when, in the opinion of the regulators, credit evaluations and allowance for loan loss methodology differ materially from those of management.
While it is our policy to charge off in the current period loans for which a loss is considered probable, there are additional risks of future losses that cannot be quantified precisely or attributed to particular loans or classes of loans. Because these risks include the state of the economy, our management’s judgment as to the adequacy of the allowance is necessarily approximate and imprecise.
Investments
In addition to loans, we purchase investments in securities, primarily in mortgage-backed securities and state and municipal securities. No investment in any of those instruments will exceed any applicable limitation imposed by law or regulation. Our board of directors reviews the investment portfolio on an ongoing basis in order to ensure that the investments conform to the policy as set by the board of directors. Our investment policy provides that no more than 50% of our total investment portfolio may be composed of municipal securities. All securities held are traded in liquid markets, and we have no auction-rate securities. We had no investments in any one security, restricted or liquid, in excess of 10% of our stockholders’ equity at December 31, 2012.
Deposit Services
We seek to establish solid core deposits, including checking accounts, money market accounts, savings accounts and a variety of certificates of deposit and IRA accounts. We currently have no brokered deposits. To attract deposits, we employ an aggressive marketing plan throughout our service areas that features a broad product line and competitive services. The primary sources of core deposits are residents of, and businesses and their employees located in, our market areas. We have obtained deposits primarily through personal solicitation by our officers and directors, through reinvestment in the community, and through our stockholders, who have been a substantial source of deposits and referrals. We make deposit services accessible to customers by offering direct deposit, wire transfer, night depository, banking-by-mail and remote capture for non-cash items. The Bank is a member of the FDIC, and thus our deposits are FDIC-insured. The FDIC’s full guarantee of noninterest-bearing transaction accounts, as provided for by The Dodd-Frank Wall Street Reform and Consumer Protection Act, expired on December 31, 2012.
Other Banking Services
Given client demand for increased convenience and account access, we offer a range of products and services, including 24-hour telephone banking, direct deposit, Internet banking, mobile banking, traveler’s checks, safe deposit boxes, attorney trust accounts and automatic account transfers. We also participate in a shared network of automated teller machines and a debit card system that our customers are able to use throughout Alabama and in other states and, in certain accounts subject to certain conditions, we rebate to the customer the ATM fees automatically after each business day. Additionally, we offer Visa® credit cards.
Asset, Liability and Risk Management
We manage our assets and liabilities with the aim of providing an optimum and stable net interest margin, a profitable after-tax return on assets and return on equity, and adequate liquidity. These management functions are conducted within the framework of written loan and investment policies. To monitor and manage the interest rate margin and related interest rate risk, we have established policies and procedures to monitor and report on interest rate risk, devise strategies to manage interest rate risk, monitor loan originations and deposit activity and approve all pricing strategies. We attempt to maintain a balanced position between rate-sensitive assets and rate-sensitive liabilities. Specifically, we chart assets and liabilities on a matrix by maturity, effective duration, and interest adjustment period, and endeavor to manage any gaps in maturity ranges.
| 10 |
Seasonality and Cycles
We do not consider our commercial banking business to be seasonal.
Employees
We had 234 full-time equivalent employees as of December 31, 2012. We consider our employee relations to be good, and we have no collective bargaining agreements with any employees.
Supervision and Regulation
Both we and the Bank are subject to extensive state and federal banking regulations that impose restrictions on and provide for general regulatory oversight of our operations. These regulations require compliance with various consumer protection provisions applicable to lending, deposits, brokerage and fiduciary activities. These guidelines also impose capital adequacy requirements and restrict our ability to repurchase our stock and receive dividends from the Bank. These laws generally are intended to protect depositors and not stockholders. The following discussion describes the material elements of the regulatory framework that applies to us.
Bank Holding Company Regulation
Since we own all of the capital stock of the Bank, we are a bank holding company under the federal Bank Holding Company Act of 1956 (the “BHC Act”). As a result, we are primarily subject to the supervision, examination and reporting requirements of the BHC Act and the regulations of the Board of Governors of the Federal Reserve System (the “Federal Reserve”).
Acquisition of Banks
The BHC Act requires every bank holding company to obtain the Federal Reserve’s prior approval before:
| · | acquiring direct or indirect ownership or control of any voting shares of any bank if, after the acquisition, the bank holding company will, directly or indirectly, own or control more than 5% of the bank’s voting shares; |
| · | acquiring all or substantially all of the assets of any bank; or |
| · | merging or consolidating with any other bank holding company. |
Additionally, the BHC Act provides that the Federal Reserve may not approve any of these transactions if such transaction would result in or tend to create a monopoly or substantially lessen competition or otherwise function as a restraint of trade, unless the anti-competitive effects of the proposed transaction are clearly outweighed by the public interest in meeting the convenience and needs of the community to be served. The Federal Reserve is also required to consider the financial and managerial resources and future prospects of the bank holding companies and banks concerned and the convenience and needs of the community to be served. The Federal Reserve’s consideration of financial resources generally focuses on capital adequacy, which is discussed below.
Under the BHC Act, if adequately capitalized and adequately managed, we or any other bank holding company located in Alabama may purchase a bank located outside of Alabama. Conversely, an adequately capitalized and adequately managed bank holding company located outside of Alabama may purchase a bank located inside Alabama. In each case, however, restrictions may be placed on the acquisition of a bank that has only been in existence for a limited amount of time or will result in specified concentrations of deposits.
Change in Bank Control.
Subject to various exceptions, the BHC Act and the Change in Bank Control Act, together with related regulations, require Federal Reserve approval prior to any person’s or company’s acquiring “control” of a bank holding company. Under a rebuttable presumption established by the Federal Reserve, the acquisition of 10% or more of a class of voting stock of a bank holding company with a class of securities registered under Section 12 of the Exchange Act would, under the circumstances set forth in the presumption, constitute acquisition of control of the bank holding company. In addition, any person or group of persons must obtain the approval of the Federal Reserve under the BHC Act before acquiring 25% (5% in the case of an acquirer that is already a bank holding company) or more of the outstanding common stock of a bank holding company, or otherwise obtaining control or a “controlling influence” over the bank holding company.
| 11 |
Permitted Activities
Under the BHC Act, a bank holding company is generally permitted to engage in or acquire direct or indirect control of more than 5% of the voting shares of any company engaged in the following activities:
| · | banking or managing or controlling banks; and |
| · | any activity that the Federal Reserve determines to be so closely related to banking as to be a proper incident to the business of banking. |
Activities that the Federal Reserve has found to be so closely related to banking as to be a proper incident to the business of banking include:
| · | factoring accounts receivable; |
| · | making, acquiring, brokering or servicing loans and usual related activities; |
| · | leasing personal or real property; |
| · | operating a non-bank depository institution, such as a savings association; |
| · | trust company functions; |
| · | financial and investment advisory activities; |
| · | discount securities brokerage activities; |
| · | underwriting and dealing in government obligations and money market instruments; |
| · | providing specified management consulting and counseling activities; |
| · | performing selected data processing services and support services; |
| · | acting as an agent or broker in selling credit life insurance and other types of insurance in connection with credit transactions; and |
| · | performing selected insurance underwriting activities. |
Despite prior approval, the Federal Reserve may order a bank holding company or its subsidiaries to terminate any of these activities or to terminate its ownership or control of any subsidiary when it has reasonable cause to believe that the bank holding company’s continued ownership, activity or control constitutes a serious risk to the financial safety, soundness, or stability of it or any of its bank subsidiaries.
In addition to the permissible bank holding company activities listed above, a bank holding company may qualify and elect to become a financial holding company, permitting the bank holding company to engage in activities that are financial in nature or incidental or complementary to financial activity. The BHC Act expressly lists the following activities as financial in nature:
| · | lending, trust and other banking activities; |
| · | insuring, guaranteeing, or indemnifying against loss or harm, or providing and issuing annuities, and acting as principal, agent, or broker for these purposes, in any state; |
| · | providing financial, investment, or advisory services; |
| · | issuing or selling instruments representing interests in pools of assets permissible for a bank to hold directly; |
| 12 |
| · | underwriting, dealing in or making a market in securities; |
| · | other activities that the Federal Reserve may determine to be so closely related to banking or managing or controlling banks as to be a proper incident to managing or controlling banks; |
| · | foreign activities permitted outside of the United States if the Federal Reserve has determined them to be usual in connection with banking operations abroad; |
| · | merchant banking through securities or insurance affiliates; and |
| · | insurance company portfolio investments. |
For us to qualify to become a financial holding company, the Bank and any other depository institution subsidiary of ours must be well-capitalized and well-managed and must have a Community Reinvestment Act rating of at least “satisfactory”. Additionally, we must file an election with the Federal Reserve to become a financial holding company and must provide the Federal Reserve with 30 days’ written notice prior to engaging in a permitted financial activity. We have not elected to become a financial holding company at this time.
Support of Subsidiary Institutions
The Federal Deposit Insurance Act and Federal Reserve policy require a bank holding company to act as a source of financial and managerial strength to its bank subsidiaries and to take measures to preserve and protect its bank subsidiaries in situations where additional investments in a troubled bank may not otherwise be warranted. In addition, where a bank holding company has more than one bank or thrift subsidiary, each of the bank holding company’s subsidiary depository institutions are responsible for any losses to the FDIC as a result of an affiliated depository institution’s failure. As a result, a bank holding company may be required to loan money to a bank subsidiary in the form of subordinate capital notes or other instruments which qualify as capital under bank regulatory rules. However, any loans from the holding company to such subsidiary banks likely will be unsecured and subordinated to such bank’s depositors and perhaps to other creditors of the bank.
Bank Regulation and Supervision
The Bank is subject to extensive state and federal banking laws and regulations that impose restrictions on and provide for general regulatory oversight of our operations. These laws and regulations are generally intended to protect depositors and not stockholders. The following discussion describes the material elements of the regulatory framework that applies to the Bank.
Since the Bank is a commercial bank chartered under the laws of the State of Alabama, it is primarily subject to the supervision, examination and reporting requirements of the FDIC and the Alabama Department of Banking (the “Alabama Banking Department”). The FDIC and the Alabama Banking Department regularly examine the Bank’s operations and have the authority to approve or disapprove mergers, the establishment of branches and similar corporate actions. Both regulatory agencies have the power to prevent the development or continuance of unsafe or unsound banking practices or other violations of law. Additionally, the Bank’s deposits are insured by the FDIC to the maximum extent provided by law. The Bank is also subject to numerous state and federal statutes and regulations that affect its business, activities and operations.
Branching
Under current Alabama law, the Bank may open branch offices throughout Alabama with the prior approval of the Alabama Banking Department. In addition, with prior regulatory approval, the Bank may acquire branches of existing banks located in Alabama. While prior law imposed various limits on the ability of banks to establish new branches in states other than their home state, the Dodd-Frank Wall Street Reform and Consumer Protection Act allows a bank to branch into a new state by acquiring a branch of an existing institution or by setting up a new branch, without merging with an existing institution in the target state, if, under the laws of the state in which the branch is to be located, a state bank chartered by that state would be permitted to establish the branch. This makes it much simpler for banks to open de novo branches in other states. We opened our Pensacola, Florida branch using this mechanism.
| 13 |
Prompt Corrective Action
The Federal Deposit Insurance Corporation Improvement Act of 1991 establishes a system of “prompt corrective action” to resolve the problems of undercapitalized financial institutions. Under this system, the federal banking regulators have established five capital categories (well capitalized, adequately capitalized, undercapitalized, significantly undercapitalized and critically undercapitalized) into which all institutions are placed. The federal banking agencies have also specified by regulation the relevant capital levels for each of the other categories. At December 31, 2012, the Bank qualified for the well-capitalized category.
Federal banking regulators are required to take various mandatory supervisory actions and are authorized to take other discretionary actions with respect to institutions in the three undercapitalized categories. The severity of the action depends upon the capital category in which the institution is placed. Generally, subject to a narrow exception, the banking regulator must appoint a receiver or conservator for an institution that is critically undercapitalized.
An institution that is categorized as undercapitalized, significantly undercapitalized, or critically undercapitalized is required to submit an acceptable capital restoration plan to its appropriate federal banking agency. A bank holding company must guarantee that a subsidiary depository institution meets its capital restoration plan, subject to various limitations. The controlling holding company’s obligation to fund a capital restoration plan is limited to the lesser of (i) 5% of an undercapitalized subsidiary’s assets at the time it became undercapitalized and (ii) the amount required to meet regulatory capital requirements. An undercapitalized institution is also generally prohibited from increasing its average total assets, making acquisitions, establishing any branches or engaging in any new line of business, except under an accepted capital restoration plan or with FDIC approval. The regulations also establish procedures for downgrading an institution to a lower capital category based on supervisory factors other than capital.
FDIC Insurance Assessments
The Bank is subject to risk-based deposit insurance premium assessments imposed by the FDIC upon Deposit Insurance Fund members. Under the FDIC’s assessment system, an insured institution’s deposit insurance premium is computed by multiplying the institution’s assessment base by the institution’s assessment rate. The following information applies to an institution’s assessment base and assessment rate:
| · | Assessment Base. An institution’s assessment base equals the institution’s average consolidated total assets during a particular assessment period, minus the institution’s average tangible equity capital (i.e., Tier 1 capital) during such period. |
| · | Assessment Rate. An institution’s assessment rate is assigned by the FDIC on a quarterly basis. To assign an assessment rate, the FDIC designates an institution as falling into one of four risk categories, or as being a large and highly complex financial institution. The FDIC determines an institution’s risk category based on the level of the institution’s capitalization and on supervisory evaluations provided to the FDIC by the institution’s primary federal regulator. Each risk category designation contains upward and downward adjustment factors based on long-term unsecured debt and brokered deposits. Assessment rates currently range from 0.025% per annum for an institution in the lowest risk category with the maximum downward adjustment, to 0.45% per annum for an institution in the highest risk category with the maximum upward adjustment. For the fourth quarter of 2012, the Bank’s assessment rate was set at $0.0142, or $0.0568 annually, per $100 of assessment base. |
The FDIC’s current risk-based assessment system went into effect in 2011 and represents a major shift from the prior assessment system. Under the prior system, an institution’s assessment base was based on the institution’s deposits, rather than on the institution’s assets minus its tangible equity capital. The prior system also involved assessment rate adjustments on account of an institution’s secured liabilities, and somewhat different adjustment methodologies than the new system for long-term unsecured debt and brokered deposits.
In addition to its risk-based insurance assessments, the FDIC also imposes Financing Corporation (“FICO”) assessments to help pay the $780 million in annual interest payments on the $8 billion of bonds issued in the late 1980s as part of the government rescue of the savings and loan industry. For the fourth quarter of 2012, the FICO assessment was equal to $0.0016, or $0.0064 annually, per $100 of assessment base. These assessments will continue until the bonds mature in 2019.
We note that the FDIC has taken several actions in recent years to supplement the revenues received from its annual deposit insurance premium assessments. On May 22, 2009, the FDIC adopted a final rule imposing a 5 basis point special assessment on each insured depository institution’s assets minus Tier 1 capital as of June 30, 2009, subject to a cap of 10 basis points times the institution’s assessment base for the second quarter 2009. That special assessment was collected on September 30, 2009. In addition, on November 17, 2009, the FDIC adopted a final rule that required all institutions to prepay their estimated risk-based assessments for the fourth quarter of 2009 and for all of 2010, 2011, and 2012. The prepayment was collected on December 30, 2009, and was mandatory for all banks except for those exempt under certain circumstances. The FDIC’s possible need to further increase assessment rates and charge additional one-time assessment fees is generally considered to be greater in the current economic climate. If the FDIC were to take additional action in the future to supplement its assessment revenues, such actions could have a negative impact on the Bank’s earnings in certain cases.
| 14 |
Termination of Deposit Insurance
The FDIC may terminate its insurance of deposits of a bank if it finds that the bank has engaged in unsafe or unsound practices, is in an unsafe or unsound condition to continue operations, or has violated any applicable law, regulation, rule, order or condition imposed by the FDIC.
Liability of Commonly Controlled Depository Institutions
Under the Federal Deposit Insurance Act, an FDIC-insured depository institution can be held liable for any loss incurred by, or reasonably expected, to be incurred by, the FDIC in connection with (1) the default of a commonly controlled FDIC-insured depository institution or (2) any assistance provided by the FDIC to any commonly controlled FDIC-insured depository institution in danger of default. “Default” is defined generally as the appointment of a conservator or receiver, and “in danger of default” is defined generally as the existence of certain conditions indicating that a default is likely to occur in the absence of regulatory assistance. The FDIC’s claim for damage is superior to claims of stockholders of the insured depository institution but is subordinate to claims of depositors, secured creditors, other general and senior creditors, and holders of subordinated debt (other than affiliates) of the institution.
Community Reinvestment Act
The Community Reinvestment Act (“CRA”) requires that, in connection with examinations of financial institutions within their respective jurisdictions, the Federal Reserve or the FDIC will evaluate the record of each financial institution in meeting the credit needs of its local community, including low and moderate-income neighborhoods. These factors are also considered in evaluating mergers, acquisitions, and applications to open an office or facility. Failure to adequately meet these criteria could impose additional requirements and limitations on the Bank. Additionally, we must publicly disclose the terms of various CRA-related agreements.
Other Regulations
Interest and other charges collected or contracted for by the Bank are subject to state usury laws and federal laws concerning interest rates.
Federal Laws Applicable to Credit Transactions
The Bank’s loan operations are subject to federal laws applicable to credit transactions, including:
| · | the Federal Truth-In-Lending Act, governing disclosures of credit terms to consumer borrowers; |
| · | the Home Mortgage Disclosure Act, requiring financial institutions to provide information to enable the public and public officials to determine whether a financial institution is fulfilling its obligation to help meet the housing needs of the community it serves; |
| · | the Equal Credit Opportunity Act, prohibiting discrimination on the basis of race, color, religion, national origin, sex, marital status or certain other prohibited factors in extending credit; |
| · | the Fair Credit Reporting Act, governing the use and provision of information to credit reporting agencies; |
| · | the Fair Debt Collection Act, governing the manner in which consumer debts may be collected by collection agencies; |
| · | the Servicemembers’ Civil Relief Act, governing the repayment terms of, and property rights underlying, secured obligations of persons in military service; and |
| · | Rules and regulations of the various federal agencies charged with the responsibility of implementing these federal laws. |
| 15 |
Federal Laws Applicable to Deposit Transactions
The deposit operations of the Bank are subject to:
| · | the Right to Financial Privacy Act, which imposes a duty to maintain confidentiality of consumer financial records and prescribes procedures for complying with administrative subpoenas of financial records; and |
| · | the Electronic Funds Transfer Act and Regulation E issued by the Consumer Financial Protection Bureau to implement that act, which govern automatic deposits to and withdrawals from deposit accounts and customers’ rights and liabilities arising from the use of automated teller machines and other electronic banking services. |
Capital Adequacy
We and the Bank are required to comply with the capital adequacy standards established by the Federal Reserve (in the case of the holding company) and the FDIC and the Alabama Banking Department (in the case of the Bank). The Federal Reserve has established a risk-based and a leverage measure of capital adequacy for bank holding companies. The FDIC has established substantially similar measures for banks.
The risk-based capital standards are designed to make regulatory capital requirements more sensitive to differences in risk profiles among banks and bank holding companies, to account for off-balance-sheet exposure, and to minimize disincentives for holding liquid assets. Assets and off-balance-sheet items, such as letters of credit and unfunded loan commitments, are assigned to broad risk categories, each with appropriate risk weights. The resulting capital ratios represent capital as a percentage of total risk-weighted assets and off-balance-sheet items.
The minimum guideline for the ratio of total capital to risk-weighted assets is 8%. Total capital consists of two components, Tier 1 capital and Tier 2 capital. Tier 1 capital generally consists of common stock, minority interests in the equity accounts of consolidated subsidiaries, noncumulative perpetual preferred stock, and a limited amount of qualifying cumulative perpetual preferred stock, less goodwill and other specified intangible assets. Tier 1 capital must equal at least 4% of risk-weighted assets. Tier 2 Capital generally consists of subordinated debt, other preferred stock, and a limited amount of loan loss reserves. The total amount of Tier 2 capital is limited to 100% of Tier 1 capital. At December 31, 2012, our consolidated ratio of total capital to risk-weighted assets was 11.78%, and our ratio of Tier 1 capital to risk-weighted assets was 9.89%.
In addition, the Federal Reserve has established minimum leverage ratio guidelines for bank holding companies. These guidelines provide for a minimum ratio of Tier 1 capital to average assets, less goodwill and other specified intangible assets, of 3% for bank holding companies that meet specified criteria, including having the highest regulatory rating and implementing the Federal Reserve’s risk-based capital measure for market risk. All other bank holding companies generally are required to maintain a leverage ratio of at least 4%. At December 31, 2012, our leverage ratio was 8.43%. The guidelines also provide that bank holding companies experiencing internal growth or making acquisitions will be expected to maintain strong capital positions substantially above the minimum supervisory levels without reliance on intangible assets. The Federal Reserve considers the leverage ratio and other indicators of capital strength in evaluating proposals for expansion or new activities.
Failure to meet capital guidelines could subject a bank or bank holding company to a variety of enforcement remedies, including issuance of a capital directive, the termination of deposit insurance by the FDIC, a prohibition on accepting brokered deposits, and certain other restrictions on its business. As described above, significant additional restrictions can be imposed on FDIC-insured depository institutions that fail to meet applicable capital requirements.
As of December 31, 2012, the Bank’s most recent notification from the FDIC categorized the Bank as well-capitalized under the regulatory framework for prompt corrective action. To remain categorized as well-capitalized, the Bank must maintain minimum total risk-based, Tier 1 risk-based, and Tier 1 leverage ratios of 10%, 6% and 5%, respectively. Our Bank was well-capitalized under the prompt corrective action provisions as of December 31, 2012.
In addition to the foregoing federal requirements, the Bank is subject to a requirement of the Alabama Banking Department that the Bank maintain a leverage ratio of 8%. At December 31, 2012, the Bank’s leverage ratio was 9.03%.
Potential Changes in Capital Adequacy Requirements
In December 2010, the Basel Committee on Banking Supervision, a group representing the central banking authorities of 27 nations that formulates recommendations on banking supervisory policy, released its final framework for strengthening international capital and liquidity regulation, known as “Basel III”. Although the Basel III framework is not directly binding on the U.S. bank regulatory agencies, in June 2012 the agencies circulated proposed regulations that, once finalized, would implement Basel III standards for U.S. insured depository institutions and their holding companies.
| 16 |
Basel III places more emphasis than current capital adequacy requirements on “Common Equity Tier 1” capital, or “CET1”, which is predominantly made up of retained earnings and common stock instruments. The following represent important requirements currently under consideration by U.S. bank regulatory agencies in response to Basel III:
| · | Institutions must maintain CET1 equal to 4.5% of risk-weighted assets; |
| · | Institutions must maintain Tier 1 capital (i.e., CET1 and other forms of Tier 1 capital) equal to 6.0% of risk-weighted assets; |
| · | Institutions must maintain total capital (i.e., Tier 1 capital and Tier 2 capital) equal to 8.0% of risk-weighted assets; |
| · | Institutions must maintain an additional “capital conservation buffer” of CET1 equal to 2.5% of risk-weighted assets; |
| · | Institutions must maintain Tier 1 capital equal to 4.0% of total assets; |
| · | Certain large or internationally-exposed institutions must comply with supplementary leverage ratio requirements that take into account both on- and off-balance sheet exposures; |
| · | During periods of excessive credit growth that pose systemic risks in the national and international banking system, certain large or internationally-exposed institutions could become subject to a “countercyclical buffer”, which could require additional CET1 equal to 2.5% of risk-weighted assets; |
| · | Certain instruments that have counted as Tier 1 capital in the past, including certain types of cumulative perpetual preferred stock and trust preferred instruments, no longer will count as Tier 1 capital; |
| · | Regulatory deductions from and adjustments to capital largely will apply to CET1 (instead of Tier 1 or total capital); |
| · | Unrealized gains and losses on available-for-sale debt securities, which are not currently counted for regulatory capital purposes, will be counted for those purposes, which may result in increased volatility of regulatory capital for financial institutions; and |
| · | In determining an institution’s risk-weighted assets, higher risk weights may be attributed to certain types of residential mortgage loans and commercial real estate loans. |
Initially, the U.S. bank regulatory agencies hoped to adopt final rules implementing Basel III by January 1, 2013. However, final rules have not yet been issued. It is anticipated that, once final rules are issued, the Basel III requirements will be implemented over time so that full implementation is achieved by January 2019. Ultimately, through the future implementation of Basel III or other capital adequacy requirements, it is likely that the Company and the Bank will have to maintain higher capital levels than financial institutions are required to maintain today.
| 17 |
Liquidity
Financial institutions are subject to significant regulatory scrutiny regarding their liquidity positions. Various bank regulatory publications, including FDIC Financial Institution Letter FIL-13-2010 (Funding and Liquidity Risk Management) and FDIC Financial Institution Letter FIL-84-2008 (Liquidity Risk Management), address the identification, measurement, monitoring and control of funding and liquidity risk by financial institutions. Regulatory scrutiny regarding liquidity has increased during recent years, as the economic downturn that began in the late 2000s has added pressure to the liquidity of many financial institutions.
In addition to addressing capital objectives, Basel III establishes two new liquidity metrics for financial institutions. The first metric is the “Liquidity Coverage Ratio”, and it aims to require a financial institution to maintain sufficient high quality liquid resources to survive an acute stress scenario that lasts for one month. The second metric is the “Net Stable Funding Ratio”, and its objective is to require a financial institution to maintain a minimum amount of stable sources relative to the liquidity profiles of the institution’s assets, as well as the potential for contingent liquidity needs arising from off-balance sheet commitments, over a one-year horizon.
The Liquidity Coverage Ratio and the Net Stable Funding Ratio are currently being monitored for implementation, with the view that they will be introduced as requirements in 2015 and 2018, respectively. We cannot yet provide concrete estimates as to how those requirements, or any other regulatory positions regarding liquidity and funding, might affect the Company or the Bank. However, we note that increased liquidity requirements generally would be expected to cause the Bank to invest its assets more conservatively—and therefore at lower yields—than it otherwise might invest. Such lower-yield investments likely would reduce the Bank’s revenue stream, and in turn its earnings potential.
Payment of Dividends
We are a legal entity separate and distinct from the Bank. Our principal source of cash flow, including cash flow to pay dividends to our stockholders, is dividends the Bank pays to us as the Bank’s sole stockholder. Statutory and regulatory limitations apply to the Bank’s payment of dividends to us as well as to our payment of dividends to our stockholders. The requirement that a bank holding company must serve as a source of strength to its subsidiary banks also results in the position of the Federal Reserve that a bank holding company should not maintain a level of cash dividends to its stockholders that places undue pressure on the capital of its bank subsidiaries or that can be funded only through additional borrowings or other arrangements that may undermine the bank holding company’s ability to serve as such a source of strength. Our ability to pay dividends is also subject to the provisions of Delaware corporate law.
The Alabama Banking Department also regulates the Bank’s dividend payments. Under Alabama law, a state-chartered bank may not pay a dividend in excess of 90% of its net earnings until the bank’s surplus is equal to at least 20% of its capital (the Bank’s surplus currently exceeds 20% of its capital). Moreover, the Bank is also required by Alabama law to obtain the prior approval of the Superintendent of Banks (the “Superintendent”) for its payment of dividends if the total of all dividends declared by the Bank in any calendar year will exceed the total of (1) the Bank’s net earnings (as defined by statute) for that year, plus (2) its retained net earnings for the preceding two years, less any required transfers to surplus. Based on this, the Bank would be limited to paying $90.1 million in dividends as of December 31, 2012. In addition, no dividends, withdrawals or transfers may be made from the Bank’s surplus without the prior written approval of the Superintendent.
The Bank’s payment of dividends may also be affected or limited by other factors, such as the requirement to maintain adequate capital above regulatory guidelines. The federal banking agencies have indicated that paying dividends that deplete a depository institution’s capital base to an inadequate level would be an unsafe and unsound banking practice. Under the FDIC Improvement Act of 1991, a depository institution may not pay any dividends if payment would cause it to become undercapitalized or if it already is undercapitalized. Moreover, the federal agencies have issued policy statements that provide that bank holding companies and insured banks should generally only pay dividends out of current operating earnings. If, in the opinion of the federal banking regulators, the Bank were engaged in or about to engage in an unsafe or unsound practice, the federal banking regulators could require, after notice and a hearing, that the Bank stop or refrain from engaging in the questioned practice.
Restrictions on Transactions with Affiliates
We are subject to Section 23A of the Federal Reserve Act, which places limits on the amount of:
| · | a bank’s loans or extensions of credit to affiliates; |
| · | a bank’s investment in affiliates; |
| 18 |
| · | assets a bank may purchase from affiliates, except for real and personal property exempted by the Federal Reserve; |
| · | loans or extensions of credit made by a bank to third parties collateralized by the securities or obligations of affiliates; and |
| · | a bank’s guarantee, acceptance or letter of credit issued on behalf of an affiliate. |
The total amount of the above transactions is limited in amount, as to any one affiliate, to 10% of a bank’s capital and surplus and, as to all affiliates combined, to 20% of a bank’s capital and surplus. In addition to the limitation on the amount of these transactions, each of the above transactions must also meet specified collateral requirements. The Bank must also comply with other provisions designed to avoid the taking of low-quality assets.
We are also subject to Section 23B of the Federal Reserve Act, which, among other things, prohibits an institution from engaging in the above transactions with affiliates unless the transactions are on terms substantially the same, or at least as favorable to the institution or its subsidiaries, as those prevailing at the time for comparable transactions with nonaffiliated companies.
The Bank is also subject to restrictions on extensions of credit to its executive officers, directors, principal shareholders and their related interests. These extensions of credit (1) must be made on substantially the same terms, including interest rates and collateral, as those prevailing at the time for comparable transactions with third parties and (2) must not involve more than the normal risk of repayment or present other unfavorable features. There is also an aggregate limitation on all loans to insiders and their related interests. These loans cannot exceed the institution’s total unimpaired capital and surplus, and the FDIC may determine that a lesser amount is appropriate. Insiders are subject to enforcement actions for knowingly accepting loans in violation of applicable restrictions. Alabama state banking laws also have similar provisions.
Lending Limits
Under Alabama law, the amount of loans which may be made by a bank in the aggregate to one person is limited. Alabama law provides that unsecured loans by a bank to one person may not exceed an amount equal to 10% of the capital and unimpaired surplus of the bank or 20% in the case of secured loans. For purposes of calculating these limits, loans to various business interests of the borrower, including companies in which a substantial portion of the stock is owned or partnerships in which a person is a partner, must be aggregated with those made to the borrower individually. Loans secured by certain readily marketable collateral are exempt from these limitations, as are loans secured by deposits and certain government securities.
Commercial Real Estate Concentration Limits
On December 12, 2006, the U.S. bank regulatory agencies issued guidance entitled “Concentrations in Commercial Real Estate Lending, Sound Risk Management Practices” (the “Guidance”) to address increased concentrations in commercial real estate (“CRE”) loans. The Guidance describes the criteria the Agencies will use as indicators to indentify institutions potentially exposed to CRE concentration risk. An institution that has (1) experienced rapid growth in CRE lending, (2) notable exposure to a specific type of CRE, (3) total reported loans for construction, land development, and other land representing 100% or more of the institution’s capital, or (4) total CRE loans representing 300% or more of the institution’s capital, and the outstanding balance of the institutions CRE portfolio has increased by 50% or more in the prior 36 months, may be identified for further supervisory analysis of the level and nature of its CRE concentration risk.
Privacy
Financial institutions are required to disclose their policies for collecting and protecting confidential information of customers. Customers generally may prevent financial institutions from sharing nonpublic personal financial information with nonaffiliated third parties except under certain circumstances, such as the processing of transactions requested by the consumer or when the financial institution is jointly sponsoring a product or service with certain nonaffiliated third parties. Additionally, financial institutions generally may not disclose consumer account numbers to any nonaffiliated third party for use in telemarketing, direct mail marketing or other marketing to consumers.
| 19 |
Consumer Credit Reporting
The Fair Credit Reporting Act (the “FCRA”) imposes, among other things:
| · | requirements for financial institutions to develop policies and procedures to identify potential identity theft and, upon the request of a consumer, place a fraud alert in the consumer’s credit file stating that the consumer may be the victim of identity theft or other fraud; |
| · | requirements for entities that furnish information to consumer reporting agencies (which would include the Bank) to implement procedures and policies regarding the accuracy and integrity of the furnished information and regarding the correction of previously furnished information that is later determined to be inaccurate; and |
| · | requirements for mortgage lenders to disclose credit scores to consumers. |
The FCRA also prohibits a business that receives consumer information from an affiliate from using that information for marketing purposes unless the consumer is first provided notice and an opportunity to direct the business not to use the information for such marketing purposes (the “opt-out”), subject to certain exceptions. We do not share consumer information between us and the Bank for marketing purposes, except as allowed under exceptions to the notice and opt-out requirements. Since we do not share consumer information between us and the Bank, the limitations on sharing of information for marketing purposes do not have a significant impact on us.
Anti-Terrorism and Money Laundering Legislation
The Bank is subject to the Uniting and Strengthening America by Providing Appropriate Tools Required to Intercept and Obstruct Terrorism Act (the “USA PATRIOT Act”), the Bank Secrecy Act, and the requirements of the Office of Foreign Assets Control (the “OFAC”). These statutes and related rules and regulations impose requirements and limitations on specified financial transactions and account and other relationships intended to guard against money laundering and terrorism financing. The Bank has established a customer identification program pursuant to Section 326 of the USA PATRIOT Act and the Bank Secrecy Act, and otherwise has implemented policies and procedures to comply with the foregoing requirements.
Proposed Legislation and Regulatory Action
New regulations and statutes are regularly proposed that contain wide-ranging proposals for altering the structures, regulations and competitive relationships of financial institutions operating or doing business in the United States. We cannot predict whether or in what form any proposed regulation or statute will be adopted or the extent to which our business may be affected by any new regulation or statute.
Effect of Governmental Monetary Policies
The Bank’s earnings are affected by domestic economic conditions and the monetary and fiscal policies of the United States government and its agencies. The Federal Reserve’s monetary policies have had, and are likely to continue to have, an important impact on the operating results of commercial banks through its power to implement national monetary policy in order, among other things, to curb inflation or combat a recession. The monetary policies of the Federal Reserve affect the levels of bank loans, investments and deposits through its control over the issuance of United States government securities, its regulation of the discount rate applicable to member banks and its influence over reserve requirements to which member banks are subject. We cannot predict, and have no control over, the nature or impact of future changes in monetary and fiscal policies.
Sarbanes-Oxley Act of 2002
The Sarbanes-Oxley Act of 2002 represents a comprehensive revision of laws affecting corporate governance, accounting obligations and corporate reporting. The Sarbanes-Oxley Act is applicable to all companies with equity securities registered, or that file reports, under the Securities Exchange Act of 1934. In particular, the act established (i) requirements for audit committees, including independence, expertise and responsibilities; (ii) responsibilities regarding financial statements for the chief executive officer and chief financial officer of the reporting company and new requirements for them to certify the accuracy of periodic reports; (iii) standards for auditors and regulation of audits; (iv) disclosure and reporting obligations for the reporting company and its directors and executive officers; and (v) civil and criminal penalties for violations of the federal securities laws. The legislation also established a new accounting oversight board to enforce auditing standards and restrict the scope of services that accounting firms may provide to their public company audit clients.
| 20 |
Recent Federal Legislation relating to Financial Institutions
On July 21, 2010, the Dodd-Frank Wall Street Reform and Consumer Protection Act (the “Dodd-Frank Act”) was signed into law. As final rules and regulations implementing the Dodd-Frank Act are adopted, this new law is significantly changing the bank regulatory structure and affecting the lending, deposit, investment, trading and operating activities of financial institutions and their holding companies. The Dodd-Frank Act requires various federal agencies to adopt a broad range of new implementing rules and regulations and to prepare numerous studies and reports for Congress. The federal agencies are given significant discretion in drafting the implementing rules and regulations, and consequently, many of the details and much of the impact of the Dodd-Frank Act may not be known for many years.
The Dodd-Frank Act eliminated the federal prohibitions on paying interest on demand deposits effective one year after the date of its enactment, thus allowing businesses to have interest-bearing checking accounts. Depending on competitive responses, this significant change to existing law could have an adverse impact on our interest expense.
The Dodd-Frank Act also broadens the base for FDIC insurance assessments. Assessments will now be based on the average consolidated total assets less tangible equity capital of a financial institution. The Dodd-Frank Act permanently increases the maximum amount of deposit insurance for banks, savings institutions and credit unions to $250,000 per depositor. Noninterest-bearing transaction accounts and certain attorney’s trust accounts had unlimited deposit insurance through December 31, 2012.
The Dodd-Frank Act requires publicly traded companies to give stockholders a non-binding vote on executive compensation and golden parachute payments. In addition, the Dodd-Frank Act authorizes the Securities and Exchange Commission to promulgate rules that would allow stockholders to nominate their own candidates using a company’s proxy materials and directs the federal banking regulators to issue rules prohibiting incentive compensation that encourages inappropriate risks.
The Dodd-Frank Act created a new Consumer Financial Protection Bureau with broad powers to supervise and enforce consumer protection laws. The Bureau now has broad rule-making authority for a wide range of consumer protection laws that apply to all banks, including the authority to prohibit “unfair, deceptive or abusive” acts and practices. The Bureau has examination and enforcement authority over all banks with more than $10 billion in assets. Institutions with less than $10 billion in assets will continue to be examined for compliance with consumer laws by their primary bank regulator.
The Dodd-Frank Act imposed new requirements regarding the origination and servicing of residential mortgage loans. The law created a variety of new consumer protections, including limitations on the manner by which loan originators may be compensated and an obligation on the part of lenders to verify a borrower’s “ability to repay” a residential mortgage loan. Final rules implementing these latter statutory requirements have been released and will be generally effective in 2014.
As noted above, many aspects of the Dodd-Frank Act are subject to rulemaking and will take effect over several years, making it difficult to anticipate the overall financial impact on us. However, compliance with this new law and its implementing regulations clearly will result in additional operating and compliance costs that could have a material adverse effect on our business, financial condition and results of operations.
Recent government efforts to strengthen the U.S. financial system, including the implementation of the American Recovery and Reinvestment Act (“ARRA”), the Emergency Economic Stabilization Act (“EESA”), the Dodd-Frank Act, and special assessments imposed by the FDIC, subject us, to the extent applicable, to additional regulatory fees, corporate governance requirements, restrictions on executive compensation, restrictions on declaring or paying dividends, restrictions on stock repurchases, limits on tax deductions for executive compensation and prohibitions against golden parachute payments. These fees, requirements and restrictions, as well as any others that may be imposed in the future, may have a material adverse effect on our business, financial condition, and results of operations.
Available Information
Our corporate website is www.servisfirstbank.com. We have direct links on this website to our Code of Ethics and the charters for our Audit, Compensation and Corporate Governance and Nominations Committees by clicking on the “Investor Relations” tab. We also have direct links to our filings with the Securities and Exchange Commission (SEC), including, but not limited to, our annual reports on Form 10-K, Quarterly Reports on Form 10-Q, Current Reports on Form 8-K, proxy statements and any amendments to these filings. You may also obtain a copy of any such report from us free of charge by requesting such copy in writing to 850 Shades Creek Parkway, Suite 200, Birmingham, Alabama 35209, Attention: Chief Financial Officer. This annual report and accompanying exhibits and all other reports and filings that we file with the SEC will be available for the public to view and copy (at prescribed rates) at the SEC’s Public Reference Room at 100 F Street, Washington, D.C. 20549. You may also obtain copies of such information at the prescribed rates from the SEC’s Public Reference Room by calling the SEC at 1-800-SEC-0330. The SEC also maintains a website that contains such reports, proxy and information statements, and other information we file electronically with the SEC. You may access this website by clicking on http://www.sec.gov.
| 21 |
Executive Officers of the Registrant
The business experience of our executive officers who are not also directors is set forth below.
William M. Foshee (58) – Mr. Foshee has served as our Executive Vice President, Chief Financial Officer, Treasurer and Secretary since 2007 and as Executive Vice President, Chief Financial Officer, Treasurer and Secretary of the Bank since 2005. Mr. Foshee served as the Chief Financial Officer of Heritage Financial Holding Corporation from 2002 until it was acquired in 2005. Mr. Foshee is a Certified Public Accountant.
Clarence C. Pouncey, III (56) – Mr. Pouncey has served as our Executive Vice President and Chief Operating Officer since 2007 and Executive Vice President and Chief Operating Officer of the Bank since November 2006 and also served as Chief Risk Officer of the Bank from March 2006 until November 2006. Prior to joining the Company, Mr. Pouncey was employed by SouthTrust Bank (now Wells Fargo Bank) in various capacities from 1978 to 2006, most recently as the Senior Vice President and Regional Manager of Real Estate Financial Services.
Andrew N. Kattos (43) – Mr. Kattos has served as Executive Vice President and Huntsville President and Chief Executive Officer of the Bank since April 2006. Prior to joining the Company, Mr. Kattos was employed by First Commercial Bank for 14 years, most recently as an Executive Vice President and Senior Lender in the Commercial Lending Department. Mr. Kattos also serves on the advisory council of the University of Alabama in Huntsville School of Business.
G. Carlton Barker (64) – Mr. Barker has served as Executive Vice President and Montgomery President and Chief Executive Officer of the Bank since February 1, 2007. Prior to joining the Company, Mr. Barker was employed by Regions Bank for 19 years in various capacities, most recently as the Regional President for the Southeast Alabama Region. Mr. Barker serves on the Huntingdon College Board of Trustee.
Ronald A. DeVane (61) – Mr. DeVane has served as Executive Vice President and Dothan President and Chief Executive Officer of the Bank since August 2008. Prior to joining the Company, Mr. DeVane held various positions with Wachovia Bank and SouthTrust Bank until his retirement in 2006, including CEO for the Wachovia Midsouth Region, which encompassed Alabama, Tennessee, Mississippi and the Florida panhandle, from September 2004 until 2006, CEO of the Community Bank Division of SouthTrust from January 2004 until September 2004, and CEO for SouthTrust Bank of Atlanta and North Georgia from July 2002 until December 2003. Mr. DeVane is a Trustee at Samford University, a member of the Troy University Foundation Board, a Trustee of the Southeast Alabama Medical Center Foundation Board, and a Board Member of the National Peanut Festival Association.
Rex D. McKinney (50) – Mr. McKinney has served as Executive Vice President and Pensacola President and Chief Executive Officer of the Bank since January 2011. Prior to joining the Company, Mr. McKinney held several leadership positions at First American Bank/Coastal Bank and Trust (owned by Synovus Financial Corporation) starting in 1997. Mr. McKinney is on the Membership Committee and a Past Board Member of the Rotary Club of Pensacola. He is Past President of the Pensacola Sports Association, Board Member and Finance Committee Member for the United Way of Escambia County, Finance Committee Member for Christ Episcopal Church, Finance Committee Member for the Pensacola Country Club, Member of the Irish Politicians Club, and Board Member of the Order of Tristan.
ITEM 1A. RISK FACTORS.
An investment in our common stock involves risks. Before deciding to invest in our common stock, you should carefully consider the risks described below, together with our consolidated financial statements and the related notes and the other information included in this annual report. The discussion below presents material risks associated with an investment in our common stock. Our business, financial condition and results of operation could be harmed by any of the following risks or by other risks identified in this annual report, as well as by other risks we may not have anticipated or viewed as material. In such a case, the value of our common stock could decline, and you may lose all or part of your investment. The risks discussed below also include forward-looking statements, and our actual results may differ substantially from those discussed in these forward-looking statements. See also “Cautionary Note Regarding Forward-Looking Statements”.
| 22 |
Risks Related to Our Industry
Financial reform legislation will, among other things, tighten capital standards, create a new Consumer Financial Protection Bureau and result in new regulations that are likely to increase our costs of operations.
On July 21, 2010, the Dodd-Frank Wall Street Reform and Consumer Protection Act (the “Dodd-Frank Act”) was signed into law. As final rules and regulations implementing the Dodd-Frank Act are adopted, this law is significantly changing the current bank regulatory structure and affecting the lending, deposit, investment, trading and operating activities of financial institutions and their holding companies. The Dodd-Frank Act requires various federal agencies to adopt a broad range of new implementing rules and regulations and to prepare numerous studies and reports for Congress. The federal agencies are given significant discretion in drafting the implementing rules and regulations, and consequently, many of the details and much of the impact of the Dodd-Frank Act may not be known for many years.
The Dodd-Frank Act eliminated the federal prohibitions on paying interest on demand deposits effective one year after the date of its enactment, thus allowing businesses to have interest-bearing checking accounts. Depending on competitive responses, this significant change to existing law could have an adverse impact on our interest expense.
The Dodd-Frank Act also broadens the base for FDIC insurance assessments. Assessments are now based on the average consolidated total assets less tangible equity capital of a financial institution. The Dodd-Frank Act permanently increases the maximum amount of deposit insurance for banks, savings institutions and credit unions to $250,000 per depositor. Noninterest-bearing transaction accounts and certain attorney’s trust accounts had unlimited deposit insurance through December 31, 2012.
The Dodd-Frank Act requires publicly traded companies to give stockholders a non-binding vote on executive compensation and golden parachute payments. In addition, the Dodd-Frank Act authorizes the Securities and Exchange Commission to promulgate rules that would allow stockholders to nominate their own candidates using a company’s proxy materials and directs the federal banking regulators to issue rules prohibiting incentive compensation that encourages inappropriate risks.
The Dodd-Frank Act created a new Consumer Financial Protection Bureau with broad powers to supervise and enforce consumer protection laws. The Bureau now has broad rule-making authority for a wide range of consumer protection laws that apply to all banks, including the authority to prohibit “unfair, deceptive or abusive” acts and practices. The Bureau has examination and enforcement authority over all banks with more than $10 billion in assets. Institutions with less than $10 billion in assets will continue to be examined for compliance with consumer laws by their primary bank regulator.
As noted above, many aspects of the Dodd-Frank Act are subject to rulemaking and will take effect over several years, making it difficult to anticipate the overall financial impact on us. However, compliance with this new law and its implementing regulations clearly will result in additional operating and compliance costs that could have a material adverse effect on our business, financial condition and results of operations.
Additional regulatory requirements especially those imposed under ARRA, EESA or other legislation intended to strengthen the U.S. financial system, could adversely affect us.
Recent government efforts to strengthen the U.S. financial system, including the implementation of the American Recovery and Reinvestment Act (“ARRA”), the Emergency Economic Stabilization Act (“EESA”), the Dodd-Frank Act, and special assessments imposed by the FDIC, subject us, to the extent applicable, to additional regulatory fees, corporate governance requirements, restrictions on executive compensation, restrictions on declaring or paying dividends, restrictions on stock repurchases, limits on tax deductions for executive compensation and prohibitions against golden parachute payments. These fees, requirements and restrictions, as well as any others that may be imposed in the future, may have a material and adverse effect on our business, financial condition, and results of operations.
Recent market conditions have adversely affected, and may continue to adversely affect, us, our customers and our industry.
Because our business is focused exclusively in the southeastern United States, we are particularly exposed to downturns in the U.S. economy in general and in the southeastern economy in particular. Beginning with the economic recession in 2008 and continuing through 2010, falling home prices, increasing foreclosures, unemployment and under-employment, have negatively impacted the credit performance of mortgage loans and resulted in significant write-downs of asset values by financial institutions, including government-sponsored entities as well as major commercial and investment banks. These write-downs, initially of mortgage-backed securities but spreading to credit default swaps and other derivative and cash securities, in turn, have caused many financial institutions to seek additional capital, to merge with larger and stronger institutions and, in some cases, to fail. Reflecting concern about the stability of the financial markets generally and the strength of counterparties, many lenders and institutional investors have reduced or ceased providing funding to borrowers, including to other financial institutions. This market turmoil and tightening of credit has led to an increased level of commercial and consumer delinquencies, lack of consumer confidence, increased market volatility and widespread reduction of business activity generally. The resulting economic pressure on consumers and businesses and lack of confidence in the financial markets may adversely affect our customers and thus our business, financial condition, and results of operations. A return of these conditions in the near future would likely exacerbate the adverse effects of these difficult market conditions on us and others in the financial institutions industry.
| 23 |
Current market volatility and industry developments may adversely affect our business and financial results.
The volatility in the capital and credit markets, along with the housing declines over the past four years, has resulted in significant pressure on the financial services industry. We have experienced a higher level of foreclosures and higher losses upon foreclosure than we have historically. If current volatility and market conditions continue or worsen, there can be no assurance that our industry, results of operations or our business will not be significantly adversely impacted. We may have further increases in loan losses, deterioration of capital or limitations on our access to funding or capital, if needed.
Further, if other, particularly larger, financial institutions continue to fail to be adequately capitalized or funded, it may negatively impact our business and financial results. We routinely interact with numerous financial institutions in the ordinary course of business and are therefore exposed to operational and credit risk to those institutions. Failures of such institutions may significantly adversely impact our operations.
Our profitability is vulnerable to interest rate fluctuations.
As a financial institution, our earnings can be significantly affected by changes in interest rates, particularly our net interest income, the rate of loan prepayments, the volume and type of loans originated or produced, the sales of loans on the secondary market and the value of our mortgage servicing rights. Our profitability is dependent to a large extent on our net interest income, which is the difference between our income on interest-earning assets and our expense on interest-bearing liabilities. We are affected by changes in general interest rate levels and by other economic factors beyond our control.
Changes in interest rates also affect the average life of loans and mortgage-backed securities. The relatively lower interest rates in recent periods have resulted in increased prepayments of loans and mortgage-backed securities as borrowers have refinanced their mortgages to reduce their borrowing costs. Under these circumstances, we are subject to reinvestment risk to the extent that we are not able to reinvest such prepayments at rates which are comparable to the rates on the prepaid loans or securities.
We are subject to extensive regulation that could limit or restrict our activities and impose financial requirements or limitations on the conduct of our business, which limitations or restrictions could have a material adverse effect on our profitability.
We operate in a highly regulated industry and are subject to examination, supervision and comprehensive regulation by various federal and state agencies including the Federal Reserve, the FDIC and the Alabama Banking Department. Regulatory compliance is costly and restricts certain of our activities, including payment of dividends, mergers and acquisitions, investments, loans and interest rates charged, and interest rates paid on deposits. We are also subject to capitalization guidelines established by our regulators, which require us to maintain adequate capital to support our growth. Violations of various laws, even if unintentional, may result in significant fines or other penalties, including restrictions on branching or bank acquisitions. Recently, banks generally have faced increased regulatory sanctions and scrutiny particularly with respect to the USA Patriot Act and other statutes relating to anti-money laundering compliance and customer privacy. The recent recession had major adverse effects on the banking and financial industry, during which time many institutions saw a significant amount of their market capitalization erode as they charged off loans and wrote down the value of other assets. As described above, recent legislation has substantially changed, and increased, federal regulation of financial institutions, and there may be significant future legislation (and regulations under existing legislation) that could have a further material effect on banks and bank holding companies like us.
The laws and regulations applicable to the banking industry could change at any time, and we cannot predict the effects of these changes on our business and profitability. Because government regulation greatly affects the business and financial results of all commercial banks and bank holding companies, our cost of compliance could adversely affect our ability to operate profitably. We are subject to the reporting requirements of the Securities Exchange Act of 1934, the Sarbanes-Oxley Act of 2002 (“Sarbanes-Oxley Act”), and the related rules and regulations promulgated by the Securities and Exchange Commission. These laws and regulations increase the scope, complexity and cost of corporate governance, reporting and disclosure practices over those of non-public companies. Despite our conducting business in a highly regulated environment, these laws and regulations have different requirements for compliance than we experienced prior to becoming a public company. Our expenses related to services rendered by our accountants, legal counsel and consultants will increase in order to ensure compliance with these laws and regulations that we will be subject to as a public company and may increase further as we grow in size.
| 24 |
Changes in monetary policies may have a material adverse effect on our business.
Like all regulated financial institutions, we are affected by monetary policies implemented by the Federal Reserve and other federal instrumentalities. A primary instrument of monetary policy employed by the Federal Reserve is the restriction or expansion of the money supply through open market operations. This instrument of monetary policy frequently causes volatile fluctuations in interest rates, and it can have a direct, material adverse effect on the operating results of financial institutions including our business. Borrowings by the United States government to finance government debt may also cause fluctuations in interest rates and have similar effects on the operating results of such institutions.
Risks Related To Our Business
Our construction and land development loan portfolio and commercial and industrial loan portfolio are both subject to unique risks that could have a material adverse effect on our financial condition and results of operations.
The severity of the decline in the U.S. economy has adversely affected the performance and market value of many of our loans. Several years of decline and stagnation in the residential housing market have directly affected our construction and land development loans, while unemployment and general economic weakness have adversely affected parts of our commercial and industrial loan portfolio. Our construction and land development loan portfolio was $158.4 million at December 31, 2012, comprising 6.7% of our total loans. Our commercial and industrial loans were $1,031.0 million at December 31, 2012, comprising 43.6% of our total loans. Construction loans are often riskier than home equity loans or residential mortgage loans to individuals. In the event of a general economic slowdown like the one we are currently experiencing, these loans sometimes represent higher risk due to slower sales and reduced cash flow that could negatively affect the borrowers’ ability to repay on a timely basis. We, as well as our competitors, have experienced a significant increase in impaired and non-accrual construction and land development loans and commercial and industrial loans. We believe we have established adequate reserves with respect to such loans, although there can be no assurance that our actual loan losses will not be greater or less than we have anticipated in establishing such reserves. At December 31, 2012, we had an allowance for loan losses of $26.3 million, of which $6.5 million, or 24.7%, was allocated to real estate construction loans, and $8.2 million, or 31.2%, was allocated to commercial and industrial loans.
In addition, although regulations and regulatory policies affecting banks and financial services companies undergo continuous change and we cannot predict when changes will occur or the ultimate effect of any changes, there has been recent regulatory focus on construction, development and other commercial real estate lending. Recent changes in the federal policies applicable to construction, development or other commercial real estate loans subject us to substantial limitations with respect to making such loans, increase the costs of making such loans, and require us to have a greater amount of capital to support this kind of lending, all of which could have a material adverse effect on our financial condition and results of operations.
Our decisions regarding credit risk could be inaccurate and our allowance for loan losses may be inadequate, which could have a material adverse effect on our business, financial condition, results of operations and future prospects.
Our earnings are affected by our ability to make loans, and thus we could sustain significant loan losses and consequently significant net losses if we incorrectly assess either the creditworthiness of our borrowers resulting in loans to borrowers who fail to repay their loans in accordance with the loan terms or the value of the collateral securing the repayment of their loans, or we fail to detect or respond to a deterioration in our loan quality in a timely manner. Management makes various assumptions and judgments about the collectability of our loan portfolio, including the creditworthiness of our borrowers and the value of the real estate and other assets serving as collateral for the repayment of many of our loans. We maintain an allowance for loan losses that we consider adequate to absorb losses inherent in the loan portfolio based on our assessment of the information available. In determining the size of our allowance for loan losses, we rely on an analysis of our loan portfolio based on historical loss experience, volume and types of loans, trends in classification, volume and trends in delinquencies and non-accruals, national and local economic conditions and other pertinent information. We target small and medium-sized businesses as loan customers. Because of their size, these borrowers may be less able to withstand competitive or economic pressures than larger borrowers in periods of economic weakness. Also, as we expand into new markets, our determination of the size of the allowance could be understated due to our lack of familiarity with market-specific factors. Despite the effects of the ongoing economic decline, we believe our allowance for loan losses is adequate. Our allowance for loan losses as of December 31, 2012 was $26.3 million, or 1.11% of total gross loans as of year-end.
| 25 |
If our assumptions are inaccurate, we may incur loan losses in excess of our current allowance for loan losses and be required to make material additions to our allowance for loan losses which could consequently materially and adversely affect our business, financial condition, results of operations and future prospects.
However, even if our assumptions are accurate, federal and state regulators periodically review our allowance for loan losses and could require us to materially increase our allowance for loan losses or recognize further loan charge-offs based on judgments different than those of our management. Any material increase in our allowance for loan losses or loan charge-offs as required by these regulatory agencies could consequently materially and adversely affect our business, financial condition, results of operations and future prospects.
If we fail to maintain effective internal controls over financial reporting or remediate any future material weakness in our internal control over financial reporting, we may be unable to accurately report our financial results or prevent fraud, which could have a material adverse effect on our financial condition and results of operations.
Our internal controls over financial reporting are designed to provide reasonable assurance regarding the reliability of the financial reporting and the preparation of financial statements for external purposes in accordance with generally accepted accounting principles. Effective internal controls over financial reporting are necessary for us to provide reliable reports and prevent fraud.
We believe that a control system, no matter how well designed and operated, can provide only reasonable, not absolute, assurance that the objectives of the control system are met. Because of the inherent limitations in all control systems, no evaluation of controls can provide absolute assurance that all control issues and instances of fraud, if any, within a company have been detected. We cannot guarantee that we will not identify significant deficiencies and/or material weaknesses in our internal controls in the future, and our failure to maintain effective internal controls over financial reporting in accordance with Section 404 of the Sarbanes-Oxley Act could have a material adverse effect on our financial condition and results of operations.
Our business strategy includes the continuation of our growth plans, and our financial condition and results of operations could be negatively affected if we fail to grow or fail to manage our growth effectively.
We intend to continue pursuing our growth strategy for our business through organic growth of our loan portfolio. Our prospects must be considered in light of the risks, expenses and difficulties that can be encountered by financial service companies in rapid growth stages, which include the risks associated with the following:
| · | maintaining loan quality; |
| · | maintaining adequate management personnel and information systems to oversee such growth; |
| · | maintaining adequate control and compliance functions; and |
| · | securing capital and liquidity needed to support anticipated growth. |
We may not be able to expand our presence in our existing markets or successfully enter new markets, and any expansion could adversely affect our results of operations. Failure to manage our growth effectively could have a material adverse effect on our business, future prospects, financial condition or results of operations, and could adversely affect our ability to successfully implement our business strategy. Our ability to grow successfully will depend on a variety of factors, including the continued availability of desirable business opportunities, the competitive responses from other financial institutions in our market areas and our ability to manage our growth.
Our continued pace of growth will require us to raise additional capital in the future to fund such growth, and the unavailability of additional capital or on terms acceptable to us could adversely affect our growth and/or our financial condition and results of operations.
We are required by federal and state regulatory authorities to maintain adequate levels of capital to support our operations. To support our recent and ongoing growth, we have completed a series of capital transactions during the past three years, including:
| · | the sale of $15,000,000 in 6.0% Mandatory Convertible Trust Preferred Securities by our second statutory trust, ServisFirst Capital Trust II, on March 15, 2010; |
| 26 |
| · | the sale of an aggregate of 340,000 shares of our common stock at $30 per share, or $10,200,000, in a private placement completed on June 30, 2011; and |
| · | the sale of $20,000,000 in 5.5% Subordinated Notes due November 9, 2022 to accredited investor purchasers, the proceeds of which were used to pay off $15,000,000 in 8.5% subordinated debentures. |
After giving effect to these transactions, we believe that we will have sufficient capital to meet our capital needs for our immediate growth plans. However, we will continue to need capital to support our longer-term growth plans. If capital is not available on favorable terms when we need it, we will have to either issue common stock or other securities on less than desirable terms or reduce our rate of growth until market conditions become more favorable. In either of such events, our financial condition and results of operations may be adversely affected.
Competition from financial institutions and other financial service providers may adversely affect our profitability.
The banking business is highly competitive, and we experience competition in our markets from many other financial institutions. We compete with commercial banks, credit unions, savings and loan associations, mortgage banking firms, consumer finance companies, securities brokerage firms, insurance companies, money market funds, and other mutual funds, as well as other community banks and super-regional and national financial institutions that operate offices in our service areas.
Additionally, we face competition in our service areas from de novo community banks, including those with senior management who were previously affiliated with other local or regional banks or those controlled by investor groups with strong local business and community ties. These new, smaller competitors are likely to cater to the same small and medium-size business clientele and with similar relationship-based approaches as we do. Moreover, with their initial capital base to deploy, they could seek to rapidly gain market share by under-pricing the current market rates for loans and paying higher rates for deposits. These de novo community banks may offer higher deposit rates or lower cost loans in an effort to attract our customers, and may attempt to hire our management and employees.
We compete with these other financial institutions both in attracting deposits and in making loans. In addition, we must attract our customer base from other existing financial institutions and from new residents. We expect competition to increase in the future as a result of legislative, regulatory and technological changes and the continuing trend of consolidation in the financial services industry. Our profitability depends upon our continued ability to successfully compete with an array of financial institutions in our service areas.
Unpredictable economic conditions or a natural disaster in the State of Alabama or the panhandle of the State of Florida, particularly the Birmingham-Hoover, Huntsville, Montgomery and Dothan, Alabama MSAs or the Pensacola-Ferry Pass-Brent, Florida MSA, may have a material adverse effect on our financial performance.
Substantially all of our borrowers and depositors are individuals and businesses located and doing business in our primary service areas within the state of Alabama and the panhandle of the state of Florida. Therefore, our success will depend on the general economic conditions in Alabama and Florida, and more particularly in Jefferson, Shelby, Madison, Houston and Montgomery Counties in Alabama and Escambia and Santa Rosa Counties in Florida, which we cannot predict with certainty. Unlike with many of our larger competitors, the majority of our borrowers are commercial firms, professionals and affluent consumers located and doing business in such local markets. As a result, our operations and profitability may be more adversely affected by a local economic downturn or natural disaster in Alabama or Florida, particularly in such markets, than those of larger, more geographically diverse competitors. For example, a downturn in the economy of any of our MSAs could make it more difficult for our borrowers in those markets to repay their loans and may lead to loan losses that we cannot offset through operations in other markets until we can expand our markets further. Our entry into the Pensacola market increased our exposure to potential losses associated with hurricanes and similar natural disasters that are more common on the Gulf Coast than in our historical markets.
We encounter technological change continually and have fewer resources than many of our competitors to invest in technological improvements.
The financial services industry is undergoing rapid technological changes, with frequent introductions of new technology-driven products and services. In addition to serving customers better, the effective use of technology increases efficiency and enables financial institutions to reduce costs. Our success will depend in part on our ability to address our customers’ needs by using technology to provide products and services that will satisfy customer demands for convenience, as well as to create additional efficiencies in our operations. Many of our competitors have substantially greater resources to invest in technological improvements than we have. We may not be able to implement new technology-driven products and services effectively or be successful in marketing these products and services to our customers. As these technologies are improved in the future, we may, in order to remain competitive, be required to make significant capital expenditures, which may increase our overall expenses and have a material adverse effect on our net income.
| 27 |
We may encounter system failure or breaches of our network security, which could subject us to increased operating costs as well as litigation and other liabilities.
The computer systems and network infrastructure we use could be vulnerable to unforeseen problems. Our operations are dependent upon our ability to protect our computer equipment against physical damage or loss, as well as from security breaches, denial of service attacks, viruses, worms and other disruptive problems caused by hackers. Computer break-ins, phishing and other disruptions could also jeopardize the security of information stored in and transmitted through our computer systems and network infrastructure, which may result in significant liability to us. While we, with the help of third party service providers, intend to continue to implement security systems and establish operational procedures designed to detect and prevent such break-ins, phishing and other disruptions, there can be no assurance that these systems and procedures will be successful.
Lower lending limits than many of our competitors may limit our ability to attract borrowers.
During our early years of operation, and likely for many years thereafter, our legally mandated lending limits will be lower than those of many of our competitors because we will have less capital than such competitors. Our lower lending limits may discourage borrowers with lending needs that exceed those limits from doing business with us. While we may try to serve these borrowers by selling loan participations to other financial institutions, this strategy may not succeed.
We may not be able to successfully expand into new markets.
We have opened new offices and operations in three primary markets (Dothan and Mobile, Alabama and Pensacola, Florida) in the past four years. We may not be able to successfully manage this growth with sufficient human resources, training and operational, financial and technological resources. Any such failure could have a material adverse effect on our operating results and financial condition and our ability to expand into new markets.
Our recent results may not be indicative of our future results, and may not provide guidance to assess the risk of an investment in our common stock.
We may not be able to sustain our historical rate of growth and may not even be able to expand our business at all. In addition, our recent growth may distort some of our historical financial ratios and statistics. In the future, we may not have the benefit of several factors that were favorable until late 2008, such as a rising interest rate environment, a strong residential housing market or the ability to find suitable expansion opportunities. Various factors, such as economic conditions, regulatory and legislative considerations and competition, may also impede or prohibit our ability to expand our market presence. As a small commercial bank, we have different lending risks than larger banks. We provide services to our local communities; thus, our ability to diversify our economic risks is limited by our own local markets and economies. We lend primarily to small to medium-sized businesses, which may expose us to greater lending risks than those faced by banks lending to larger, better-capitalized businesses with longer operating histories. We manage our credit exposure through careful monitoring of loan applicants and loan concentrations in particular industries, and through our loan approval and review procedures. Our use of historical and objective information in determining and managing credit exposure may not be accurate in assessing our risk.
We are dependent on the services of our management team and board of directors, and the unexpected loss of key officers or directors may adversely affect our operations.
If any of our or the Bank’s executive officers, other key personnel, or directors leaves us or the Bank, our operations may be adversely affected. In particular, we believe that Thomas A. Broughton III is extremely important to our success and the Bank. Mr. Broughton has extensive executive-level banking experience and is the President and Chief Executive Officer of us and the Bank. If he leaves his position for any reason, our financial condition and results of operations may suffer. The Bank is the beneficiary of a key man life insurance policy on the life of Mr. Broughton in the amount of $5 million. Also, we have hired key officers to run our banking offices in each of the Huntsville, Montgomery and Dothan, Alabama markets and the Pensacola, Florida market, who are extremely important to our success in such markets. If any of them leaves for any reason, our results of operations could suffer in such markets. With the exception of the key officers in charge of our Huntsville, Montgomery and Dothan banking offices, we do not have employment agreements or non-competition agreements with any of our executive officers, including Mr. Broughton. In the absence of these types of agreements, our executive officers are free to resign their employment at any time and accept an offer of employment from another company, including a competitor. Additionally, our directors’ and advisory board members’ community involvement and diverse and extensive local business relationships are important to our success. If the composition of our board of directors changes materially, our business may also suffer. Similarly, if the composition of the respective advisory boards of the Bank change materially, our business may suffer in such markets.
| 28 |
Our directors and executive officers own a significant portion of our common stock and can exert influence over our business and corporate affairs.
Our directors and executive officers, as a group, beneficially owned approximately 16.26% of our outstanding common stock as of December 31, 2012. As a result of their ownership, the directors and executive officers will have the ability, by voting their shares in concert, to influence the outcome of all matters submitted to our stockholders for approval, including the election of directors.
We engage in lending secured by real estate and may be forced to foreclose on the collateral and own the underlying real estate, subjecting us to the costs associated with the ownership of the real property.
Since we originate loans secured by real estate, we may have to foreclose on the collateral property to protect our investment and may thereafter own and operate such property, in which case we are exposed to the risks inherent in the ownership of real estate.
The amount that we, as a mortgagee, may realize after a default is dependent upon factors outside of our control, including, but not limited to:
| · | general or local economic conditions; |
| · | environmental cleanup liability; |
| · | neighborhood assessments; |
| · | interest rates; |
| · | real estate tax rates; |
| · | operating expenses of the mortgaged properties; |
| · | supply of and demand for rental units or properties; |
| · | ability to obtain and maintain adequate occupancy of the properties; |
| · | zoning laws; |
| · | governmental and regulatory rules; |
| · | fiscal policies; and |
| · | natural disasters. |
Risks Related to Our Common Stock
We have no current plans to pay dividends on our common stock.
We paid a cash dividend of $0.50 per common share on December 31, 2012. This was our first dividend and we have no current intentions to pay dividends in the near future. In addition, our ability to pay dividends is subject to regulatory limitations.
| 29 |
Under Alabama law, a state bank may not pay a dividend in excess of 90% of its net earnings until the bank’s surplus is equal to at least 20% of its capital. As of December 31, 2012, the Bank’s surplus was equal to 50.1% of the Bank’s capital. The Bank is also required by Alabama law to obtain the prior approval of the Alabama Superintendent of Banks (the “Superintendent”) for its payment of dividends if the total of all dividends declared by the Bank in any calendar year will exceed the total of (1) the Bank’s net earnings (as defined by statute) for that year, plus (2) its retained net earnings for the preceding two years, less any required transfers to surplus. In addition, no dividends, withdrawals or transfers may be made from the Bank’s surplus without the prior written approval of the Superintendent.
There are limitations on your ability to transfer your common stock.
There is no public trading market for the shares of our common stock, and we have no current plans to list our common stock on any exchange. However, a brokerage firm may create a market for our common stock on the OTC/Bulletin Board or Pink Sheets without our participation or approval upon the filing and approval by the FINRA OTC Compliance Unit of a Form 211. As a result, unless a Form 211 is filed and approved, stockholders who may wish or need to dispose of all or part of their investment in our common stock may not be able to do so effectively except by private direct negotiations with third parties, assuming that third parties are willing to purchase our common stock.
Alabama and Delaware law limit the ability of others to acquire the Bank, which may restrict your ability to fully realize the value of your common stock.
In many cases, stockholders receive a premium for their shares when one company purchases another. Alabama and Delaware law makes it difficult for anyone to purchase the Bank or us without approval of our board of directors. Thus, your ability to realize the potential benefits of any sale by us may be limited, even if such sale would represent a greater value for stockholders than our continued independent operation.
Our Certificate of Incorporation authorizes the issuance of preferred stock which could adversely affect holders of our common stock and discourage a takeover of us by a third party.
Our Certificate of Incorporation authorizes the board of directors to issue up to 1,000,000 shares of preferred stock without any further action on the part of our stockholders. In 2011, we issued 40,000 shares of Senior Non-cumulative Perpetual Preferred Stock with certain rights and preferences set forth in the Certificate of Designation for such preferred stock. Our board of directors also has the power, without stockholder approval, to set the terms of any series of preferred stock that may be issued, including voting rights, dividend rights, and preferences over our common stock with respect to dividends or in the event of a dissolution, liquidation or winding up and other terms. In the event that we issue preferred stock in the future that has preference over our common stock with respect to payment of dividends or upon our liquidation, dissolution or winding up, or if we issue preferred stock with voting rights that dilute the voting power of our common stock, the rights of the holders of our common stock or the market price of our common stock could be adversely affected. In addition, the ability of our board of directors to issue shares of preferred stock without any action on the part of the stockholders may impede a takeover of us and prevent a transaction favorable to our stockholders.
An investment in our common stock is not an insured deposit.
Our common stock is not a bank deposit and, therefore, is not insured against loss by the FDIC, any deposit insurance fund or by any other public or private entity. Investment in our common stock is inherently risky for the reasons described in this “Risk Factors” section and elsewhere in this Annual Report on Form 10-K (including the documents incorporated herein by reference) and is subject to the same market forces that affect the price of common stock in any company. As a result, an investor may lose some or all of such investor’s investment in our common stock.
ITEM 1B. UNRESOLVED STAFF COMMENTS.
None.
| 30 |
ITEM 2. PROPERTIES.
We operate through 11 banking offices. Our Shades Creek Parkway office also includes our corporate headquarters. We believe that our banking offices are in good condition, are suitable to our needs and, for the most part, are relatively new. The following table gives pertinent details about our banking offices.
| State | |||||||||
| MSA | |||||||||
| Office Address | City | Zip Code | Owned or Leased |
Date Opened | |||||
| Alabama: | |||||||||
| Birmingham-Hoover: | |||||||||
| 850 Shades Creek Parkway, Suite 200 (1) | Birmingham | 35209 | Leased | 3/2/2005 | |||||
| 324 Richard Arrington Jr. Boulevard North | Birmingham | 35203 | Leased | 12/19/2005 | |||||
| 5403 Highway 280, Suite 401 | Birmingham | 35242 | Leased | 8/15/2006 | |||||
| Total | 3 Offices | ||||||||
| Huntsville: | |||||||||
| 401 Meridian Street, Suite 100 | Huntsville | 35801 | Leased | 11/21/2006 | |||||
| 1267 Enterprise Way, Suite A (1) | Huntsville | 35806 | Leased | 8/21/2006 | |||||
| Total | 2 Offices | ||||||||
| Montgomery: | |||||||||
| 1 Commerce Street, Suite 200 | Montgomery | 36104 | Leased | 6/4/2007 | |||||
| 8117 Vaughn Road, Unit 20 | Montgomery | 36116 | Leased | 9/26/2007 | |||||
| Total | 2 Offices | ||||||||
| Dothan: | |||||||||
| 4801 West Main Street (1) | Dothan | 36305 | Leased | 10/17/2008 | |||||
| 1640 Ross Clark Circle | Dothan | 36301 | 2/1/2011 | ||||||
| Total | 2 Offices | ||||||||
| Mobile: | |||||||||
| 64 North Royal Street (2) | Mobile | 36602 | Leased | 7/9/2012 | |||||
| Total Offices in Alabama | 9 Offices | ||||||||
| Florida: | |||||||||
| Pensacola-Ferry Pass-Brent: | |||||||||
| 316 South Balen Street | Pensacola | 32502 | Leased | 4/1/2011 | |||||
| 4980 North 12th Avenue | Pensacola | 32504 | Owned | 8/27/2012 | |||||
| Total | 2 Offices |
(1) Offices relocated to this address. Original offices opened on date indicated.
(2) Office is a loan production office only.
ITEM 3. LEGAL PROCEEDINGS.
Neither we nor the Bank is currently subject to any material legal proceedings. In the ordinary course of business, the Bank is involved in routine litigation, such as claims to enforce liens, claims involving the making and servicing of real property loans, and other issues incident to the Bank’s business. Management does not believe that there are any threatened proceedings against us or the Bank which, if determined adversely, would have a material effect on our or the Bank’s business, financial position or results of operations.
ITEM 4. MINE SAFETY DISCLOSURE
Not applicable.
| 31 |
PART II
ITEM 5. MARKET FOR REGISTRANT’S COMMON EQUITY, RELATED STOCKHOLDER MATTERS AND ISSUER PURCHASES OF EQUITY SECURITIES.
There is no public market for our common stock, and we have no current plans to list our common stock on any public market. Consequently, we have infrequent secondary trades in our common stock. The most recent sale of our common stock was at $30.84 per share on February 7, 2013. As of December 31, 2012, we had approximately 1,258 stockholders of record holding 6,268,812 outstanding shares of our common stock. Also as of December 31, 2012, we had 778,500 shares of our common stock currently subject to outstanding options to purchase such shares under the 2005 Amended and Restated Stock Incentive Plan and the 2009 Stock Incentive Plan, 20,500 shares issued with restrictions under our 2009 Stock Incentive Plan, 50,000 shares of common stock subject to other outstanding options, 85,500 shares subject to warrants granted to investors in debt issued by us, and 600,000 shares of common stock reserved for issuance upon conversion of outstanding mandatory convertible trust preferred securities.
Dividends
We paid a cash dividend of $0.50 per common share on December 31, 2012. This was our first dividend, and we have no plans to pay additional dividends in the near future. We anticipate that our future earnings, if any, will be retained for purposes of enhancing our capital. Our payment of cash dividends to common stockholders is subject to the discretion of our Board of Directors and the Bank’s ability to pay dividends. The principal source of our cash flow, including cash flow to pay dividends, comes from dividends that the Bank pays to us as its sole shareholder. Statutory and regulatory limitations apply to the Bank’s payment of dividends to us, as well as our payment of dividends to our stockholders. For a more complete discussion on the restrictions on dividends, see “Supervision and Regulation - Payment of Dividends” in Item 1. We do pay quarterly dividends on our 40,000 shares of outstanding Non-cumulative Perpetual Preferred Stock pursuant to its Certificate of Designation.
Recent Sales of Unregistered Securities
We had no sales of unregistered securities in 2012 other than those previously reported in our reports filed with the Securities and Exchange Commission.
Purchases of Equity Securities by the Registrant and Affiliated Purchasers
We made no repurchases of our equity securities, and no “affiliated purchasers” (as defined in Rule 10b-18(a) (3) under the Securities Exchange Act of 1934) purchased any shares of our equity securities during the fourth quarter of the fiscal year ended December 31, 2012.
Equity Compensation Plan Information
The following table sets forth certain information as of December 31, 2012 relating to stock options granted under our 2005 Amended and Restated Stock Incentive Plan and our 2009 Stock Incentive Plan and other options or warrants issued outside of such plans.
| Plan Category | Number of Securities Issued/To Be Issued Upon Exercise of Outstanding Awards | Weighted-average Exercise Price of Outstanding Awards | Number of Securities Remaining Available For Future Issuance Under Equity Compensation Plans | |||||||||
| Equity Compensation Award-Plans Approved by Security Holders | 799,000 | $ | 21.26 | 257,000 | ||||||||
| Equity Compensation Awards-Plans Not Approved by Security Holders | 50,000 | 17.50 | - | |||||||||
| Total | 849,000 | $ | 21.04 | 257,000 | ||||||||
We grant stock options as incentive to employees, officers, directors and consultants to attract or retain these individuals, to maintain and enhance our long-term performance and profitability, and to allow these individuals to acquire an ownership interest in our Company. Our compensation committee administers this program, making all decisions regarding grants and amendments to these awards. An incentive stock option may not be exercised later than 90 days after an option holder terminates his or her employment with us unless such termination is a consequence of such option holder’s death or disability, in which case the option period may be extended for up to one year after termination of employment. All of our issued options will vest immediately upon a transaction in which we merge or consolidate with or into any other corporation (unless we are the surviving corporation), or sell or otherwise transfer our property, assets or business substantially in its entirety to a successor corporation. At that time, upon the exercise of an option, the option holder will receive the number of shares of stock or other securities or property, including cash, to which the holder of a like number of shares of common stock would have been entitled upon the merger, consolidation, sale or transfer if such option had been exercised in full immediately prior thereto. All of our issued options have a term of 10 years. This means the options must be exercised within 10 years from the date of the grant.
| 32 |
On September 2, 2008, we granted warrants to purchase up to 75,000 shares of our common stock with a price of $25.00 per share in connection with the issuance of our Subordinated Deferrable Interest Debentures.
On June 23, 2009, we granted warrants to purchase up to 15,000 shares of our common stock with an exercise price of $25.00 per share in connection with the issuance of our Subordinated Note due June 1, 2016.
On September 21, 2006, we granted non-plan stock options to persons representing certain key business relationships to purchase up to an aggregate of 30,000 shares of our common stock with an exercise price of $15.00 per share. On November 2, 2007, we granted non-plan stock options to persons representing certain key business relationships to purchase up to an aggregate of 25,000 shares of our common stock with an exercise price of $20.00 per share. These stock options are non-qualified and are not part of either of our stock incentive plans. They vest 100% in a lump sum five years after their date of grant and expire 10 years after their date of grant.
On October 26, 2009, we made a restricted stock award under the 2009 Stock Incentive Plan of 20,000 shares of common stock to Thomas A. Broughton III, President and Chief Executive Officer. These shares vest in five equal installments commencing on the first anniversary of the grant date, subject to earlier vesting in the event of a merger, consolidation, sale or transfer as described in the first paragraph under the table above.
We have granted restricted stock awards under the 2009 Stock Incentive Plan of 12,500 shares of common stock to six employees. These shares vest five years from the date of grant, subject to earlier vesting in the event of a merger, consolidation, sale or transfer as described in the first paragraph under the table above.
On November 28, 2011, we granted 10,000 non-qualified stock options to each Company director, or a total of 60,000 options, to purchase shares with an exercise price of $30.00 per share. The options vest 100% at the end of five years.
Performance Graph
The information included under the caption “Performance Graph” in this Item 5 of this Form 10-K is not deemed to be “soliciting material” or to be “filed” with the SEC or subject to Regulation 14A or 14C under the Securities Exchange Act of 1934 or the liabilities of Section 18 of the Securities Exchange Act of 1934, and will not be deemed to be incorporated by reference into any filings we make under the Securities Act of 1933 or the Securities Exchange Act of 1934, except to the extent we specifically incorporate it by reference into such a filing.
The following graph compares the change in cumulative total stockholder return on our common stock with the cumulative total return of the NASDAQ Banks Index and the S&P Stock Index from December 31, 2007 through December 31, 2012. This comparison assumes $100 invested on December 31, 2007 in (a) our common stock, (b) the NASDAQ Banks Index, and (c) the NASDAQ Composite Stock Index. Our common stock is not traded on any exchange or national market system, and prices for our stock are determined based on actual prices at which our stock has been sold in arm’s-length private placements completed prior to each point in time represented in the graph. Such prices are not necessarily indicative of the prices that would result from transactions conducted on an exchange.
| 33 |
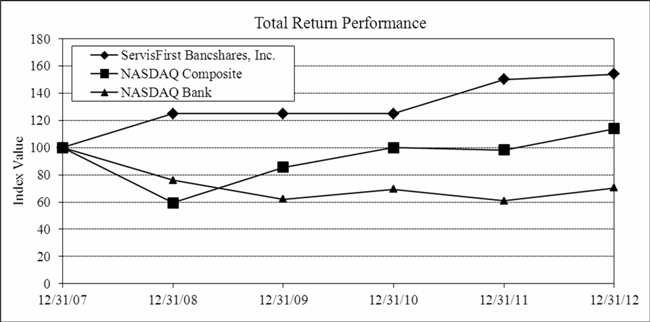
| Date | ||||||||||||||||||||||||
| Index: | 12/31/2007 | 12/31/2008 | 12/31/2009 | 12/31/2010 | 12/31/2011 | 12/31/2012 | ||||||||||||||||||
| ServisFirst Bancshares, Inc. | 100.00 | 125.00 | 125.00 | 125.00 | 150.00 | 154.00 | ||||||||||||||||||
| NASDAQ Composite | 100.00 | 59.46 | 85.55 | 100.02 | 98.22 | 113.85 | ||||||||||||||||||
| NASDAQ Bank | 100.00 | 76.08 | 62.00 | 69.37 | 60.75 | 70.34 | ||||||||||||||||||
ITEM 6. SELECTED FINANCIAL DATA.
The following table sets forth selected historical consolidated financial data from our consolidated financial statements and should be read in conjunction with our consolidated financial statements including the related notes and “Management’s Discussion and Analysis of Financial Condition and Results of Operations” which are included below. Except for the data under “Selected Performance Ratios”, “Asset Quality Ratios”, “Liquidity Ratios”, “Capital Adequacy Ratios” and “Growth Ratios”, the selected historical consolidated financial data as of December 31, 2012, 2011, 2010, 2009 and 2008 and for the years ended December 31, 2012, 2011, 2010, 2009 and 2008 are derived from our audited consolidated financial statements and related notes.
| 34 |
| As of and for the years ended December 31, | ||||||||||||||||||||
| 2012 | 2011 | 2010 | 2009 | 2008 | ||||||||||||||||
| (Dollars in thousands except for share and per share data) | ||||||||||||||||||||
| Selected Balance Sheet Data: | ||||||||||||||||||||
| Total Assets | $ | 2,906,314 | $ | 2,460,785 | $ | 1,935,166 | $ | 1,573,497 | $ | 1,162,272 | ||||||||||
| Total Loans | 2,363,182 | 1,830,742 | 1,394,818 | 1,207,084 | 968,233 | |||||||||||||||
| Loans, net | 2,336,924 | 1,808,712 | 1,376,741 | 1,192,173 | 957,631 | |||||||||||||||
| Securities available for sale | 233,877 | 293,809 | 276,959 | 255,453 | 102,339 | |||||||||||||||
| Securities held to maturity | 25,967 | 15,209 | 5,234 | 645 | - | |||||||||||||||
| Cash and due from banks | 58,031 | 43,018 | 27,454 | 26,982 | 22,844 | |||||||||||||||
| Interest-bearing balances with banks | 119,423 | 99,350 | 204,278 | 48,544 | 30,774 | |||||||||||||||
| Fed funds sold | 3,291 | 100,565 | 346 | 680 | 19,300 | |||||||||||||||
| Mortgage loans held for sale | 25,826 | 17,859 | 7,875 | 6,202 | 3,320 | |||||||||||||||
| Restricted equity securities | 3,941 | 3,501 | 3,510 | 3,241 | 2,659 | |||||||||||||||
| Premises and equipment, net | 8,847 | 4,591 | 4,450 | 5,088 | 3,884 | |||||||||||||||
| Deposits | 2,511,572 | 2,143,887 | 1,758,716 | 1,432,355 | 1,037,319 | |||||||||||||||
| Other borrowings | 136,982 | 84,219 | 24,937 | 24,922 | 20,000 | |||||||||||||||
| Subordinated debentures | 15,050 | 30,514 | 30,420 | 15,228 | 15,087 | |||||||||||||||
| Other liabilities | 9,453 | 5,873 | 3,993 | 3,370 | 3,082 | |||||||||||||||
| Stockholders Equity | 233,257 | 196,292 | 117,100 | 97,622 | 86,784 | |||||||||||||||
| Selected income Statement Data: | ||||||||||||||||||||
| Interest income | $ | 109,023 | $ | 91,411 | $ | 78,146 | $ | 62,197 | $ | 55,450 | ||||||||||
| Interest expense | 14,901 | 16,080 | 15,260 | 18,337 | 20,474 | |||||||||||||||
| Net interest income | 94,122 | 75,331 | 62,886 | 43,860 | 34,976 | |||||||||||||||
| Provision for loan losses | 9,100 | 8,972 | 10,350 | 10,685 | 6,274 | |||||||||||||||
| Net interest income after provision for loan losses | 85,022 | 66,359 | 52,536 | 33,175 | 28,702 | |||||||||||||||
| Noninterest income | 9,643 | 6,926 | 5,169 | 4,413 | 2,704 | |||||||||||||||
| Noninterest expense | 43,100 | 37,458 | 30,969 | 28,930 | 20,576 | |||||||||||||||
| Income before income taxes | 51,565 | 35,827 | 26,736 | 8,658 | 10,830 | |||||||||||||||
| Income taxes expenses | 17,120 | 12,389 | 9,358 | 2,780 | 3,825 | |||||||||||||||
| Net income | 34,445 | 23,438 | 17,378 | 5,878 | 7,005 | |||||||||||||||
| Per common Share Data: | ||||||||||||||||||||
| Net income, basic | $ | 5.68 | $ | 4.03 | $ | 3.15 | $ | 1.07 | $ | 1.37 | ||||||||||
| Net income, diluted | 4.99 | 3.53 | 2.84 | 1.02 | 1.31 | |||||||||||||||
| Book value | 30.84 | 26.35 | 21.19 | 17.71 | 16.15 | |||||||||||||||
| Weighted average shares outstanding: | ||||||||||||||||||||
| Basic | 5,996,437 | 5,759,524 | 5,519,151 | 5,485,972 | 5,114,194 | |||||||||||||||
| Diluted | 6,941,752 | 6,749,163 | 6,294,604 | 5,787,643 | 5,338,883 | |||||||||||||||
| Actual shares outstanding | 6,268,812 | 5,932,182 | 5,527,482 | 5,513,482 | 5,374,022 | |||||||||||||||
| Selected Performance Ratios: | ||||||||||||||||||||
| Return on average assets | 1.30 | % | 1.11 | % | 1.04 | % | 0.43 | % | 0.71 | % | ||||||||||
| Return on average stockholders' equity | 15.81 | % | 14.73 | % | 15.86 | % | 6.33 | % | 9.28 | % | ||||||||||
| Net interest margin (1) | 3.80 | % | 3.79 | % | 3.94 | % | 3.31 | % | 3.70 | % | ||||||||||
| Efficiency ratio (2) | 41.54 | % | 45.54 | % | 45.51 | % | 59.57 | % | 54.61 | % | ||||||||||
| Asset quality Ratios: | ||||||||||||||||||||
| Net charge-offs to average loans outstanding | 0.24 | % | 0.32 | % | 0.55 | % | 0.60 | % | 0.41 | % | ||||||||||
| Non-performing loans to totals loans | 0.44 | % | 0.75 | % | 1.03 | % | 1.01 | % | 1.02 | % | ||||||||||
| Non-performing assets to total assets | 0.69 | % | 1.06 | % | 1.10 | % | 1.57 | % | 1.74 | % | ||||||||||
| Allowance for loan losses to total gross loans | 1.11 | % | 1.20 | % | 1.30 | % | 1.24 | % | 1.09 | % | ||||||||||
| Allowance for loan losses to total non-performing loans | 253.50 | % | 159.96 | % | 126.00 | % | 122.34 | % | 108.17 | % | ||||||||||
| Liquidity Ratios: | ||||||||||||||||||||
| Net loans to total deposits | 93.05 | % | 84.37 | % | 78.28 | % | 83.23 | % | 92.32 | % | ||||||||||
| Net average loans to average earning assets | 79.82 | % | 76.71 | % | 78.04 | % | 80.06 | % | 85.84 | % | ||||||||||
| Noninterest-bearing deposits to total deposits | 21.71 | % | 16.96 | % | 14.24 | % | 14.75 | % | 11.71 | % | ||||||||||
| Capital Adequacy Ratios: | ||||||||||||||||||||
| Stockholders Equity to total assets | 8.03 | % | 7.97 | % | 6.05 | % | 6.20 | % | 7.47 | % | ||||||||||
| Total risked-based capital (3) | 11.78 | % | 12.79 | % | 11.82 | % | 10.48 | % | 11.25 | % | ||||||||||
| Tier 1 capital (4) | 9.89 | % | 11.39 | % | 10.22 | % | 8.89 | % | 10.18 | % | ||||||||||
| Leverage ratio (5) | 8.43 | % | 9.17 | % | 7.77 | % | 6.97 | % | 9.01 | % | ||||||||||
| Growth Ratios: | ||||||||||||||||||||
| Percentage change in net income | 46.96 | % | 34.87 | % | 195.64 | % | (16.10 | )% | 27.43 | % | ||||||||||
| Percentage change in diluted net income per share | 41.36 | % | 24.30 | % | 178.43 | % | (22.14 | )% | 12.93 | % | ||||||||||
| Percentage change in assets | 18.11 | % | 27.16 | % | 22.99 | % | 35.38 | % | 38.65 | % | ||||||||||
| Percentage change in net loans | 29.20 | % | 31.38 | % | 15.48 | % | 24.49 | % | 45.45 | % | ||||||||||
| Percentage change in deposits | 17.15 | % | 21.90 | % | 22.78 | % | 38.08 | % | 36.00 | % | ||||||||||
| Percentage change in equity | 18.83 | % | 67.63 | % | 19.95 | % | 12.49 | % | 20.12 | % | ||||||||||
| 35 |
(1) Net interest margin is the net yield on interest earning assets and is the difference between the interest yield earned on interest-earning assets and interest rate paid on interest-bearing liabilities, divided by average earning assets.
(2) Efficiency ratio is the result of noninterest expense divided by the sum of net interest income and noninterest income
(3) Total stockholders' equity excluding unrealized gains/(losses) on securities available for sale, net of taxes, and intangible assets plus allowance for loan losses (limited to 1.25% of risk-weighted assets) divided by total risk-weighted assets. The FDIC required minimum to be well capitalized is 10%.
(4)Total stockholders' equity excluding unrealized gains/(losses) on securities available for sale, net of taxes, and intangible assets divided by total risk-weighted assets. The FDIC required minimum to be well-capitalized is 6%.
(5) Total stockholders' equity excluding unrealized losses on securities available for sale, net of taxes, and intangible assets divided by average assets less intangible assets. The FDIC required minimum to be well-capitalized is 5%; however, the Alabama Banking Department has required that the Bank maintain a Tier 1 capital leverage ratio of 7%.
ITEM 7. MANAGEMENT’S DISCUSSION AND ANALYSIS OF FINANCIAL CONDITION AND RESULTS OF OPERATIONS
The following is a narrative discussion and analysis of significant changes in our results of operations and financial condition. The purpose of this discussion is to focus on information about our financial condition and results of operations that is not otherwise apparent from the audited financial statements. Analysis of the results presented should be made in the context of our relatively short history. This discussion should be read in conjunction with the financial statements and selected financial data included elsewhere in this document.
Overview
We are a bank holding company within the meaning of the Bank Holding Company Act of 1956 headquartered in Birmingham, Alabama. Through our wholly-owned subsidiary bank, we operate 11 full service banking offices located in Jefferson, Shelby, Madison, Montgomery and Houston Counties in Alabama, and in Escambia County in Florida. These offices operate in the Birmingham-Hoover, Huntsville, Montgomery and Dothan, Alabama MSAs, and in the Pensacola-Ferry Pass-Brent, Florida MSA. Additionally, we opened a loan production office in Mobile, Alabama in July 2012. Our principal business is to accept deposits from the public and to make loans and other investments. Our principal source of funds for loans and investments are demand, time, savings, and other deposits and the amortization and prepayment of loans and borrowings. Our principal sources of income are interest and fees collected on loans, interest and dividends collected on other investments and service charges. Our principal expenses are interest paid on savings and other deposits, interest paid on our other borrowings, employee compensation, office expenses and other overhead expenses.
Critical Accounting Policies
Our consolidated financial statements are prepared based on the application of certain accounting policies, the most significant of which are described in the Notes to the Consolidated Financial Statements. Certain of these policies require numerous estimates and strategic or economic assumptions that may prove inaccurate or subject to variation and may significantly affect our reported results and financial position for the current period or in future periods. The use of estimates, assumptions, and judgments are necessary when financial assets and liabilities are required to be recorded at, or adjusted to reflect, fair value. Assets carried at fair value inherently result in more financial statement volatility. Fair values and information used to record valuation adjustments for certain assets and liabilities are based on either quoted market prices or are provided by other independent third-party sources, when available. When such information is not available, management estimates valuation adjustments. Changes in underlying factors, assumptions or estimates in any of these areas could have a material impact on our future financial condition and results of operations.
Allowance for Loan Losses
The allowance for loan losses, sometimes referred to as the “ALLL”, is established through periodic charges to income. Loan losses are charged against the ALLL when management believes that the future collection of principal is unlikely. Subsequent recoveries, if any, are credited to the ALLL. If the ALLL is considered inadequate to absorb future loan losses on existing loans for any reason, including but not limited to, increases in the size of the loan portfolio, increases in charge-offs or changes in the risk characteristics of the loan portfolio, then the provision for loan losses is increased.
| 36 |
Loans are considered impaired when, based on current information and events, it is probable that the Bank will be unable to collect all amounts due according to the original terms of the loan agreement. The collection of all amounts due according to contractual terms means that both the contractual interest and principal payments of a loan will be collected as scheduled in the loan agreement. Impaired loans are measured based on the present value of expected future cash flows discounted at the loan’s effective interest rate, or, as a practical expedient, at the loan’s observable market price, or the fair value of the underlying collateral. The fair value of collateral, reduced by costs to sell on a discounted basis, is used if a loan is collateral-dependent.
Investment Securities Impairment
Periodically, we may need to assess whether there have been any events or economic circumstances to indicate that a security on which there is an unrealized loss is impaired on an other-than-temporary basis. In any such instance, we would consider many factors, including the severity and duration of the impairment, our intent and ability to hold the security for a period of time sufficient for a recovery in value, recent events specific to the issuer or industry, and for debt securities, external credit ratings and recent downgrades. Securities on which there is an unrealized loss that is deemed to be other-than-temporary are written down to fair value, with the write-down recorded as a realized loss in securities gains (losses).
Other Real Estate Owned
Other real estate owned (“OREO”), consisting of assets that have been acquired through foreclosure, is recorded at the lower of cost or estimated fair value less the estimated cost of disposition. Fair value is based on independent appraisals and other relevant factors. Other real estate owned is revalued on an annual basis or more often if market conditions necessitate. Valuation adjustments required at foreclosure are charged to the allowance for loan losses. Subsequent to foreclosure, losses on the periodic revaluation of the property are charged to net income as OREO expense. Significant judgments and complex estimates are required in estimating the fair value of other real estate, and the period of time within which such estimates can be considered current is significantly shortened during periods of market volatility, as experienced in recent years. As a result, the net proceeds realized from sales transactions could differ significantly from appraisals, comparable sales, and other estimates used to determine the fair value of other real estate.
Results of Operations
Net Income
Net income for the year ended December 31, 2012 was $34.4 million, compared to net income of $23.4 million for the year ended December 31, 2011. This increase in net income is primarily attributable to an increase in net interest income, which increased $18.8 million, or 24.9%, to $94.1 million in 2012 from $75.3 million in 2011. Noninterest income increased $2.7 million, or 39.1%, to $9.6 million in 2012 from $6.9 million in 2011. Noninterest expense increased by $5.6 million, or 14.9%, to $43.1 million in 2012 from $37.5 million in 2011. Basic and diluted net income per common share were $5.68 and $4.99, respectively, for the year ended December 31, 2012, compared to $4.03 and $3.53, respectively, for the year ended December 31, 2011. Return on average assets was 1.30% in 2012, compared to 1.11% in 2011, and return on average stockholders’ equity was 15.81% in 2012, compared to 14.73% in 2011.
Net income for the year ended December 31, 2011 was $23.4 million, compared to net income of $17.4 million for the year ended December 31, 2010. This increase in net income is primarily attributable to an increase in net interest income, which increased $12.4 million, or 19.8%, to $75.3 million in 2011 from $62.9 million in 2010. Noninterest income increased $1.7 million, or 32.7%, to $6.9 million in 2011 from $5.2 million in 2010. Noninterest expense increased by $6.5 million, or 21.0%, to $37.5 million in 2011 from $31.0 million in 2010. Basic and diluted net income per common share were $4.03 and $3.53, respectively, for the year ended December 31, 2011, compared to $3.15 and $2.84, respectively, for the year ended December 31, 2010. Return on average assets was 1.11% in 2011, compared to 1.04% in 2010, and return on average stockholders’ equity was 14.73% in 2011, compared to 15.86% in 2010.
| Year Ended December 31, | ||||||||||||
| 2012 | 2011 | Change from the Prior Year | ||||||||||
| (Dollars in Thousands) | ||||||||||||
| Interest income | $ | 109,023 | $ | 91,411 | 19.27 | % | ||||||
| Interest expense | 14,901 | 16,080 | -7.33 | % | ||||||||
| Net interest income | 94,122 | 75,331 | 24.94 | % | ||||||||
| Provision for loan losses | 9,100 | 8,972 | 1.43 | % | ||||||||
| Net interest income after provision for loan losses | 85,022 | 66,359 | 28.12 | % | ||||||||
| Noninterest income | 9,643 | 6,926 | 39.23 | % | ||||||||
| Noninterest expense | 43,100 | 37,458 | 15.06 | % | ||||||||
| Net income before taxes | 51,565 | 35,827 | 43.93 | % | ||||||||
| Taxes | 17,120 | 12,389 | 38.19 | % | ||||||||
| Net income | 34,445 | 23,438 | 46.96 | % | ||||||||
| Dividends on preferred stock | 400 | 200 | 100.00 | |||||||||
| Net income available to common stockholders | $ | 34,045 | $ | 23,238 | 46.51 | % | ||||||
| 37 |
| Year Ended December 31, | ||||||||||||
| 2011 | 2010 | Change from the Prior Year | ||||||||||
| (Dollars in Thousands) | ||||||||||||
| Interest income | $ | 91,411 | $ | 78,146 | 16.97 | % | ||||||
| Interest expense | 16,080 | 15,260 | 5.37 | % | ||||||||
| Net interest income | 75,331 | 62,886 | 19.79 | % | ||||||||
| Provision for loan losses | 8,972 | 10,350 | -13.31 | % | ||||||||
| Net interest income after provision for loan losses | 66,359 | 52,536 | 26.31 | % | ||||||||
| Noninterest income | 6,926 | 5,169 | 33.99 | % | ||||||||
| Noninterest expense | 37,458 | 30,969 | 20.95 | % | ||||||||
| Net income before taxes | 35,827 | 26,736 | 34.00 | % | ||||||||
| Taxes | 12,389 | 9,358 | 32.39 | % | ||||||||
| Net income | 23,438 | 17,378 | 34.87 | % | ||||||||
| Dividends on preferred stock | 200 | - | NM | |||||||||
| Net income available to common stockholders | $ | 23,238 | $ | 17,378 | 33.72 | % | ||||||
Net Interest Income
Net interest income is the difference between the income earned on interest-earning assets and interest paid on interest-bearing liabilities used to support such assets. The major factors which affect net interest income are changes in volumes, the yield on interest-earning assets and the cost of interest-bearing liabilities. Our management’s ability to respond to changes in interest rates by effective asset-liability management techniques is critical to maintaining the stability of the net interest margin and the momentum of our primary source of earnings.
Net interest income increased $18.8 million, or 24.9%, to $94.1 million for the year ended December 31, 2012 from $75.3 million for the year ended December 31, 2011. This was due to an increase in total interest income of $17.6 million, or 19.3%, and a decrease in total interest expense of $1.2 million, or a 7.3% reduction. The increase in total interest income was primarily attributable to a 29.30% increase in average loans outstanding from 2011 to 2012, which was the result of growth in all of our markets, including in Pensacola, Florida, and Mobile, Alabama, our newer markets entered during 2011 and 2012, respectively.
Net interest income increased $12.4 million, or 19.8%, to $75.3 million for the year ended December 31, 2011 from $62.9 million for the year ended December 31, 2010. This was due to an increase in total interest income of $13.3 million, or 17.0%, and an increase in total interest expense of $0.8, or 5.4%. The increase in total interest income was primarily attributable to a 22.62% increase in average loans outstanding from 2010 to 2011, which was the result of growth in all of our markets, including in Pensacola, Florida, our newest market entrance in 2011.
Investments
We view the investment portfolio as a source of income and liquidity. Our investment strategy is to accept a lower immediate yield in the investment portfolio by targeting shorter term investments. Our investment policy provides that no more than 40% of our total investment portfolio should be composed of municipal securities.
| 38 |
The investment portfolio at December 31, 2012 was $260 million, compared to $309 million at December 31, 2011. The interest earned on investments decreased from $8.7 million in 2011 to $8.1 million in 2012. The lower income was a result of lower yields on new securities purchased during 2012. The average taxable-equivalent yield on the investment portfolio decreased from 3.69% in 2011 to 3.33% in 2012, or 36 basis points.
The investment portfolio at December 31, 2011 was $309 million, compared to $ 282 million at December 31, 2010. The interest earned on investments decreased slightly, from $8.8 million in 2010 to $8.7 million in 2011. The lower income was the result of lower yields on new securities purchased during 2011. The average taxable-equivalent yield on the investment portfolio decreased from 4.08% in 2010 to 3.69% in 2011, or 39 basis points.
Net Interest Margin Analysis
The net interest margin is impacted by the average volumes of interest-sensitive assets and interest-sensitive liabilities and by the difference between the yield on interest-sensitive assets and the cost of interest-sensitive liabilities (spread). Loan fees collected at origination represent an additional adjustment to the yield on loans. Our spread can be affected by economic conditions, the competitive environment, loan demand, and deposit flows. The net yield on earning assets is an indicator of effectiveness of our ability to manage the net interest margin by managing the overall yield on assets and cost of funding those assets.
The following table shows, for the twelve months ended December 31, 2012, 2011 and 2010, the average balances of each principal category of our assets, liabilities and stockholders’ equity, and an analysis of net interest revenue, and the change in interest income and interest expense segregated into amounts attributable to changes in volume and changes in rates. This table is presented on a taxable equivalent basis, if applicable.
| 39 |
Average Balance Sheets and Net Interest Analysis
On a Fully Taxable-Equivalent Basis
For the Year Ended December 31,
(In thousands, except Average Yields and Rates)
| 2012 | 2011 | 2010 | ||||||||||||||||||||||||||||||||||
| Average
Balance | Interest
Earned / Paid | Average
Yield / Rate | Average
Balance | Interest
Earned / Paid | Average
Yield / Rate | Average
Balance | Interest
Earned / Paid | Average
Yield / Rate | ||||||||||||||||||||||||||||
| Assets: | ||||||||||||||||||||||||||||||||||||
| Interest-earning assets: | ||||||||||||||||||||||||||||||||||||
| Loans, net of unearned income | ||||||||||||||||||||||||||||||||||||
| Taxable (1) | $ | 2,034,478 | $ | 100,143 | 4.92 | % | $ | 1,573,500 | $ | 82,083 | 5.22 | % | $ | 1,283,204 | $ | 68,889 | 5.37 | % | ||||||||||||||||||
| Tax-exempt(2) | 1,631 | 95 | 5.82 | - | - | - | - | - | - | |||||||||||||||||||||||||||
| Mortgage loans held for sale | 17,905 | 349 | 1.95 | 7,556 | 211 | 2.79 | 6,275 | 226 | 3.60 | |||||||||||||||||||||||||||
| Securities: | ||||||||||||||||||||||||||||||||||||
| Taxable | 184,174 | 4,815 | 2.61 | 188,315 | 5,721 | 3.04 | 180,045 | 6,482 | 3.60 | |||||||||||||||||||||||||||
| Tax-exempt(2) | 100,926 | 4,683 | 4.64 | 82,239 | 4,275 | 5.20 | 59,812 | 3,314 | 5.72 | |||||||||||||||||||||||||||
| Total securities (3) | 285,100 | 9,498 | 3.33 | 270,554 | 9,996 | 3.69 | 239,857 | 9,796 | 4.08 | |||||||||||||||||||||||||||
| Federal funds sold | 94,425 | 196 | 0.21 | 85,825 | 176 | 0.21 | 47,581 | 104 | 0.22 | |||||||||||||||||||||||||||
| Restricted equity securities | 4,434 | 104 | 2.35 | 4,259 | 74 | 1.74 | 3,448 | 56 | 1.62 | |||||||||||||||||||||||||||
| Interest-bearing balances with banks | 80,170 | 200 | 0.25 | 83,152 | 203 | 0.24 | 42,675 | 115 | 0.27 | |||||||||||||||||||||||||||
| Total interest-earning assets | $ | 2,518,143 | $ | 110,585 | 4.39 | % | $ | 2,024,846 | $ | 92,743 | 4.58 | % | $ | 1,623,040 | $ | 79,186 | 4.88 | % | ||||||||||||||||||
| Non-interest-earning assets: | ||||||||||||||||||||||||||||||||||||
| Cash and due from banks | 38,467 | 28,304 | 24,837 | |||||||||||||||||||||||||||||||||
| Net premises and equipment | 6,074 | 4,813 | 4,914 | |||||||||||||||||||||||||||||||||
| Allowance for loan losses, accrued interest and other assets | 65,504 | 29,094 | 23,087 | |||||||||||||||||||||||||||||||||
| Total assets | $ | 2,628,188 | $ | 2,087,057 | $ | 1,675,878 | ||||||||||||||||||||||||||||||
| Interest-bearing liabilities: | ||||||||||||||||||||||||||||||||||||
| Interest-bearing deposits: | ||||||||||||||||||||||||||||||||||||
| Checking | $ | 351,975 | $ | 1,075 | 0.31 | % | $ | 303,165 | $ | 1,134 | 0.37 | % | $ | 264,591 | $ | 1,253 | 0.47 | % | ||||||||||||||||||
| Savings | 17,081 | 48 | 0.28 | 10,088 | 47 | 0.47 | 2,978 | 15 | 0.50 | |||||||||||||||||||||||||||
| Money market | 1,042,870 | 5,820 | 0.56 | 902,290 | 6,675 | 0.74 | 775,544 | 5,994 | 0.77 | |||||||||||||||||||||||||||
| Time deposits | 398,552 | 5,307 | 1.33 | 330,221 | 5,192 | 1.57 | 255,326 | 4,679 | 1.83 | |||||||||||||||||||||||||||
| Federal funds purchased | 88,732 | 222 | 0.25 | 19,335 | 49 | 0.25 | 4,901 | 31 | 0.63 | |||||||||||||||||||||||||||
| Other borrowings | 33,126 | 2,431 | 7.34 | 41,866 | 2,983 | 7.13 | 52,186 | 3,288 | 6.30 | |||||||||||||||||||||||||||
| Total interest-bearing liabilities | $ | 1,932,336 | $ | 14,903 | 0.77 | % | $ | 1,606,965 | $ | 16,080 | 1.00 | % | $ | 1,355,526 | $ | 15,260 | 1.13 | % | ||||||||||||||||||
| Non-interest-bearing liabilities: | ||||||||||||||||||||||||||||||||||||
| Non-interest-bearing checking | 474,284 | 315,781 | 207,399 | |||||||||||||||||||||||||||||||||
| Other liabilities | 6,201 | 6,580 | 3,412 | |||||||||||||||||||||||||||||||||
| Stockholders' equity | 207,656 | 145,050 | 105,156 | |||||||||||||||||||||||||||||||||
| Unrealized gains on securities and derivatives | 7,712 | 12,681 | 4,385 | |||||||||||||||||||||||||||||||||
| Total liabilities and stockholders' equity | $ | 2,628,188 | $ | 2,087,057 | $ | 1,675,878 | ||||||||||||||||||||||||||||||
| Net interest spread | 3.62 | % | 3.58 | % | 3.75 | % | ||||||||||||||||||||||||||||||
| Net interest margin | 3.80 | % | 3.79 | % | 3.94 | % | ||||||||||||||||||||||||||||||
| (1) | Non-accrual loans are included in average loan balances in all periods. Loan fees of $372,000, $538,000 and $750,000 are included in interest income in 2012, 2011 and 2010, respectively. |
| (2) | Interest income and yields are presented on a fully taxable equivalent basis using a tax rate of 35%. |
| (3) | Unrealized gains of $11,998,000, $7,624,000 and $6,717,000 are excluded from the yield calculation in 2012, 2011 and 2010, respectively. |
| 40 |
The following table reflects changes in our net interest margin as a result of changes in the volume and rate of our interest-bearing assets and liabilities.
| For the Year Ended December 31, | ||||||||||||||||||||||||
| 2012 Compared to 2011 Increase (Decrease)
in Interest Income and Expense Due to Changes in: | 2011 Compared to 2010 Increase (Decrease)
in Interest Income and Expense Due to Changes in: | |||||||||||||||||||||||
| Volume | Rate | Total | Volume | Rate | Total | |||||||||||||||||||
| Interest-earning assets: | ||||||||||||||||||||||||
| Loans, net of unearned income | ||||||||||||||||||||||||
| Taxable | $ | 22,910 | $ | (4,850 | ) | $ | 18,060 | $ | 15,193 | $ | (1,999 | ) | $ | 13,194 | ||||||||||
| Tax-exempt | 95 | - | 95 | - | - | - | ||||||||||||||||||
| Mortgages held for sale | 218 | (80 | ) | 138 | 41 | (56 | ) | (15 | ) | |||||||||||||||
| Taxable | (124 | ) | (782 | ) | (906 | ) | 287 | (1,048 | ) | (761 | ) | |||||||||||||
| Tax-exempt | 900 | (492 | ) | 408 | 1,177 | (216 | ) | 961 | ||||||||||||||||
| Federal funds sold | 18 | 2 | 20 | 78 | (6 | ) | 72 | |||||||||||||||||
| Restricted equity securities | 3 | 27 | 30 | 14 | 4 | 18 | ||||||||||||||||||
| with banks | (7 | ) | 4 | (3 | ) | 100 | (12 | ) | 88 | |||||||||||||||
| Total interest-earning assets | 24,013 | (6,171 | ) | 17,842 | 16,890 | (3,333 | ) | 13,557 | ||||||||||||||||
| Interest-bearing liabilities: | ||||||||||||||||||||||||
| Interest-bearing demand deposits | 167 | (226 | ) | (59 | ) | 166 | (285 | ) | (119 | ) | ||||||||||||||
| Savings | 25 | (24 | ) | 1 | 33 | (1 | ) | 32 | ||||||||||||||||
| Money market | 941 | (1,796 | ) | (855 | ) | 947 | (266 | ) | 681 | |||||||||||||||
| Time deposits | 980 | (865 | ) | 115 | 1,242 | (729 | ) | 513 | ||||||||||||||||
| Federal funds purchased | 174 | (1 | ) | 173 | 47 | (29 | ) | 18 | ||||||||||||||||
| Other borrowed funds | (639 | ) | 87 | (552 | ) | (701 | ) | 396 | (305 | ) | ||||||||||||||
| liabilities | 1,648 | (2,825 | ) | (1,177 | ) | 1,734 | (914 | ) | 820 | |||||||||||||||
| Increase in net interest income | $ | 22,365 | $ | (3,346 | ) | $ | 19,019 | $ | 15,156 | $ | (2,419 | ) | $ | 12,737 | ||||||||||
In the table above, changes in net interest income are attributable to (a) changes in average balances (volume variance), (b) changes in rates (rate variance), or (c) changes in rate and average balances (rate/volume variance). The volume variance is calculated as the change in average balances times the old rate. The rate variance is calculated as the change in rates times the old average balance. The rate/volume variance is calculated as the change in rates times the change in average balances. The rate/volume variance is allocated on a pro rata basis between the volume variance and the rate variance in the table above.
The two primary factors that make up the spread are the interest rates received on loans and the interest rates paid on deposits. We have been disciplined in raising interest rates on deposits only as the market demanded and thereby managing our cost of funds. Also, we have not competed for new loans on interest rate alone, but rather we have relied significantly on effective marketing to business customers.
Our net interest spread and net interest margin were 3.62% and 3.80%, respectively, for the year ended December 31, 2012, compared to 3.58% and 3.79%, respectively, for the year ended December 31, 2011. Our average interest-earning assets for the year ended December 31, 2012 increased $493.3 million, or 24.4%, to $2.5 billion from $2.0 billion for the year ended December 31, 2011. This increase in our average interest-earning assets was due to continued core growth in all of our markets, increased loan production and increases in investment securities, federal funds sold and interest-bearing balances with other banks. Our average interest-bearing liabilities increased $325.4 million, or 20.2%, to $1.9 billion for the year ended December 31, 2012 from $1.6 billion for the year ended December 31, 2011. This increase in our average interest-bearing liabilities was primarily due to an increase in interest-bearing deposits in all our markets. We prepaid our $5 million 8.25% subordinated note on June 2, 2012 and our $15 million 8.5% subordinated debenture on November 8, 2012. We issued $20 million in 5.5% subordinated notes due in November 9, 2022 in a private placement with accredited investors. The ratio of our average interest-earning assets to average interest-bearing liabilities was 130.3% and 126.0% for the years ended December 31, 2012 and 2011, respectively.
| 41 |
Our average interest-earning assets produced a taxable equivalent yield of 4.39% for the year ended December 31, 2012, compared to 4.58% for the year ended December 31, 2011. The average rate paid on interest-bearing liabilities was 0.77% for the year ended December 31, 2012, compared to 1.00% for the year ended December 31, 2011.
Our net interest spread and net interest margin were 3.58% and 3.79%, respectively, for the year ended December 31, 2011, compared to 3.75% and 3.94%, respectively, for the year ended December 31, 2010. Our average interest-earning assets for the year ended December 31, 2011 increased $401.8 million, or 24.8%, to $2.0 billion from $1.6 billion for the year ended December 31, 2010. This increase in our average interest-earning assets was due to continued core growth in all of our markets, increased loan production and increases in investment securities, federal funds sold and interest-bearing balances with other banks. Our average interest-bearing liabilities increased $251.4 million, or 18.5%, to $1.6 billion for the year ended December 31, 2011 from $1.4 billion for the year ended December 31, 2010. This increase in our average interest-bearing liabilities was primarily due to an increase in interest-bearing deposits in all our markets. We paid off two advances from the Federal Home Loan Bank totaling $20 million during the first half of 2011. The average rate paid on these advances was 3.13%. The ratio of our average interest-earning assets to average interest-bearing liabilities was 130.3% and 126.0% for the years ended December 31, 2012 and 2011, respectively.
Our average interest-earning assets produced a taxable equivalent yield of 4.58% for the year ended December 31, 2011, compared to 4.88% for the year ended December 31, 2010. The average rate paid on interest-bearing liabilities was 1.00% for the year ended December 31, 2011, compared to 1.13% for the year ended December 31, 2010.
Provision for Loan Losses
The provision for loan losses represents the amount determined by management to be necessary to maintain the allowance for loan losses at a level capable of absorbing inherent losses in the loan portfolio. Our management reviews the adequacy of the allowance for loan losses on a quarterly basis. The allowance for loan losses calculation is segregated into various segments that include classified loans, loans with specific allocations and pass rated loans. A pass rated loan is generally characterized by a very low to average risk of default and in which management perceives there is a minimal risk of loss. Loans are rated using a nine-point risk grade scale with loan officers having the primary responsibility for assigning risk grades and for the timely reporting of changes in the risk grades. Based on these processes, and the assigned risk grades, the criticized and classified loans in the portfolio are segregated into the following regulatory classifications: Special Mention, Substandard, Doubtful or Loss, with some general allocation of reserve based on these grades. At December 31, 2012, total loans rated Special Mention, Substandard, and Doubtful were $100.7 million, or 4.3% of total loans, compared to $88.9 million, or 5.2% of total loans, at December 31, 2011. Impaired loans are reviewed specifically and separately under FASB ASC 310-30-35, Subsequent Measurement of Impaired Loans, to determine the appropriate reserve allocation. Our management compares the investment in an impaired loan with the present value of expected future cash flow discounted at the loan’s effective interest rate, the loan’s observable market price or the fair value of the collateral, if the loan is collateral-dependent, to determine the specific reserve allowance. Reserve percentages assigned to non-impaired loans are based on historical charge-off experience adjusted for other risk factors. To evaluate the overall adequacy of the allowance to absorb losses inherent in our loan portfolio, our management considers historical loss experience based on volume and types of loans, trends in classifications, volume and trends in delinquencies and nonaccruals, economic conditions and other pertinent information. Based on future evaluations, additional provisions for loan losses may be necessary to maintain the allowance for loan losses at an appropriate level.
The provision expense for loan losses was $9.1 million for the year ended December 31, 2012, an increase of $0.1 million from $9.0 million in 2011. Also, nonperforming loans decreased to $10.4 million, or 0.44%, of total loans at December 31, 2012 from $13.8 million, or 0.75%, of total loans at December 31, 2011. During 2012, we had net charged-off loans totaling $4.9 million, compared to net charged-off loans of $5.0 million for 2011. The ratio of net charged-off loans to average loans was 0.24% for 2012 compared to 0.32% for 2011. The allowance for loan losses totaled $26.3 million, or 1.11% of loans, net of unearned income, at December 31, 2012, compared to $22.0 million, or 1.20% of loans, net of unearned income, at December 31, 2011.
The provision expense for loan losses was $9.0 million for the year ended December 31, 2011, a decrease of $1.4 million from $10.4 million in 2010. Also, nonperforming loans decreased to $13.8 million, or 0.75% of total loans, at December 31, 2011, from $14.3 million, or 1.03% of total loans, at December 31, 2010. During 2011, we had net charged-off loans totaling $5.0 million, compared to net charged-off loans of $7.0 million for 2010. The ratio of net charged-off loans to average loans was 0.32% for 2011 compared to 0.55% for 2010. The allowance for loan losses totaled $22.0 million, or 1.20% of loans, net of unearned income, at December 31, 2011, compared to $18.1 million, or 1.30% of loans, net of unearned income, at December 31, 2010.
| 42 |
Noninterest Income
Noninterest income increased $2.7 million, or 39.2%, to $9.6 million in 2012 from $6.9 million in 2011. Noninterest income increased $1.7 million, or 34.0%, to $6.9 million in 2011 from $5.2 million in 2010. Increases in the cash surrender value of bank-owned life insurance contracts of $1.6 million in 2012, compared to $0.4 million in 2011, was a major component of the increase in noninterest income from 2011 to 2012. Interchange income from credit card activity increased from $0.5 million in 2011 to $1.0 million in 2012, resulting from increases in the number of cards sold, and from increased spending on existing cards. There were no gains on the sale of available-for-sale securities during 2012, compared to $0.7 million during 2011, and $108,000 during 2010.
Income from mortgage banking operations continued to be bolstered by refinancing activity in 2012 as the result of low interest rates. For the year ended December 31, 2012, mortgage banking income increased $1.2 million, or 50.0%, to $3.6 million from $2.4 million for the year ended December 31, 2011. Income from mortgage banking operations for the year ended December 31, 2011 increased $0.2 million from the year ended December 31, 2010. Income from service charges on deposit accounts for the year ended December 31, 2012 increased $0.5 million, or 21.7%, from $2.3 million in 2011 to $2.8 million in 2012, and was flat at $2.3 million when comparing 2011 to 2010. The average balances on transaction deposit accounts, from which service fees are derived, were up $354.9 million, or 23.2%, from 2011 to 2012. We also dropped our earnings credit rate paid on deposits in April 2012 from 0.50% to 0.35%, which contributed to somewhat higher service fee income. Despite the fact that average balances in transaction accounts increased by approximately $280.8 million, or 22.5%, there was minimal growth in the balances in accounts that are tied to analysis fees. We also had a flat earnings credit rate of 0.50% during all of 2010 and 2011. Our management is currently pursuing new accounts and customers through direct marketing and other promotional efforts to increase this source of revenue.
Noninterest Expense
Noninterest expense increased $5.6 million, or 15.1%, to $43.1 million for the year ended December 31, 2012 from $37.5 million for the year ended December 31, 2011. This increase is largely attributable to increased salary and employee benefits expense, which is a result of staff additions related to our expansion. We had 234 full-time equivalent employees at December 31, 2012 compared to 210 at December 31, 2011. Equipment and occupancy expense increased $0.3 million, or 8.1% as a result of the opening of a new office in our Pensacola, Florida market. This office is housed in an owned facility. FDIC assessments expensed during 2012 were down $0.2 million, or 11.1%, from $1.8 million in 2011 to $1.6 million in 2012. This was the result of changes by the FDIC, under the Dodd-Frank Act, in how the assessment base is determined, and at what rates assessments are charged. These changes took effect during the second quarter of 2011. OREO expense increased $1.9 million, or 237.5%, from $0.8 million in 2011 to $2.7 million in 2012. This increase was the result of increased write-downs in the value of residential development properties in various stages of completion. Other noninterest expenses increased $0.3 million, or 2.9%, to $10.7 million for the year ended December 31, 2012 from $10.4 million for the year ended December 31, 2011. Other expenses in 2011 included $738,000 in prepayment penalties incurred as a result of our prepayment of FHLB debt. Offsetting this during 2012 were increases in credit card processing expenses and other loan expenses.
Noninterest expense increased $6.5 million, or 21.0%, to $37.5 million for the year ended December 31, 2011 from $31.0 million for the year ended December 31, 2010. This increase is largely attributable to increased salary and employee benefits expense, which is a result of staff additions related to our expansion. We had 210 full-time equivalent employees at December 31, 2011 compared to 170 at December 31, 2010. Equipment and occupancy expense also increased, from $3.2 million in 2010 to $3.7 in 2011, as a result of our expansion into Pensacola, Florida and the expansion of existing offices to accommodate new staff. FDIC insurance assessments decreased from $2.9 million in 2010 to $1.8 million in 2011 due to the changes in the assessment base and rates under the Dodd-Frank Act, as discussed above. OREO expenses decreased from $2.0 million in 2010 to $0.8 million in 2011 due to the completion of construction projects in 2010, and the sale of several pieces of OREO during 2010 and 2011. Other noninterest expenses increased $3.1 million, or 43.0%, to $10.4 million for the year ended December 31, 2011 from $7.3 million during the year ended December 31, 2010. A large part of this increase was the $738,000 in prepayment penalties incurred when we paid off our advances to the FHLB in 2011. Recording fees and bank-paid loan expenses increased during 2011 as a result of loan growth and a greater proportion of loans for which the Bank agreed to pay various expenses related to closing. More details of changes in other noninterest expenses can be seen in Note 16 to the Consolidated Financial Statements.
| 43 |
Income Tax Expense
Income tax expense was $17.1 million for the year ended December 31, 2012 compared to $12.4 million in 2011 and $9.4 million in 2010. Our effective tax rates for 2012, 2011 and 2010 were 33.20%, 34.58% and 35.00%, respectively. Our primary permanent differences are related to incentive stock option expenses and tax-free income.
We invested in bank-owned life insurance for certain named officers of the Bank in September 2011, and again in October 2012. The periodic increases in cash surrender value of those policies are tax exempt and therefore contribute to a larger permanent difference between book income and taxable income.
We created a real estate investment trust in the first quarter of 2012 for the purposes of isolating certain real estate loans for tracking purposes. The trust is a wholly-owned subsidiary of a trust holding company, which in turn is a wholly-owned subsidiary of the Bank. The trust dividends its net earnings, primarily interest income derived from the loans it holds, to the Bank, which receives a deduction for Alabama income tax.
Financial Condition
Assets
Total assets at December 31, 2012, were $2.9 billion, an increase of $0.4 billion, or 16.0% over total assets of $2.5 billion at December 31, 2011. Average assets for the year ended December 31, 2012 were $2.6 billion, an increase of $0.5 billion, or 29.4%, over average assets of $2.1 billion for the year ended December 31, 2011. Loan growth was the primary reason for the increase. Year-end 2012 loans were $2.4 billion, up $0.5 billion, or 27.8%, over year-end 2011 total loans of $1.8 billion.
Total assets at December 31, 2011, were $2.5 billion, an increase of $0.5 billion, or 26.3% over total assets of $1.9 billion at December 31, 2010. Average assets for the year ended December 31, 2011 were $2.1 billion, an increase of $0.4 billion, or 23.5%, over average assets of $1.7 billion for the year ended December 31, 2010. Loan growth was the primary reason for the increase. Year-end 2011 loans were $1.8 billion, up $0.4 billion, or 28.6%, over year-end 2010 total loans of $1.4 billion.
Earning assets include loans, securities, short-term investments and bank-owned life insurance contracts. We maintain a higher level of earning assets in our business model than do our peers because we allocate fewer of our resources to facilities, ATMs, cash and due-from-bank accounts used for transaction processing. Earning assets at December 31, 2012 were $2.8 billion, or 97.5% of total assets of $2.9 billion. Earning assets at December 31, 2011 were $2.4 billion, or 97.6% of total assets of $2.5 billion. We believe this ratio is expected to generally continue at these levels, although it may be affected by economic factors beyond our control.
Investment Portfolio
We view the investment portfolio as a source of income and liquidity. Our investment strategy is to accept a lower immediate yield in the investment portfolio by targeting shorter-term investments. Our investment policy provides that no more than 50% of our total investment portfolio should be composed of municipal securities. At December 31, 2012, mortgage-backed securities represented 36% of the investment portfolio, state and municipal securities represented 48% of the investment portfolio, U.S. Treasury and government agencies represented 11% of the investment portfolio, and corporate debt represented 5% of the investment portfolio.
All of our investments in mortgage-backed securities are pass-through mortgage-backed securities. We do not currently, and did not have at December 31, 2012, any structured investment vehicles or any private-label mortgage-backed securities. The amortized cost of securities in our portfolio totaled $248.6 million at December 31, 2012, compared to $297.9 million at December 31, 2011. The following table provides the amortized cost of our securities as of December 31, 2012 by their stated maturities (this maturity schedule excludes security prepayment and call features), as well as the taxable equivalent yields for each maturity range. All such securities held are traded in liquid markets.
| 44 |
Maturity of Investment Securities - Amortized Cost
| Less Than One Year | One Year throught Five Years | Six Years through Ten Years | More Than Ten Years | Total | ||||||||||||||||
| (In Thousands) | ||||||||||||||||||||
| At December 31, 2012: | ||||||||||||||||||||
| Securities Available for Sale: | ||||||||||||||||||||
| U.S. Treasury and government agencies | $ | 10,003 | $ | 15,304 | $ | 2,053 | $ | - | $ | 27,360 | ||||||||||
| Mortgage-backed securities | - | 69,298 | - | - | 69,298 | |||||||||||||||
| State and municipal securities | 1,968 | 51,250 | 56,733 | 2,368 | 112,319 | |||||||||||||||
| Corporate debt | - | 12,638 | 1,039 | - | 13,677 | |||||||||||||||
| Total | $ | 11,971 | $ | 148,490 | $ | 59,825 | $ | 2,368 | $ | 222,654 | ||||||||||
| Tax-equivalent Yield | ||||||||||||||||||||
| U.S. Treasury and government agencies | 1.90 | % | 2.37 | % | 4.88 | % | - | % | 2.39 | % | ||||||||||
| Mortgage-backed securities | - | 3.63 | - | - | 3.63 | |||||||||||||||
| State and municipal securities | 3.90 | 3.70 | 4.80 | 6.04 | 4.31 | |||||||||||||||
| Corporate debt | - | 1.29 | 7.07 | - | 1.73 | |||||||||||||||
| Weighted average yield | 2.23 | % | 3.33 | % | 4.84 | % | 6.04 | % | 3.70 | % | ||||||||||
| Securities Held to Maturity: | ||||||||||||||||||||
| Mortgage-backed securities | $ | - | $ | 14,735 | $ | 4,479 | $ | 1,215 | $ | 20,429 | ||||||||||
| State and municipal securities | - | - | - | 5,538 | 5,538 | |||||||||||||||
| Total | $ | - | $ | 14,735 | $ | 4,479 | $ | 6,753 | $ | 25,967 | ||||||||||
| Tax-equivalent Yield | ||||||||||||||||||||
| Mortgage-backed securities | - | % | 2.90 | % | 1.69 | % | 3.00 | % | 2.64 | % | ||||||||||
| State and municipal securities | - | - | - | 6.08 | 6.08 | |||||||||||||||
| Weighted average yield | - | % | 2.90 | % | 1.69 | % | 5.53 | % | 3.37 | % | ||||||||||
At December 31, 2012, we had $3.3 million in federal funds sold, compared with $100.6 million at December 31, 2011. We shifted balances held at correspondent banks to our reserve account at the Federal Reserve Bank of Atlanta to gain favorable capital treatment at December 31, 2012.
The objective of our investment policy is to invest funds not otherwise needed to meet our loan demand to earn the maximum return, yet still maintain sufficient liquidity to meet fluctuations in our loan demand and deposit structure. In doing so, we balance the market and credit risks against the potential investment return, make investments compatible with the pledge requirements of any deposits of public funds, maintain compliance with regulatory investment requirements, and assist certain public entities with their financial needs. The investment committee has full authority over the investment portfolio and makes decisions on purchases and sales of securities. The entire portfolio, along with all investment transactions occurring since the previous board of directors meeting, is reviewed by the board at each monthly meeting. The investment policy allows portfolio holdings to include short-term securities purchased to provide us with needed liquidity and longer term securities purchased to generate level income for us over periods of interest rate fluctuations.
Loan Portfolio
We had total loans of approximately $2.363 billion at December 31, 2012. The following table shows the percentage of our total loan portfolio by MSA. With our loan portfolio concentrated in a limited number of markets, there is a risk that our borrowers’ ability to repay their loans from us could be affected by changes in local and regional economic conditions.
| Percentage of Total Loans in MSA | ||||
| Birmingham-Hoover, AL MSA | 53 | % | ||
| Huntsville, AL MSA | 17 | % | ||
| Montgomery, AL MSA | 11 | % | ||
| Dothan, AL MSA | 13 | % | ||
| Total Alabama MSAs | 93 | % | ||
| Pensacola, FL MSA | 7 | % | ||
| 45 |
The following table details our loans at December 31, 2012, 2011, 2010, 2009 and 2008:
| 2012 | 2011 | 2010 | 2009 | 2008 | ||||||||||||||||
| (Dollars in Thousands) | ||||||||||||||||||||
| Commercial, financial and agricultural | $ | 1,030,990 | $ | 799,464 | $ | 536,620 | $ | 461,088 | $ | 325,968 | ||||||||||
| Real estate - construction | 158,361 | 151,218 | 172,055 | 224,178 | 235,162 | |||||||||||||||
| Real estate - mortgage: | ||||||||||||||||||||
| Owner-occupied commercial | 568,041 | 398,601 | 270,767 | 203,983 | 147,197 | |||||||||||||||
| 1-4 family mortgage | 235,909 | 205,182 | 199,236 | 165,512 | 137,019 | |||||||||||||||
| Other mortgage | 323,599 | 235,251 | 178,793 | 119,749 | 93,412 | |||||||||||||||
| Total real estate - mortgage | 1,127,549 | 839,034 | 648,796 | 489,244 | 377,628 | |||||||||||||||
| Consumer | 46,282 | 41,026 | 37,347 | 32,574 | 29,475 | |||||||||||||||
| Total Loans | 2,363,182 | 1,830,742 | 1,394,818 | 1,207,084 | 968,233 | |||||||||||||||
| Less: Allowance for loan losses | (26,258 | ) | (22,030 | ) | (18,077 | ) | (14,737 | ) | (10,602 | ) | ||||||||||
| Net Loans | $ | 2,336,924 | $ | 1,808,712 | $ | 1,376,741 | $ | 1,192,347 | $ | 957,631 | ||||||||||
The following table details the percentage composition of our loan portfolio by type at December 31, 2012, 2011, 2010, 2009 and 2008:
| 2012 | 2011 | 2010 | 2009 | 2008 | ||||||||||||||||
| Commercial, financial and agricultural | 43.63 | % | 43.67 | % | 38.47 | % | 38.20 | % | 33.67 | % | ||||||||||
| Real estate - construction | 6.70 | 8.26 | 12.34 | 18.57 | 24.29 | |||||||||||||||
| Real estate - mortgage: | ||||||||||||||||||||
| Owner-occupied commercial | 24.04 | 21.77 | 19.41 | 16.90 | 15.20 | |||||||||||||||
| 1-4 family mortgage | 9.98 | 11.21 | 14.28 | 13.71 | 14.15 | |||||||||||||||
| Other mortgage | 13.69 | 12.85 | 12.82 | 9.92 | 9.65 | |||||||||||||||
| Total real estate - mortgage | 47.71 | 45.83 | 46.51 | 40.53 | 39.00 | |||||||||||||||
| Consumer | 1.96 | 2.24 | 2.68 | 2.70 | 3.04 | |||||||||||||||
| Total Loans | 100.00 | % | 100.00 | % | 100.00 | % | 100.00 | % | 100.00 | % | ||||||||||
The following table details maturities and sensitivity to interest rate changes for our loan portfolio at December 31, 2012:
| Due in 1 | Due in 1 to 5 | Due after 5 | ||||||||||||||
| year or less | years | years | Total | |||||||||||||
| (in Thousands) | ||||||||||||||||
| Commercial, financial and agricultural | $ | 602,364 | $ | 360,172 | $ | 68,454 | $ | 1,030,990 | ||||||||
| Real estate - construction | 98,472 | 57,257 | 2,632 | 158,361 | ||||||||||||
| Real estate - mortgage: | ||||||||||||||||
| Owner-occupied commercial | 76,396 | 342,170 | 149,475 | 568,041 | ||||||||||||
| 1-4 family mortgage | 39,038 | 149,004 | 47,867 | 235,909 | ||||||||||||
| Other mortgage | 80,292 | 203,032 | 40,275 | 323,599 | ||||||||||||
| Total Real estate - mortgage | 195,726 | 694,206 | 237,617 | 1,127,549 | ||||||||||||
| Consumer | 32,108 | 13,794 | 380 | 46,282 | ||||||||||||
| Total Loans | $ | 928,670 | $ | 1,125,429 | $ | 309,083 | $ | 2,363,182 | ||||||||
| Less: Allowance for loan losses | (26,258 | ) | ||||||||||||||
| Net Loans | $ | 2,336,924 | ||||||||||||||
| Interest rate sensitivity: | ||||||||||||||||
| Fixed interest rates | $ | 213,714 | $ | 656,735 | $ | 175,608 | $ | 1,046,057 | ||||||||
| Floating or adjustable rates | 714,956 | 468,694 | 133,475 | 1,317,125 | ||||||||||||
| Total | $ | 928,670 | $ | 1,125,429 | $ | 309,083 | $ | 2,363,182 | ||||||||
(1) includes nonaccrual loans
| 46 |
Asset Quality
The following table presents a summary of changes in the allowance for loan losses over the past five fiscal years. Our net charge-offs as a percentage of average loans for 2012 was 0.24%, compared to 0.32% for 2011. The largest balance of our charge-offs is on real estate construction loans. Real estate construction loans represent 6.70% of our loan portfolio.
| 2012 | 2011 | 2010 | 2009 | 2008 | ||||||||||||||||
| (Dollars in Thousands) | ||||||||||||||||||||
| Allowance for loan losses: | ||||||||||||||||||||
| Beginning of year | $ | 22,030 | $ | 18,077 | $ | 14,737 | $ | 10,602 | $ | 7,732 | ||||||||||
| Charge-offs: | ||||||||||||||||||||
| Commercial, financial and agricultural | (1,106 | ) | (1,096 | ) | (1,667 | ) | (2,616 | ) | (545 | ) | ||||||||||
| Real estate - construction | (3,088 | ) | (2,594 | ) | (3,488 | ) | (3,322 | ) | (2,264 | ) | ||||||||||
| Real estate - mortgage: | ||||||||||||||||||||
| Owner occupied commercial | (250 | ) | - | (548 | ) | - | - | |||||||||||||
| 1-4 family mortgage | (311 | ) | (1,096 | ) | (1,227 | ) | (522 | ) | (480 | ) | ||||||||||
| Other mortgage | (99 | ) | - | - | (9 | ) | (459 | ) | ||||||||||||
| Total real estate mortgage | (660 | ) | (1,096 | ) | (1,775 | ) | (531 | ) | (939 | ) | ||||||||||
| Consumer | (901 | ) | (867 | ) | (278 | ) | (207 | ) | (118 | ) | ||||||||||
| Total charge-offs | (5,755 | ) | (5,653 | ) | (7,208 | ) | (6,676 | ) | (3,866 | ) | ||||||||||
| Recoveries: | ||||||||||||||||||||
| Commercial, financial and agricultural | 125 | 361 | 97 | - | 264 | |||||||||||||||
| Real estate - construction | 58 | 180 | 53 | 108 | - | |||||||||||||||
| Real estate - mortgage: | ||||||||||||||||||||
| Owner occupied commercial | - | 12 | 12 | - | - | |||||||||||||||
| 1-4 family mortgage | 692 | - | 20 | 3 | - | |||||||||||||||
| Other mortgage | - | - | - | - | - | |||||||||||||||
| Total real estate mortgage | 692 | 12 | 32 | 3 | - | |||||||||||||||
| Consumer | 8 | 81 | 16 | 15 | 198 | |||||||||||||||
| Total recoveries | 883 | 634 | 198 | 126 | 462 | |||||||||||||||
| Net charge-offs | (4,872 | ) | (5,019 | ) | (7,010 | ) | (6,550 | ) | (3,404 | ) | ||||||||||
| Provision for loan losses charged to expense | 9,100 | 8,972 | 10,350 | 10,685 | 6,274 | |||||||||||||||
| Allowance for loan losses at end of period | $ | 26,258 | $ | 22,030 | $ | 18,077 | $ | 14,737 | $ | 10,602 | ||||||||||
| As a percent of year to date average loans: | ||||||||||||||||||||
| Net charge-offs | 0.24 | % | 0.32 | % | 0.55 | % | 0.60 | % | 0.41 | % | ||||||||||
| Provision for loan losses | 0.45 | % | 0.57 | % | 0.81 | % | 1.00 | % | 0.76 | % | ||||||||||
| Allowance for loan losses as a percentage of: | ||||||||||||||||||||
| Year-end loans | 1.11 | % | 1.20 | % | 1.30 | % | 1.24 | % | 1.09 | % | ||||||||||
| Nonperforming assets | 130.77 | % | 84.48 | % | 84.82 | % | 60.34 | % | 52.68 | % | ||||||||||
The allowance for loan losses is established and maintained at levels needed to absorb anticipated credit losses from identified and otherwise inherent risks in the loan portfolio as of the balance sheet date. In assessing the adequacy of the allowance for loan losses, management considers its evaluation of the loan portfolio, past due loan experience, collateral values, current economic conditions and other factors considered necessary to maintain the allowance at an adequate level. Our management feels that the allowance was adequate at December 31, 2012.
| 47 |
The following table presents the allocation of the allowance for loan losses for each respective loan category with the corresponding percent of loans in each category to total loans.
| For the Years Ended December 31, | ||||||||||||||||||||||||||||||||||||||||
| 2012 | 2011 | 2010 | 2009 | 2008 | ||||||||||||||||||||||||||||||||||||
| Percentage | Percentage | Percentage | Percentage | Percentage | ||||||||||||||||||||||||||||||||||||
| of loans in | of loans in | of loans in | of loans in | of loans in | ||||||||||||||||||||||||||||||||||||
| each | each | each | each | each | ||||||||||||||||||||||||||||||||||||
| category to | category to | category to | category to | category to | ||||||||||||||||||||||||||||||||||||
| Amount | total loans | Amount | total loans | Amount | total loans | Amount | total loans | Amount | total loans | |||||||||||||||||||||||||||||||
| (Dollars in Thousands) | ||||||||||||||||||||||||||||||||||||||||
| Commercial, financial and agricultural | $ | 8,233 | 43.63 | % | $ | 6,627 | 43.67 | % | $ | 5,348 | 38.47 | % | $ | 3,135 | 38.20 | % | $ | 1,489 | 33.67 | % | ||||||||||||||||||||
| Real estate - construction | 6,511 | 6.70 | 6,542 | 8.26 | 6,373 | 12.34 | 6,295 | 18.57 | 5,473 | 24.29 | ||||||||||||||||||||||||||||||
| Real estate - mortgage | 4,912 | 47.71 | 3,295 | 45.83 | 2,443 | 46.51 | 2,102 | 40.53 | 40 | 39.00 | ||||||||||||||||||||||||||||||
| Consumer | 199 | 1.96 | 531 | 2.24 | 749 | 2.68 | 115 | 2.70 | 5 | 3.04 | ||||||||||||||||||||||||||||||
| Qualitative factors | 6,403 | - | 5,035 | - | 3,164 | - | 3,090 | - | 3,595 | - | ||||||||||||||||||||||||||||||
| Total | $ | 26,258 | 100.00 | % | $ | 22,030 | 100.00 | % | $ | 18,077 | 100.00 | % | $ | 14,737 | 100.00 | % | $ | 10,602 | 100.00 | % | ||||||||||||||||||||
We target small and medium-sized businesses as loan customers. Because of their size, these borrowers may be less able to withstand competitive or economic pressures than larger borrowers in periods of economic weakness. If loan losses occur at a level where the loan loss reserve is not sufficient to cover actual loan losses, our earnings will decrease. We use an independent consulting firm to review our loans annually for quality in addition to the reviews that may be conducted by bank regulatory agencies as part of their usual examination process.
As of December 31, 2012, we had impaired loans of $37.4 million inclusive of nonaccrual loans, an increase of $0.1 million from $37.3 million as of December 31, 2011. We allocated $3.5 million of our allowance for loan losses at December 31, 2012 to these impaired loans. We had previous write-downs against impaired loans of $2.6 million at December 31, 2012, compared to $1.2 million at December 31, 2011. The average balance for 2012 of loans impaired as of December 31, 2012 was $37.9 million. Interest income foregone on these impaired loans was $850,000 for the year ended December 31, 2012, and we recognized $1.3 million of interest income on these impaired loans for the year ended December 31, 2012. A loan is considered impaired, based on current information and events, if it is probable that we will be unable to collect the scheduled payments of principal or interest when due according to the contractual terms of the original loan agreement. Impairment does not always indicate credit loss, but provides an indication of collateral exposure based on prevailing market conditions and third-party valuations. Impaired loans are measured by either the present value of expected future cash flows discounted at the loan’s effective interest rate, the loan’s obtainable market price, or the fair value of the collateral if the loan is collateral-dependent. The amount of any initial impairment and subsequent changes in impairment are included in the allowance for loan losses. Interest on accruing impaired loans is recognized as long as such loans do not meet the criteria for nonaccrual status. Our credit administration group performs verification and testing to ensure appropriate identification of impaired loans and that proper reserves are allocated to these loans.
Of the $37.4 million of impaired loans reported as of December 31, 2012, $14.4 million were real estate construction loans, $6.2 million were residential real estate loans, $3.9 million were commercial and industrial loans, $8.3 million were commercial real estate loans and $4.5 million were other mortgage loans. Of the $14.4 million of impaired real estate construction loans, $6.9 million (a total of 17 loans with seven builders) were residential construction loans, and $4.1 million consisted of various residential lot loans to three builders.
The Bank has procedures and processes in place intended to ensure that losses do not exceed the potential amounts documented in the Bank’s impairment analyses and reduce potential losses in the remaining performing loans within our real estate construction portfolio. These include the following:
| · | We closely monitor the past due and overdraft reports on a weekly basis to identify deterioration as early as possible and the placement of identified loans on the watch list. |
| · | We perform extensive monthly credit review for all watch list/classified loans, including formulation of aggressive workout or action plans. When a workout is not achievable, we move to collection/foreclosure proceedings to obtain control of the underlying collateral as rapidly as possible to minimize the deterioration of collateral and/or the loss of its value. |
| 48 |
| · | We require updated financial information, global inventory aging and interest carry analysis for existing builders to help identify potential future loan payment problems. |
| · | We generally limit loans for new construction to established builders and developers that have an established record of turning their inventories, and we restrict our funding of undeveloped lots and land. |
Nonperforming Assets
The table below summarizes our nonperforming assets at December 31, 2012, 2011, 2010, 2009 and 2008:
| 2012 | 2011 | 2010 | 2009 | 2008 | ||||||||||||||||||||||||||||||||||||
| Number | Number | Number | Number | Number | ||||||||||||||||||||||||||||||||||||
| Balance | of Loans | Balance | of Loans | Balance | of Loans | Balance | of Loans | Balance | of Loans | |||||||||||||||||||||||||||||||
| (Dollars in Thousands) | ||||||||||||||||||||||||||||||||||||||||
| Nonaccrual loans: | ||||||||||||||||||||||||||||||||||||||||
| Commercial, financial and agricultural | $ | 276 | 2 | $ | 1,179 | 7 | $ | 2,164 | 8 | $ | 2,032 | 2 | $ | - | - | |||||||||||||||||||||||||
| Real estate - construction | 6,460 | 19 | 10,063 | 21 | 10,722 | 24 | 8,100 | 13 | 5,035 | 22 | ||||||||||||||||||||||||||||||
| Real estate - mortgage: | ||||||||||||||||||||||||||||||||||||||||
| Owner-occupied commercial | 2,786 | 3 | 792 | 2 | 635 | 1 | 909 | 2 | 237 | 2 | ||||||||||||||||||||||||||||||
| 1-4 family mortgage | 453 | 2 | 670 | 4 | 202 | 1 | 265 | 2 | 558 | 1 | ||||||||||||||||||||||||||||||
| Other mortgage | 240 | 1 | 693 | 1 | - | - | 615 | 1 | 1,883 | 1 | ||||||||||||||||||||||||||||||
| Total real estate - mortgage | 3,479 | 6 | 2,155 | 7 | 837 | 2 | 1,789 | 5 | 2,678 | 4 | ||||||||||||||||||||||||||||||
| Consumer | 135 | 2 | 375 | 1 | 624 | 1 | - | - | - | - | ||||||||||||||||||||||||||||||
| Total nonaccrual loans | $ | 10,350 | 29 | $ | 13,772 | 36 | $ | 14,347 | 35 | $ | 11,921 | 20 | $ | 7,713 | 26 | |||||||||||||||||||||||||
| 90+ days past due and accruing: | ||||||||||||||||||||||||||||||||||||||||
| Commercial, financial and agricultural | $ | - | - | $ | - | - | $ | - | - | $ | 14 | 1 | $ | 1,939 | 1 | |||||||||||||||||||||||||
| Real estate - construction | - | - | - | - | - | - | - | - | - | - | ||||||||||||||||||||||||||||||
| Real estate - mortgage: | ||||||||||||||||||||||||||||||||||||||||
| Owner-occupied commercial | - | - | - | - | - | - | - | - | - | - | ||||||||||||||||||||||||||||||
| 1-4 family mortgage | - | - | - | - | - | - | 253 | 1 | - | - | ||||||||||||||||||||||||||||||
| Other mortgage | - | - | - | - | - | - | - | - | - | - | ||||||||||||||||||||||||||||||
| Total real estate mortgage | - | - | - | - | - | - | 253 | 1 | - | - | ||||||||||||||||||||||||||||||
| Consumer | 8 | 4 | - | - | - | - | - | - | - | - | ||||||||||||||||||||||||||||||
| Total 90+ days past due and accruing | $ | 8 | 4 | $ | - | - | $ | - | - | $ | 267 | 2 | $ | 1,939 | 1 | |||||||||||||||||||||||||
| Total nonperforming loans | $ | 10,358 | 33 | $ | 13,772 | 36 | $ | 14,347 | 35 | $ | 12,188 | 22 | $ | 9,652 | 27 | |||||||||||||||||||||||||
| Plus: Other real estate owned and repossessions | 9,721 | 38 | 12,305 | 39 | 6,966 | 39 | 12,525 | 51 | 10,473 | 25 | ||||||||||||||||||||||||||||||
| Total nonperforming assets | $ | 20,079 | 71 | $ | 26,077 | 75 | $ | 21,313 | 74 | $ | 24,713 | 73 | $ | 20,125 | 52 | |||||||||||||||||||||||||
| Restructured accruing loans: | ||||||||||||||||||||||||||||||||||||||||
| Commercial, financial and agricultural | $ | 1,168 | 2 | $ | 1,369 | 2 | $ | 2,398 | 9 | $ | - | - | $ | - | - | |||||||||||||||||||||||||
| Real estate - construction | 3,213 | 15 | - | - | - | - | - | - | - | - | ||||||||||||||||||||||||||||||
| Real estate - mortgage: | ||||||||||||||||||||||||||||||||||||||||
| Owner-occupied commercial | 3,121 | 3 | 2,785 | 3 | - | - | 845 | 1 | - | - | ||||||||||||||||||||||||||||||
| 1-4 family mortgage | 1,709 | 5 | - | - | - | - | - | - | - | - | ||||||||||||||||||||||||||||||
| Other mortgage | 302 | 1 | 331 | 1 | - | - | - | - | - | - | ||||||||||||||||||||||||||||||
| Total real estate -mortgage | 5,132 | 9 | 3,116 | 4 | - | - | 845 | 1 | - | - | ||||||||||||||||||||||||||||||
| Consumer | - | - | - | - | - | - | - | - | - | - | ||||||||||||||||||||||||||||||
| Total restructured accruing loans | $ | 9,513 | 26 | $ | 4,485 | 6 | $ | 2,398 | 9 | $ | 845 | 1 | $ | - | - | |||||||||||||||||||||||||
| Total nonperforming assets and restructured accruing loans | $ | 29,592 | 97 | $ | 30,562 | 81 | $ | 23,711 | 83 | $ | 25,558 | 74 | $ | 20,125 | 52 | |||||||||||||||||||||||||
| Gross interest income foregone on nonaccrual loans througout year | $ | 850 | $ | 1,371 | $ | 510 | $ | 647 | $ | 735 | ||||||||||||||||||||||||||||||
| Interest income recognized on nonaccrual loans througout year | $ | 155 | $ | 263 | $ | 418 | $ | 310 | $ | 287 | ||||||||||||||||||||||||||||||
| Ratios: | ||||||||||||||||||||||||||||||||||||||||
| Nonperforming loans to total loans | 0.44 | % | 0.75 | % | 1.03 | % | 1.01 | % | 1.02 | % | ||||||||||||||||||||||||||||||
| Nonperforming assets to total loans plus other real estate owned | 0.85 | % | 1.41 | % | 1.52 | % | 2.02 | % | 2.07 | % | ||||||||||||||||||||||||||||||
| Nonperforming loans plus restructured accruing loans to total loans plus other real estate owned and repossessions | 0.84 | % | 0.99 | % | 1.19 | % | 1.06 | % | 1.00 | % | ||||||||||||||||||||||||||||||
| 49 |
The balance of nonperforming assets can fluctuate due to changes in economic conditions. We have established a policy to discontinue accruing interest on a loan (i.e., place the loan on nonaccrual status) after it has become 90 days delinquent as to payment of principal or interest, unless the loan is considered to be well-collateralized and is actively in the process of collection. In addition, a loan will be placed on nonaccrual status before it becomes 90 days delinquent unless management believes that the collection of interest is expected. Interest previously accrued but uncollected on such loans is reversed and charged against current income when the receivable is determined to be uncollectible. Interest income on nonaccrual loans is recognized only as received. If we believe that a loan will not be collected in full, we will increase the allowance for loan losses to reflect management’s estimate of any potential exposure or loss. Generally, payments received on nonaccrual loans are applied directly to principal.
Deposits
We rely on increasing our deposit base to fund loan and other asset growth. Each of our markets is highly competitive. We compete for local deposits by offering attractive products with premium rates. We expect to have a higher average cost of funds for local deposits than competitor banks due to our lack of an extensive branch network. Our management’s strategy is to offset the higher cost of funding with a lower level of operating expense and firm pricing discipline for loan products. We have promoted electronic banking services by providing them without charge and by offering in-bank customer training. The following table presents the average balance and average rate paid on each of the following deposit categories at the Bank level for years ended 2012, 2011 and 2010:
| 50 |
| Average Deposits | ||||||||||||||||||||||||
| Average for Years Ended December 31, | ||||||||||||||||||||||||
| 2012 | 2011 | 2010 | ||||||||||||||||||||||
| Average Balance | Average Rate Paid | Average Balance | Average Rate Paid | Average Balance | Average Rate Paid | |||||||||||||||||||
| Types of Deposits: | (Dollars in Thousands) | |||||||||||||||||||||||
| Non-interest-bearing demand deposits | $ | 474,284 | - | % | $ | 315,781 | - | % | $ | 207,399 | - | % | ||||||||||||
| Interest-bearing demand deposits | 351,975 | 0.31 | % | 303,165 | 0.37 | % | 264,591 | 0.47 | % | |||||||||||||||
| Money market accounts | 1,042,870 | 0.56 | % | 902,290 | 0.74 | % | 775,544 | 0.77 | % | |||||||||||||||
| Savings accounts | 17,081 | 0.28 | % | 10,088 | 0.47 | % | 2,978 | 0.50 | % | |||||||||||||||
| Time deposits | 69,906 | 1.24 | % | 65,484 | 1.44 | % | 47,026 | 1.76 | % | |||||||||||||||
| Time deposits, $100,000 and over | 328,646 | 1.35 | % | 264,737 | 1.60 | % | 208,300 | 1.85 | % | |||||||||||||||
| Total deposits | $ | 2,284,762 | $ | 1,861,545 | $ | 1,505,838 | ||||||||||||||||||
| At December 31, 2012 | $100,000 or more | Less than $100,000 | Total | |||||||||
| Maturity | (In Thousands) | |||||||||||
| Three months or less | $ | 81,299 | $ | 20,910 | $ | 102,209 | ||||||
| Over three through six months | 33,712 | 9,351 | 43,063 | |||||||||
| Over six months through one year | 89,215 | 17,236 | 106,451 | |||||||||
| Over one year | 122,275 | 21,682 | 143,957 | |||||||||
| Total | $ | 326,501 | $ | 69,179 | $ | 395,680 | ||||||
Total average deposits for the year ended December 31, 2012 were $2.3 billion, an increase of $0.4 billion, or 21.1%, over total average deposits of $1.9 billion for the year ended December 31, 2011. Average noninterest-bearing deposits increased by $0.2 billion, or 66.7%, from $0.3 billion for the year ended December 31, 2011 to $0.5 billion for the year ended December 31, 2012.
Total average deposits for the year ended December 31, 2011 were $1.9 billion, an increase of $0.4 billion, or 26.7%, over total average deposits of $1.5 billion for the year ended December 31, 2010. Average noninterest-bearing deposits increased by $0.1 billion, or 50.0%, from $0.2 billion for the year ended December 31, 2010 to $0.3 billion for the year ended December 31, 2011.
We have never had brokered deposits.
Borrowed Funds
We had available approximately $130 million in unused federal funds lines of credit with regional banks as of December 31, 2012, compared to $140 million as of December 31, 2011. These lines are subject to certain restrictions and collateral requirements.
Stockholders’ Equity
Stockholders’ equity increased $37.0 million during 2012, to $233.3 million at December 31, 2012 from $196.3 million at December 31, 2011. The increase in stockholders’ equity resulted primarily from net income of $34.0 million during the year ended December 31, 2012 and contributed capital from the exercise of stock options during 2012.
We issued to each of our directors upon the formation of the Bank in May 2005 warrants to purchase up to 10,000 shares of our common stock, or 60,000 in the aggregate, for a purchase price of $10.00 per share, expiring in ten years. These warrants became fully vested in May 2008.
We issued warrants to purchase 75,000 shares of our common stock with an exercise price of $25.00 per share in the third quarter of 2008. These warrants were issued in connection with our 8.5% trust preferred securities, which were redeemed on November 8, 2012.
We issued warrants to purchase 15,000 shares of our common stock with an exercise price of $25.00 per share in the second quarter of 2009. These warrants were issued in connection with the sale of a $5,000,000 subordinated note of the Bank, which was paid off on June 1, 2012.
| 51 |
On September 21, 2006, we granted non-plan stock options to persons representing certain key business relationships to purchase up to an aggregate of 30,000 shares of our common stock with an exercise price of $15.00 per share. On November 2, 2007, we granted non-plan stock options to persons representing certain key business relationships to purchase up to an aggregate of 25,000 shares of our common stock with an exercise price of $20.00 per share. These stock options are non-qualified and are not part of either of our stock incentive plans. They are fully vested and expire 10 years after their date of grant.
On December 20, 2007, we granted 10,000 stock options to purchase shares of our common stock to each of our directors, or 60,000 in the aggregate, with an exercise price of $20.00 per share, expiring in ten years. These are non-qualified stock options that become fully vested on December 19, 2012.
We have granted 32,500 shares of restricted stock under the 2009 Stock Incentive Plan. These share generally vest five years from the date of grant, subject to earlier vesting in the event of a merger, consolidation, sale or transfer of the Company or substantially all of its assets and business.
On November 28, 2011, we granted 10,000 non-qualified stock options to each Company director, or a total of 60,000 options, to purchase shares with an exercise price of $30.00 per share. The options vest 100% at the end of five years.
Off-Balance Sheet Arrangements
In the normal course of business, we are a party to financial credit arrangements with off-balance sheet risk to meet the financing needs of our customers. These financial credit arrangements include commitments to extend credit beyond current fundings, credit card arrangements, standby letters of credit and financial guarantees. Those credit arrangements involve, to varying degrees, elements of credit risk in excess of the amount recognized in the balance sheet. The contract or notional amounts of those instruments reflect the extent of involvement we have in those particular financial credit arrangements. All such credit arrangements bear interest at variable rates and we have no such credit arrangements which bear interest at fixed rates.
Our exposure to credit loss in the event of non-performance by the other party to the financial instrument for commitments to extend credit, credit card arrangements and standby letters of credit is represented by the contractual or notional amount of those instruments. We use the same credit policies in making commitments and conditional obligations as we do for on-balance sheet instruments.
The following table sets forth our credit arrangements and financial instruments whose contract amounts represent credit risk as of December 31, 2012, 2011 and 2010:
| 2012 | 2011 | 2010 | ||||||||||
| (In Thousands) | ||||||||||||
| Commitments to extend credit | $ | 860,421 | $ | 697,939 | $ | 538,719 | ||||||
| Credit card arrangements | 25,699 | 19,686 | 17,601 | |||||||||
| Standby letters of credit and financial guarantees | 36,374 | 42,937 | 47,103 | |||||||||
| Total | $ | 922,494 | $ | 760,562 | $ | 603,423 | ||||||
Commitments to extend credit beyond current fundings are agreements to lend to a customer as long as there is no violation of any condition established in the contract. Such commitments generally have fixed expiration dates or other termination clauses and may require payment of a fee. Since many of the commitments are expected to expire without being drawn upon, the total commitment amounts do not necessarily represent future cash requirements. We evaluate each customer’s creditworthiness on a case-by-case basis. The amount of collateral obtained if deemed necessary by us upon extension of credit is based on our management’s credit evaluation. Collateral held varies but may include accounts receivable, inventory, property, plant and equipment, and income-producing commercial properties.
Standby letters of credit are conditional commitments issued by us to guarantee the performance of a customer to a third party. Those guarantees are primarily issued to support public and private borrowing arrangements, including commercial paper, bond financing, and similar transactions. All letters of credit are due within one year or less of the original commitment date. The credit risk involved in issuing letters of credit is essentially the same as that involved in extending loan facilities to customers.
| 52 |
Derivatives
During 2008, the Bank entered into interest rate swaps (“swaps”) to facilitate customer transactions and meet their financing needs. Upon entering into these swaps, the Bank entered into offsetting positions with a regional correspondent bank in order to minimize the risk to the Bank. As of December 31, 2012 and 2011, the Bank was party to two swaps with notional amounts totaling approximately $11.1 million with customers, and two swaps with notional amounts totaling approximately $11.1 million with a regional correspondent bank. These swaps qualify as derivatives, but are not designated as hedging instruments.
The Bank has entered into agreements with secondary market investors to deliver loans on a “best efforts delivery” basis. When a rate is committed to a borrower, it is based on the best price that day and locked with our investor for our customer for a 30-day period. In the event the loan is not delivered to the investor, the Bank has no risk or exposure with the investor. The interest rate lock commitments related to loans that are originated for later sale are classified as derivatives. The fair values of our agreements with investors and rate lock commitments to customers as of December 31, 2012 and 2011 were not material.
Asset and Liability Management
The matching of assets and liabilities may be analyzed by examining the extent to which such assets and liabilities are “interest rate sensitive” and by monitoring an institution’s interest rate sensitivity “gap.” An asset or liability is said to be interest rate sensitive within a specific time period if it will mature or reprice within that time period. The interest rate sensitivity gap is defined as the difference between the dollar amount of rate-sensitive assets repricing during a period and the volume of rate-sensitive liabilities repricing during the same period. A gap is considered positive when the amount of interest rate-sensitive assets exceeds the amount of interest rate-sensitive liabilities. A gap is considered negative when the amount of interest rate-sensitive liabilities exceeds the amount of interest rate-sensitive assets. During a period of rising interest rates, a negative gap would tend to adversely affect net interest income while a positive gap would tend to result in an increase in net interest income. During a period of falling interest rates, a negative gap would tend to result in an increase in net interest income while a positive gap would tend to adversely affect net interest income.
Our asset liability and investment committee is charged with monitoring our liquidity and funds position. The committee regularly reviews the rate sensitivity position on a three-month, six-month and one-year time horizon; loans-to-deposits ratios; and average maturities for certain categories of liabilities. The asset liability committee uses a computer model to analyze the maturities of rate-sensitive assets and liabilities. The model measures the “gap” which is defined as the difference between the dollar amount of rate-sensitive assets repricing during a period and the volume of rate-sensitive liabilities repricing during the same period. Gap is also expressed as the ratio of rate-sensitive assets divided by rate-sensitive liabilities. If the ratio is greater than “one,” then the dollar value of assets exceeds the dollar value of liabilities and the balance sheet is “asset sensitive.” Conversely, if the value of liabilities exceeds the dollar value of assets, then the ratio is less than one and the balance sheet is “liability sensitive.” Our internal policy requires our management to maintain the gap such that net interest margins will not change more than 10% if interest rates change by 100 basis points or more than 15% if interest rates change by 200 basis points. As of December 31, 2012, our gap was within such ranges. See “—Quantitative and Qualitative Analysis of Market Risk” below in Item 7A for additional information.
Liquidity and Capital Adequacy
Liquidity
Liquidity is defined as our ability to generate sufficient cash to fund current loan demand, deposit withdrawals, or other cash demands and disbursement needs, and otherwise to operate on an ongoing basis.
Liquidity is managed at two levels. The first is the liquidity of the Company. The second is the liquidity of the Bank. The management of liquidity at both levels is critical, because the Company and the Bank have different funding needs and sources, and each are subject to regulatory guidelines and requirements. We are subject to general FDIC guidelines which require a minimum level of liquidity. Management believes our liquidity ratios meet or exceed these guidelines. Our management is not currently aware of any trends or demands that are reasonably likely to result in liquidity increasing or decreasing in any material manner.
| 53 |
The retention of existing deposits and attraction of new deposit sources through new and existing customers is critical to our liquidity position. In the event of compression in liquidity due to a run-off in deposits, we have a liquidity policy and procedure that provides for certain actions under varying liquidity conditions. These actions include borrowing from existing correspondent banks, selling or participating loans and the curtailment of loan commitments and funding. At December 31, 2012, our liquid assets, represented by cash and due from banks, federal funds sold and available-for-sale securities, totaled $414.6 million. Additionally, at such date we had available to us approximately $130.0 million in unused federal funds lines of credit with regional banks, subject to certain restrictions and collateral requirements, to meet short term funding needs. We believe these sources of funding are adequate to meet immediate anticipated funding needs, but we will need additional capital to maintain our current growth. Our management meets on a weekly basis to review sources and uses of funding to determine the appropriate strategy to ensure an appropriate level of liquidity, and we have increased our focus on the generation of core deposit funding to supplement our liquidity position. At the current time, our long-term liquidity needs primarily relate to funds required to support loan originations and commitments and deposit withdrawals.
To help finance our continued growth and planned expansion activities, we completed a private placement of stock pursuant to subscription agreements effective December 31, 2008 and issued and sold 139,460 shares of our common stock for $25.00 per share in January 2009 for an aggregate purchase price of $3.5 million. In addition, on March 15, 2010, we completed a private placement of $15.0 million in 6.0% Mandatory Convertible Trust Preferred Securities which convert into shares of our common stock on March 15, 2013. In June 2011, we completed a private placement of 340,000 shares of our common stock at an offering price of $30 per share. Also in 2011, we completed a private placement of 40,000 shares of our Non-cumulative Perpetual Senior Preferred Stock for an aggregate purchase price of $40.0 million. Also, on November 9, 2012, we completed the private placement of $20.0 million in 5.50% Subordinated Notes due November 9, 2022. The proceeds from these notes were used to pay off our 8.50% subordinated debentures. Our regular sources of funding are from the growth of our deposit base, repayment of principal and interest on loans, the sale of loans and the renewal of time deposits.
The following table reflects the contractual maturities of our term liabilities as of December 31, 2012. The amounts shown do not reflect any early withdrawal or prepayment assumptions.
| Payments due by Period | ||||||||||||||||||||
| Over 1 - 3 | Over 3 - 5 | |||||||||||||||||||
| Total | 1 year or less | years | years | Over 5 years | ||||||||||||||||
| (In Thousands) | ||||||||||||||||||||
| Contractual Obligations (1) | ||||||||||||||||||||
| Deposits without a stated maturity | $ | 2,115,892 | $ | - | $ | - | $ | - | $ | - | ||||||||||
| Certificates of deposit (2) | 395,680 | 247,482 | 108,600 | 39,598 | - | |||||||||||||||
| Federal funds purchased | 117,065 | 117,065 | - | - | - | |||||||||||||||
| Other borrowings | 20,000 | - | - | - | 20,000 | |||||||||||||||
| Subordinated debentures | 15,000 | 15,000 | - | - | - | |||||||||||||||
| Operating lease commitments | 13,606 | 1,972 | 3,919 | 3,660 | 4,055 | |||||||||||||||
| Total | $ | 2,677,243 | $ | 381,519 | $ | 112,519 | $ | 43,258 | $ | 24,055 | ||||||||||
(1) Excludes interest
(2) Certificates of deposit give customers the right to early withdrawal. Early withdrawals may be subject to penalties.
The penalty amount depends on the remaining time to maturity at the time of early withdrawal.
Capital Adequacy
As of December 31, 2012, our most recent notification from the FDIC categorized us as well-capitalized under the regulatory framework for prompt corrective action. To remain categorized as well-capitalized, we must maintain minimum total risk-based, Tier 1 risk-based, and Tier 1 leverage ratios as disclosed in the table below. Our management believes that we are well-capitalized under the prompt corrective action provisions as of December 31, 2012. In addition, the Alabama Banking Department has required that the Bank maintain a leverage ratio of 8.00%.
The following table sets forth (i) the capital ratios required by the FDIC and the Alabama Banking Department’s leverage ratio requirement to be maintained by the Bank in order to maintain “well-capitalized” status and (ii) our actual ratios of capital to total regulatory or risk-weighted assets, as of December 31, 2012.
| Well- Capitalized | Actual at December 31, 2012 | |||||||
| Total risk-based capital | 10.00 | % | 11.78 | % | ||||
| Tier 1 capital | 6.00 | % | 9.89 | % | ||||
| Leverage ratio | 5.00 | % | 8.43 | % | ||||
| 54 |
For a description of capital ratios see Note 15 to “Notes to Consolidated Financial Statements”.
Impact of Inflation
Our consolidated financial statements and related data presented herein have been prepared in accordance with generally accepted accounting principles which require the measure of financial position and operating results in terms of historic dollars, without considering changes in the relative purchasing power of money over time due to inflation.
Inflation generally increases the costs of funds and operating overhead, and to the extent loans and other assets bear variable rates, the yields on such assets. Unlike most industrial companies, virtually all of the assets and liabilities of a financial institution are monetary in nature. As a result, interest rates generally have a more significant effect on the performance of a financial institution than the effects of general levels of inflation. In addition, inflation affects financial institutions’ cost of goods and services purchased, the cost of salaries and benefits, occupancy expense, and similar items. Inflation and related increases in interest rates generally decrease the market value of investments and loans held and may adversely affect liquidity, earnings and stockholders’ equity. Mortgage originations and refinancing tend to slow as interest rates increase, and likely will reduce our volume of such activities and the income from the sale of residential mortgage loans in the secondary market.
Adoption of Recent Accounting Pronouncements
New accounting standards are discussed in Note 1 to “Notes to Consolidated Financial Statements”.
ITEM 7A. QUANTITATIVE AND QUALITATIVE DISCLOSURES ABOUT MARKET RISK.
Like all financial institutions, we are subject to market risk from changes in interest rates. Interest rate risk is inherent in the balance sheet due to the mismatch between the maturities of rate-sensitive assets and rate-sensitive liabilities. If rates are rising, and the level of rate-sensitive liabilities exceeds the level of rate-sensitive assets, the net interest margin will be negatively impacted. Conversely, if rates are falling, and the level of rate-sensitive liabilities is greater than the level of rate-sensitive assets, the impact on the net interest margin will be favorable. Managing interest rate risk is further complicated by the fact that all rates do not change at the same pace; in other words, short term rates may be rising while longer term rates remain stable. In addition, different types of rate-sensitive assets and rate-sensitive liabilities react differently to changes in rates.
To manage interest rate risk, we must take a position on the expected future trend of interest rates. Rates may rise, fall, or remain the same. Our asset liability committee develops its view of future rate trends and strives to manage rate risk within a targeted range by monitoring economic indicators, examining the views of economists and other experts, and understanding the current status of our balance sheet. Our annual budget reflects the anticipated rate environment for the next twelve months. The asset liability committee conducts a quarterly analysis of the rate sensitivity position and reports its results to our board of directors.
The asset liability committee employs multiple modeling scenarios to analyze the maturities of rate-sensitive assets and liabilities. The model measures the “gap” which is defined as the difference between the dollar amount of rate-sensitive assets repricing during a period and the volume of rate-sensitive liabilities repricing during the same period. The gap is also expressed as the ratio of rate-sensitive assets divided by rate-sensitive liabilities. If the ratio is greater than “one”, the dollar value of assets exceeds the dollar value of liabilities; the balance sheet is “asset sensitive”. Conversely, if the value of liabilities exceeds the value of assets, the ratio is less than one and the balance sheet is “liability sensitive”. Our internal policy requires management to maintain the gap such that net interest margins will not change more than 10% if interest rates change 100 basis points or more than 15% if interest rates change 200 basis points. As of December 31, 2012, our gap was within such ranges.
The model measures scheduled maturities in periods of three months, four to twelve months, one to five years and over five years. The chart below illustrates our rate-sensitive position at December 31, 2012. Management uses the one year gap as the appropriate time period for setting strategy.
| 55 |
| Rate Sensitive Gap Analysis | ||||||||||||||||||||
| 1-3 Months | 4-12 Months | 1-5 Years | Over 5 Years | Total | ||||||||||||||||
| (Dollars in Thousands) | ||||||||||||||||||||
| Interest-earning assets: | ||||||||||||||||||||
| Loans, including mortgages held for sale | $ | 1,471,421 | $ | 235,343 | $ | 587,217 | $ | 95,026 | $ | 2,389,007 | ||||||||||
| Securities | 27,139 | 35,428 | 129,440 | 71,778 | 263,785 | |||||||||||||||
| Federal funds sold | 3,291 | - | - | - | 3,291 | |||||||||||||||
| Interest bearing balances with banks | 117,218 | - | 2,205 | - | 119,423 | |||||||||||||||
| Total interest-earning assets | $ | 1,619,069 | $ | 270,771 | $ | 718,862 | $ | 166,804 | $ | 2,775,506 | ||||||||||
| Interest-bearing liabilities: | ||||||||||||||||||||
| Deposits: | ||||||||||||||||||||
| Interest-bearing checking | $ | 449,373 | $ | - | $ | - | $ | - | $ | 449,373 | ||||||||||
| Money market and savings | 1,121,343 | - | - | - | 1,121,343 | |||||||||||||||
| Time deposits | 82,771 | 164,738 | 148,198 | (25 | ) | 395,682 | ||||||||||||||
| Federal funds purchased | 117,065 | - | - | - | 117,065 | |||||||||||||||
| Other borrowings | - | - | - | 19,917 | 19,917 | |||||||||||||||
| Trust preferred securities | 15,050 | - | - | - | 15,050 | |||||||||||||||
| Total interest-bearing liabilities | $ | 1,785,602 | $ | 164,738 | $ | 148,198 | $ | 19,892 | $ | 2,118,430 | ||||||||||
| Interest sensitivity gap | $ | (166,533 | ) | $ | 106,033 | $ | 570,664 | $ | 146,912 | $ | 657,076 | |||||||||
| Cumulative sensitivity gap | $ | (166,533 | ) | $ | (60,500 | ) | $ | 510,164 | $ | 657,076 | - | |||||||||
| Percent of cumulative sensitivity Gap to total interest-earning assets | (6.0 | )% | (2.2 | )% | 18.4 | % | 23.7 | % | ||||||||||||
The interest rate risk model that defines the gap position also performs a “rate shock” test of the balance sheet. The rate shock procedure measures the impact on the economic value of equity (EVE) which is a measure of long term interest rate risk. EVE is the difference between the market value of our assets and the liabilities and is our liquidation value. In this analysis, the model calculates the discounted cash flow or market value of each category on the balance sheet. The percent change in EVE is a measure of the volatility of risk. Regulatory guidelines specify a maximum change of 30% for a 200 basis points rate change. Short term rates dropped to historically low levels during 2009 and have remained at those low levels. We could not assume further drops in interest rates in our model, and as a result feel the down rate shock scenarios are not meaningful. At December 31, 2012, the 5.10% change for a 200 basis points rate change is well within the regulatory guidance range.
The chart below identifies the EVE impact of an upward shift in rates of 100 and 200 basis points.
| Economic Value of Equity Under Rate Shock | ||||||||||||
| At December 31, 2012 | ||||||||||||
| 0 bps | +100 bps | +200 bps | ||||||||||
| (Dollars in Thousands) | ||||||||||||
| Economic value of equity | $ | 233,257 | $ | 239,088 | $ | 245,153 | ||||||
| Actual dollar change | $ | 5,831 | $ | 11,896 | ||||||||
| Percent change | 2.50 | % | 5.10 | % | ||||||||
The one year gap ratio of negative 2.2% indicates that we would show a small decrease in net interest income in a rising rate environment, and the EVE rate shock shows that the EVE would increase in a rising rate environment. The EVE simulation model is a static model which provides information only at a certain point in time. For example, in a rising rate environment, the model does not take into account actions which management might take to change the impact of rising rates on us. Given that limitation, it is still useful in assessing the impact of an unanticipated movement in interest rates.
The above analysis may not on its own be an entirely accurate indicator of how net interest income or EVE will be affected by changes in interest rates. Income associated with interest earning assets and costs associated with interest bearing liabilities may not be affected uniformly by changes in interest rates. In addition, the magnitude and duration of changes in interest rates may have a significant impact on net interest income. Interest rates on certain types of assets and liabilities fluctuate in advance of changes in general market rates, while interest rates on other types may lag behind changes in general market rates. Our asset liability committee develops its view of future rate trends by monitoring economic indicators, examining the views of economists and other experts, and understanding the current status of our balance sheet and conducts a quarterly analysis of the rate sensitivity position. The results of the analysis are reported to our board of directors.
| 56 |
ITEM 8. FINANCIAL STATEMENTS AND SUPPLEMENTARY DATA
The financial statements and supplementary data required by Regulations S-X and by Item 302 of Regulation S-K are set forth in the pages listed below.
| Page | |
| Report of Independent Registered Public Accounting Firm on Consolidated Financial Statements | 58 |
| Report of Independent Registered Public Accounting Firm on Consolidated Financial Statements | 59 |
| Report of Management on Internal Control over Financial Reporting | 60 |
| Report of Independent Registered Public Accounting Firm on Internal Control over Financial Reporting | 61 |
| Consolidated Balance Sheets at December 31, 2012 and 2011 | 62 |
| Consolidated Statements of Income for the Years Ended December 31, 2012, 2011 and 2010 | 63 |
| Consolidated Statements of Comprehensive Income for the Years Ended December 31, 2012, 2011 and 2010 | 64 |
| Consolidated Statements of Stockholders’ Equity for Years Ended December 31, 2012, 2011 and 2010 | 65 |
| Consolidated Statements of Cash Flows for the Years Ended December 31, 2012, 2011 and 2010 | 66 |
| Notes to Consolidated Financial Statements | 67 |
| 57 |
REPORT OF INDEPENDENT REGISTERED PUBLIC ACCOUNTING FIRM
The Board of Directors and Shareholders
ServisFirst Bancshares, Inc.:
We have audited the accompanying consolidated balance sheets of ServisFirst Bancshares, Inc. and subsidiaries as of December 31, 2012 and 2011, and the related consolidated statements of income, comprehensive income, stockholders’ equity, and cash flows for each of the years then ended. These consolidated financial statements are the responsibility of the Company’s management. Our responsibility is to express an opinion on these consolidated financial statements based on our audits.
We conducted our audits in accordance with the standards of the Public Company Accounting Oversight Board (United States). Those standards require that we plan and perform the audit to obtain reasonable assurance about whether the financial statements are free of material misstatement. An audit includes examining, on a test basis, evidence supporting the amounts and disclosures in the financial statements. An audit also includes assessing the accounting principles used and significant estimates made by management, as well as evaluating the overall financial statement presentation. We believe that our audits provide a reasonable basis for our opinion.
In our opinion, the consolidated financial statements referred to above present fairly, in all material respects, the financial position of ServisFirst Bancshares, Inc. and subsidiaries as of December 31, 2012 and 2011, and the results of their operations and their cash flows for each of the years then ended, in conformity with U.S. generally accepted accounting principles.
We also have audited, in accordance with the standards of the Public Company Accounting Oversight Board (United States), ServisFirst Banchsares, Inc.’s internal control over financial reporting as of December 31, 2012, based on criteria established in Internal Control — Integrated Framework issued by the Committee of Sponsoring Organizations of the Treadway Commission (COSO), and our report dated March 12, 2013 expressed an unqualified opinion on the effectiveness of the Company’s internal control over financial reporting.
/s/ KPMG LLP
Birmingham, Alabama
March 12, 2013
| 58 |
REPORT OF INDEPENDENT REGISTERED PUBLIC
ACCOUNTING FIRM
To the Board of Directors
ServisFirst Bancshares, Inc.
Birmingham, Alabama
We have audited the accompanying consolidated statement of income, comprehensive income, stockholders’ equity and cash flows for the year ended December 31, 2010. These consolidated financial statements are the responsibility of the Company’s management. Our responsibility is to express an opinion on these consolidated financial statements based on our audit.
We conducted our audits in accordance with the standards of the Public Company Accounting Oversight Board (United States). Those standards require that we plan and perform the audit to obtain reasonable assurance about whether the financial statements are free of material misstatement. An audit includes examining, on a test basis, evidence supporting the amounts and disclosures in the consolidated financial statements. An audit also includes assessing the accounting principles used and significant estimates made by management, as well as evaluating the overall financial statement presentation. We believe that our audit provide a reasonable basis for our opinion.
In our opinion, the consolidated financial statements referred to above present fairly, in all material respects, the results of their operations and their cash flows for the year ended December 31, 2010, in conformity with accounting principles generally accepted in the United States of America.
 |
Birmingham, Alabama
March 8, 2011
| 59 |
REPORT OF MANAGEMENT ON INTERNAL CONTROL OVER FINANCIAL REPORTING
We, as members of the Management of ServisFirst Bancshares, Inc. (the “Company”), are responsible for establishing and maintaining effective internal control over financial reporting. The Company’s internal control system was designed to provide reasonable assurance to the Company’s management and Board of Directors regarding the preparation and fair presentation of the Company’s financial statements for external purposes in accordance with U.S. generally accepted accounting principles. Internal control over financial reporting includes self-monitoring mechanisms, and actions are taken to correct deficiencies as they are identified.
All internal controls systems, no matter how well designed, have inherent limitations and may not prevent or detect misstatements in the Company’s financial statements, including the possibility of circumvention or overriding of controls. Therefore, even those systems determined to be effective can provide only reasonable assurance with respect to financial statement preparation and presentation. Also, projections of any evaluation of effectiveness to future periods are subject to the risk that controls may become inadequate because of changes in conditions, or that the degree of compliance with the policies or procedures may deteriorate.
The Company’s management assessed the effectiveness of its internal control over financial reporting as of December 31, 2012. In making this assessment, we used the criteria set forth by the Committee of Sponsoring Organizations of the Treadway Commission (COSO) in its Internal Control—Integrated Framework. Based on this assessment, management determined that the Company maintained effective internal control over financial reporting as of December 31, 2012, based on these criteria.
The Company’s independent registered public accounting firm has issued an audit report on the effectiveness of the Company’s internal control over financial reporting. This report appears on the following page.
| SERVISFIRST BANCSHARES, INC. | ||
| by | /s/THOMAS A. BROUGHTON, III | |
| THOMAS A. BROUGHTON, III | ||
| President and Chief Executive Officer | ||
| by | /s/WILLIAM M. FOSHEE | |
| WILLIAM M. FOSHEE | ||
| Chief Financial Officer |
| 60 |
REPORT OF INDEPENDENT REGISTERED PUBLIC ACCOUNTING FIRM
The Board of Directors and Shareholders
ServisFirst Bancshares, Inc.:
We have audited ServisFirst Bancshares, Inc. internal control over financial reporting as of December 31, 2012, based on criteria established in Internal Control — Integrated Framework issued by the Committee of Sponsoring Organizations of the Treadway Commission (COSO). ServisFirst Bancshares, Inc.’s management is responsible for maintaining effective internal control over financial reporting and for its assessment of the effectiveness of internal control over financial reporting, included in the accompanying Report of Management on Internal Control over Financial Reporting. Our responsibility is to express an opinion on the Company’s internal control over financial reporting based on our audit.
We conducted our audit in accordance with the standards of the Public Company Accounting Oversight Board (United States). Those standards require that we plan and perform the audit to obtain reasonable assurance about whether effective internal control over financial reporting was maintained in all material respects. Our audit included obtaining an understanding of internal control over financial reporting, assessing the risk that a material weakness exists, and testing and evaluating the design and operating effectiveness of internal control based on the assessed risk. Our audit also included performing such other procedures as we considered necessary in the circumstances. We believe that our audit provides a reasonable basis for our opinion.
A company’s internal control over financial reporting is a process designed to provide reasonable assurance regarding the reliability of financial reporting and the preparation of financial statements for external purposes in accordance with generally accepted accounting principles. A company’s internal control over financial reporting includes those policies and procedures that (1) pertain to the maintenance of records that, in reasonable detail, accurately and fairly reflect the transactions and dispositions of the assets of the company; (2) provide reasonable assurance that transactions are recorded as necessary to permit preparation of financial statements in accordance with generally accepted accounting principles, and that receipts and expenditures of the company are being made only in accordance with authorizations of management and directors of the company; and (3) provide reasonable assurance regarding prevention or timely detection of unauthorized acquisition, use, or disposition of the company’s assets that could have a material effect on the financial statements.
Because of its inherent limitations, internal control over financial reporting may not prevent or detect misstatements. Also, projections of any evaluation of effectiveness to future periods are subject to the risk that controls may become inadequate because of changes in conditions, or that the degree of compliance with the policies or procedures may deteriorate.
In our opinion, ServisFirst Bancshares, Inc. maintained, in all material respects, effective internal control over financial reporting as of December 31, 2012, based on criteria established in Internal Control — Integrated Framework issued by the Committee of Sponsoring Organizations of the Treadway Commission.
We also have audited, in accordance with the standards of the Public Company Accounting Oversight Board (United States), the consolidated balance sheet of ServisFirst Bancshares, Inc. as of December 31, 2012, and the related consolidated statements of income, comprehensive income, stockholders’ equity, and cash flows for the year then ended, and our report dated March 12, 2013 expressed an unqualified opinion on these consolidated financial statements.
/s/ KPMG LLP
Birmingham, Alabama
March 12, 2013
| 61 |
| SERVISFIRST BANCSHARES, INC. AND SUBSIDIARIES |
| CONSOLIDATED BALANCE SHEETS |
| (In thousands, except share and per share amounts) |
| December 31, 2012 | December 31, 2011 | |||||||
| ASSETS | ||||||||
| Cash and due from banks | $ | 58,031 | $ | 43,018 | ||||
| Interest-bearing balances due from depository institutions | 119,423 | 99,350 | ||||||
| Federal funds sold | 3,291 | 100,565 | ||||||
| Cash and cash equivalents | 180,745 | 242,933 | ||||||
| Available for sale debt securities, at fair value | 233,877 | 293,809 | ||||||
| Held to maturity debt securities (fair value of $27,350 and $15,999 at December 31, 2012 and 2011, respectively) | 25,967 | 15,209 | ||||||
| Restricted equity securities | 3,941 | 3,501 | ||||||
| Mortgage loans held for sale | 25,826 | 17,859 | ||||||
| Loans | 2,363,182 | 1,830,742 | ||||||
| Less allowance for loan losses | (26,258 | ) | (22,030 | ) | ||||
| Loans, net | 2,336,924 | 1,808,712 | ||||||
| Premises and equipment, net | 8,847 | 4,591 | ||||||
| Accrued interest and dividends receivable | 9,158 | 8,192 | ||||||
| Deferred tax asset, net | 7,386 | 4,914 | ||||||
| Other real estate owned | 9,685 | 12,275 | ||||||
| Bank owned life insurance contracts | 57,014 | 40,390 | ||||||
| Other assets | 6,944 | 8,400 | ||||||
| Total assets | $ | 2,906,314 | $ | 2,460,785 | ||||
| LIABILITIES AND STOCKHOLDERS' EQUITY | ||||||||
| Liabilities: | ||||||||
| Deposits: | ||||||||
| Noninterest-bearing | $ | 545,174 | $ | 418,810 | ||||
| Interest-bearing | 1,966,398 | 1,725,077 | ||||||
| Total deposits | 2,511,572 | 2,143,887 | ||||||
| Federal funds purchased | 117,065 | 79,265 | ||||||
| Other borrowings | 19,917 | 4,954 | ||||||
| Subordinated debentures | 15,050 | 30,514 | ||||||
| Accrued interest payable | 942 | 945 | ||||||
| Other liabilities | 8,511 | 4,928 | ||||||
| Total liabilities | 2,673,057 | 2,264,493 | ||||||
| Stockholders' equity: | ||||||||
| Preferred stock, Series A Senior Non-Cumulative Perpetual, par value $0.001 (liquidation preference $1,000), net of discount; 40,000 shares authorized, 40,000 shares issued and outstanding at December 31, 2012 and at December 31, 2011 | 39,958 | 39,958 | ||||||
| Preferred stock, par value $0.001 per share; 1,000,000 authorized and 960,000 currently undesignated | - | - | ||||||
| Common stock, par value $0.001 per share; 50,000,000 shares authorized; 6,268,812 shares issued and outstanding at December 31, 2012 and 5,932,182 shares issued and outstanding at December 31, 2011 | 6 | 6 | ||||||
| Additional paid-in capital | 93,505 | 87,805 | ||||||
| Retained earnings | 92,492 | 61,581 | ||||||
| Accumulated other comprehensive income | 7,296 | 6,942 | ||||||
| Total stockholders' equity | 233,257 | 196,292 | ||||||
| Total liabilities and stockholders' equity | $ | 2,906,314 | $ | 2,460,785 | ||||
See Notes to Consolidated Financial Statements.
| 62 |
SERVISFIRST BANCSHARES, INC. AND SUBSIDIARIES
CONSOLIDATED STATEMENTS OF INCOME
(In thousands, except per share amounts)
| Year Ended December 31, | ||||||||||||
| 2012 | 2011 | 2010 | ||||||||||
| Interest income: | ||||||||||||
| Interest and fees on loans | $ | 100,462 | $ | 82,294 | $ | 69,115 | ||||||
| Taxable securities | 4,814 | 5,721 | 6,482 | |||||||||
| Nontaxable securities | 3,246 | 2,943 | 2,274 | |||||||||
| Federal funds sold | 196 | 176 | 104 | |||||||||
| Other interest and dividends | 305 | 277 | 171 | |||||||||
| Total interest income | 109,023 | 91,411 | 78,146 | |||||||||
| Interest expense: | ||||||||||||
| Deposits | 12,249 | 13,047 | 11,941 | |||||||||
| Borrowed funds | 2,652 | 3,033 | 3,319 | |||||||||
| Total interest expense | 14,901 | 16,080 | 15,260 | |||||||||
| Net interest income | 94,122 | 75,331 | 62,886 | |||||||||
| Provision for loan losses | 9,100 | 8,972 | 10,350 | |||||||||
| Net interest income after provision for loan losses | 85,022 | 66,359 | 52,536 | |||||||||
| Noninterest income: | ||||||||||||
| Service charges on deposit accounts | 2,756 | 2,290 | 2,316 | |||||||||
| Mortgage banking | 3,560 | 2,373 | 2,174 | |||||||||
| Securities gains | - | 666 | 108 | |||||||||
| Increase in cash surrender value life insurance | 1,624 | 390 | - | |||||||||
| Other operating income | 1,703 | 1,207 | 571 | |||||||||
| Total noninterest income | 9,643 | 6,926 | 5,169 | |||||||||
| Noninterest expenses: | ||||||||||||
| Salaries and employee benefits | 22,587 | 19,518 | 14,669 | |||||||||
| Equipment and occupancy expense | 4,014 | 3,697 | 3,184 | |||||||||
| Professional services | 1,455 | 1,213 | 925 | |||||||||
| FDIC and other regulatory assessments | 1,595 | 1,796 | 2,944 | |||||||||
| Other real estate owned expense | 2,727 | 820 | 1,964 | |||||||||
| Other operating expenses | 10,722 | 10,414 | 7,283 | |||||||||
| Total noninterest expenses | 43,100 | 37,458 | 30,969 | |||||||||
| Income before income taxes | 51,565 | 35,827 | 26,736 | |||||||||
| Provision for income taxes | 17,120 | 12,389 | 9,358 | |||||||||
| Net income | 34,445 | 23,438 | 17,378 | |||||||||
| Dividends on preferred stock | 400 | 200 | - | |||||||||
| Net income available to common stockholders | $ | 34,045 | $ | 23,238 | $ | 17,378 | ||||||
| Basic earnings per common share | $ | 5.68 | $ | 4.03 | $ | 3.15 | ||||||
| Diluted earnings per common share | $ | 4.99 | $ | 3.53 | $ | 2.84 | ||||||
See Notes to Consolidated Financial Statements.
| 63 |
SERVISFIRST BANCSHARES, INC. AND SUBSIDIARIES
CONSOLIDATED STATEMENTS OF COMPREHENSIVE INCOME
YEARS ENDED DECEMBER 31, 2012, 2011 AND 2010
(In thousands)
| 2012 | 2011 | 2010 | ||||||||||
| Net income | $ | 34,445 | $ | 23,438 | $ | 17,378 | ||||||
| Other comprehensive income, net of tax: | ||||||||||||
| Unrealized holding gains arising during period from securities available for sale, net of tax of $191, $2,944 and $755 for 2012, 2011 and 2010, respectively | 354 | 4,519 | 1,334 | |||||||||
| Reclassification adjustment for net gains on sale of securities in net income, net of tax benefit of $252 and $39 for 2011 and 2010, respectively | - | (414 | ) | (70 | ) | |||||||
| Other comprehensive income, net of tax | 354 | 4,105 | 1,264 | |||||||||
| Comprehensive income | $ | 34,799 | $ | 27,543 | $ | 18,642 | ||||||
See Notes to Consolidated Financial Statements
| 64 |
SERVISFIRST BANCSHARES, INC. AND SUBSIDIARIES
CONSOLIDATED STATEMENT OF STOCKHOLDERS' EQUITY
YEARS ENDED DECEMBER 31, 2012, 2011 AND 2010
(In thousands, except share amounts)
(Unaudited)
| Preferred Stock | Common Stock | Additional Paid-in Capital | Retained Earnings | Accumulated Other Comprehensive Income | Total Stockholders' Equity | |||||||||||||||||||
| Balance, December 31, 2009 | $ | - | $ | 6 | $ | 75,078 | $ | 20,965 | $ | 1,573 | $ | 97,622 | ||||||||||||
| Exercise 10,000 stock options, including tax benefit | - | - | 123 | - | - | 123 | ||||||||||||||||||
| Stock-based compensation expense | - | - | 713 | - | - | 713 | ||||||||||||||||||
| Other comprehensive income | - | - | - | - | 1,264 | 1,264 | ||||||||||||||||||
| Net income | - | - | - | 17,378 | - | 17,378 | ||||||||||||||||||
| Balance, December 31, 2010 | - | 6 | 75,914 | 38,343 | 2,837 | 117,100 | ||||||||||||||||||
| Sale of 340,000 shares of common stock | - | - | 10,159 | - | - | 10,159 | ||||||||||||||||||
| Sale of 40,000 shares of preferred stock, net | 39,958 | - | - | - | - | 39,958 | ||||||||||||||||||
| Preferred dividends paid | - | - | - | (200 | ) | - | (200 | ) | ||||||||||||||||
| Exercise 64,700 stock options, including tax benefit | - | - | 757 | - | - | 757 | ||||||||||||||||||
| Stock-based compensation expense | - | - | 975 | - | - | 975 | ||||||||||||||||||
| Other comprehensive income | - | - | - | - | 4,105 | 4,105 | ||||||||||||||||||
| Net income | - | - | - | 23,438 | - | 23,438 | ||||||||||||||||||
| Balance, December 31, 2011 | 39,958 | 6 | 87,805 | 61,581 | 6,942 | 196,292 | ||||||||||||||||||
| Dividends paid | - | - | - | (3,134 | ) | - | (3,134 | ) | ||||||||||||||||
| Preferred dividends paid | - | - | - | (400 | ) | - | (400 | ) | ||||||||||||||||
| Exercise 332,630 stock options and warrants, including tax benefit | - | - | 4,651 | - | - | 4,651 | ||||||||||||||||||
| Stock-based compensation expense | - | - | 1,049 | - | - | 1,049 | ||||||||||||||||||
| Other comprehensive income | - | - | - | - | 354 | 354 | ||||||||||||||||||
| Net income | - | - | - | 34,445 | - | 34,445 | ||||||||||||||||||
| Balance, December 31, 2012 | $ | 39,958 | $ | 6 | $ | 93,505 | $ | 92,492 | $ | 7,296 | $ | 233,257 | ||||||||||||
See Notes to Consolidated Financial Statements
| 65 |
SERVISFIRST BANCSHARES, INC. AND SUBSIDIARIES
CONSOLIDATED STATEMENTS OF CASH FLOWS
YEARS ENDED DECEMBER 31, 2012, 2011 AND 2010
(In thousands) (Unaudited)
| 2012 | 2011 | 2010 | ||||||||||
| OPERATING ACTIVITIES | ||||||||||||
| Net income | $ | 34,445 | $ | 23,438 | $ | 17,378 | ||||||
| Adjustments to reconcile net income to net cash provided by | ||||||||||||
| Deferred tax benefit | (2,181 | ) | (1,240 | ) | (2,212 | ) | ||||||
| Provision for loan losses | 9,100 | 8,972 | 10,350 | |||||||||
| Depreciation and amortization | 1,218 | 1,173 | 1,066 | |||||||||
| Net amortization of investments | 1,079 | 958 | 823 | |||||||||
| Market value adjustment of interest rate cap | 9 | 106 | 45 | |||||||||
| Increase in accrued interest and dividends receivable | (966 | ) | (1,202 | ) | (790 | ) | ||||||
| Stock-based compensation expense | 1,049 | 975 | 713 | |||||||||
| (Decrease) increase in accrued interest payable | (3 | ) | 47 | (128 | ) | |||||||
| Proceeds from sale of mortgage loans held for sale | 239,292 | 169,172 | 174,760 | |||||||||
| Originations of mortgage loans held for sale | (243,699 | ) | (177,200 | ) | (175,046 | ) | ||||||
| Gain on sale of securities available for sale | - | (666 | ) | (108 | ) | |||||||
| Gain on sale of mortgage loans held for sale | (3,560 | ) | (2,373 | ) | (2,174 | ) | ||||||
| Net loss (gain) on sale of other real estate owned | 105 | (76 | ) | 203 | ||||||||
| Write down of other real estate owned | 2,189 | 326 | 1,051 | |||||||||
| Decrease in special prepaid FDIC insurance assessments | 1,322 | 1,492 | 2,538 | |||||||||
| Increase in cash surrender value of life insurance contracts | (1,624 | ) | (390 | ) | - | |||||||
| Loss on prepayment of other borrowings | - | 738 | - | |||||||||
| Excess tax benefits from the exercise of warrants | (381 | ) | (127 | ) | - | |||||||
| Net change in other assets, liabilities, and other operating activities | 3,790 | 200 | 1,106 | |||||||||
| Net cash provided by operating activities | 41,184 | 24,323 | 29,575 | |||||||||
| INVESTMENT ACTIVITIES | ||||||||||||
| Purchase of securities available for sale | (47,867 | ) | (102,190 | ) | (84,425 | ) | ||||||
| Proceeds from maturities, calls and paydowns of securities | ||||||||||||
| available for sale | 106,783 | 28,575 | 31,889 | |||||||||
| Purchase of securities held to maturity | (11,701 | ) | (15,441 | ) | (4,589 | ) | ||||||
| Proceeds from maturities, calls and paydowns of securities | ||||||||||||
| held to maturity | 943 | 5,466 | - | |||||||||
| Increase in loans | (540,019 | ) | (449,449 | ) | (197,572 | ) | ||||||
| Purchase of premises and equipment | (5,474 | ) | (1,314 | ) | (428 | ) | ||||||
| Purchase of restricted equity securities | (787 | ) | (543 | ) | (269 | ) | ||||||
| Purchase of interest rate cap | - | - | (160 | ) | ||||||||
| Purchase of bank-owned life insurance contracts | (15,000 | ) | (40,000 | ) | - | |||||||
| Proceeds from sale of securities available for sale | - | 63,270 | 32,297 | |||||||||
| Proceeds from sale of restricted equity securities | 347 | 552 | - | |||||||||
| Proceeds from sale of other real estate owned | 2,967 | 3,334 | 7,995 | |||||||||
| Additions to other real estate owned | - | - | (75 | ) | ||||||||
| Net cash used in investing activities | (509,808 | ) | (507,740 | ) | (215,337 | ) | ||||||
| FINANCING ACTIVITIES | ||||||||||||
| Net increase in noninterest-bearing deposits | 126,364 | 168,320 | 39,183 | |||||||||
| Net increase in interest-bearing deposits | 241,321 | 216,851 | 287,178 | |||||||||
| Net increase in federal funds purchased | 37,800 | 79,265 | - | |||||||||
| Proceeds from other borrowings | 19,917 | - | - | |||||||||
| Proceeds from issuance of subordinated debentures | - | - | 15,050 | |||||||||
| Redemption of subordinated debentures | (15,464 | ) | - | - | ||||||||
| Proceeds from sale of common stock, net | - | 10,032 | - | |||||||||
| Proceeds from sale of preferred stock, net | - | 39,958 | - | |||||||||
| Proceeds from exercise of stock options and warrants | 4,651 | 757 | 123 | |||||||||
| Excess tax benefits from exercise of stock options and warrants | 381 | 127 | - | |||||||||
| Repayment of other borrowings | (5,000 | ) | (20,738 | ) | - | |||||||
| Dividends on common stock | (3,134 | ) | - | - | ||||||||
| Dividends on preferred stock | (400 | ) | (200 | ) | - | |||||||
| Net cash provided by financing activities | 406,436 | 494,372 | 341,534 | |||||||||
| Net (decrease) increase in cash and cash equivalents | (62,188 | ) | 10,955 | 155,772 | ||||||||
| Cash and cash equivalents at beginning of year | 242,933 | 231,978 | 76,206 | |||||||||
| Cash and cash equivalents at end of year | $ | 180,745 | $ | 242,933 | $ | 231,978 | ||||||
| SUPPLEMENTAL DISCLOSURE | ||||||||||||
| Cash paid for: | ||||||||||||
| Interest | $ | 14,904 | $ | 16,033 | $ | 15,388 | ||||||
| Income taxes | 13,134 | 15,837 | 6,958 | |||||||||
| NONCASH TRANSACTIONS | ||||||||||||
| Transfers of loans from held for sale to held for investment | $ | - | $ | 417 | $ | 787 | ||||||
| Other real estate acquired in settlement of loans | 2,695 | 9,029 | 5,372 | |||||||||
| Internally financed sales of other real estate owned | 24 | 136 | 1,757 | |||||||||
See Notes to Consolidated Financial Statements.
| 66 |
SERVISFIRST BANCSHARES, INC. AND SUBSIDIARIES
NOTES TO CONSOLIDATED FINANCIAL STATEMENTS
NOTE 1. SUMMARY OF SIGNIFICANT ACCOUNTING POLICIES
Nature of Operations
ServisFirst Bancshares, Inc. (the “Company”) was formed on August 16, 2007 and is a bank holding company whose business is conducted by its wholly-owned subsidiary ServisFirst Bank (the “Bank”). The Bank is headquartered in Birmingham, Alabama, and provides a full range of banking services to individual and corporate customers throughout the Birmingham market since opening for business in May 2005. The Bank has since expanded into the Huntsville, Montgomery and Dothan, Alabama markets, and most recently into the Mobile, Alabama and Pensacola, Florida markets. The Bank has a subsidiary, SF Holding 1, Inc., which has a subsidiary, SF Realty 1, Inc., which operates as a real estate investment trust. More details about SF Holding 1, Inc. and SF Realty 1, Inc. are included in Note 10.
Basis of Presentation and Accounting Estimates
To prepare consolidated financial statements in conformity with U.S. generally accepted accounting principles, management makes estimates and assumptions based on available information. These estimates and assumptions affect the amounts reported in the financial statements and the disclosures provided, and future results could differ. The allowance for loan losses, valuation of foreclosed real estate, deferred taxes, and fair values of financial instruments are particularly subject to change. All numbers are in thousands except share and per share data.
Cash, Due from Banks, Interest-Bearing Balances due from Financial Institutions
Cash and due from banks includes cash on hand, cash items in process of collection, amounts due from banks and interest bearing balances due from financial institutions. For purposes of cash flows, cash and cash equivalents include cash and due from banks and federal funds sold. Generally, federal funds are purchased and sold for one-day periods. Cash flows from loans, mortgage loans held for sale, federal funds sold, and deposits are reported net.
The Bank is required to maintain reserve balances in cash or on deposit with the Federal Reserve Bank based on a percentage of deposits. The total of those reserve balances was approximately $16.0 million at December 31, 2012 and $7.5 million at December 31, 2011.
Debt Securities
Securities are classified as available-for-sale when they might be sold before maturity. Unrealized holding gains and losses, net of tax, on securities available for sale are reported as a net amount in a separate component of stockholders’ equity until realized. Gains and losses on the sale of securities available for sale are determined using the specific-identification method. The amortization of premiums and the accretion of discounts are recognized in interest income using methods approximating the interest method over the period to maturity.
Declines in the fair value of available-for-sale securities below their cost that are deemed to be other than temporary are reflected in earnings as realized losses. Securities are classified as held-to-maturity when the Company has the positive intent and ability to hold the securities to maturity. Held-to-maturity securities are reported at amortized cost. In determining the existence of other-than-temporary impairment losses, management considers (1) the length of time and the extent to which the fair value has been less than cost, (2) the financial condition and near-term prospects of the issuer, and (3) the intent and ability of the Company to retain its investment in the issuer for a period of time sufficient to allow for any anticipated recovery in fair value.
| Investments in Restricted Equity Securities Carried at Cost |
| Investments in restricted equity securities without a readily determinable market value are carried at cost. |
| 67 |
| Mortgage Loans Held for Sale |
The Company classifies certain residential mortgage loans as held for sale. Typically mortgage loans held for sale are sold to a third party investor within a very short time period. The loans are sold without recourse and servicing is not retained. Net fees earned from this banking service are recorded in noninterest income.
In the course of originating mortgage loans and selling those loans in the secondary market, the Company makes various representations and warranties to the purchaser of the mortgage loans. Every loan closed by the Bank’s mortgage center is run through a government agency automated underwriting system. Any exceptions noted during this process are remedied prior to sale. These representations and warranties also apply to underwriting the real estate appraisal opinion of value for the collateral securing these loans. Under the representations and warranties, failure by the Company to comply with the underwriting and/or appraisal standards could result in the Company being required to repurchase the mortgage loan or to reimburse the investor for losses incurred (make whole requests) if such failure cannot be cured by the Company within the specified period following discovery. The Company continues to experience a manageable level of investor repurchase demands. There were no expenses incurred as part of these buyback obligations for the years ended December 31, 2012 and 2011.
Loans
| Loans are reported at unpaid principal balances, less unearned fees and the allowance for loan losses. Interest on all loans is recognized as income based upon the applicable rate applied to the daily outstanding principal balance of the loans. Interest income on nonaccrual loans is recognized on a cash basis or cost recovery basis until the loan is returned to accrual status. Loan fees, net of direct costs, are reflected as an adjustment to the yield of the related loan over the term of the loan. The Company does not have a concentration of loans to any one industry or geographic market. |
The accrual of interest on loans is discontinued when there is a significant deterioration in the financial condition of the borrower and full repayment of principal and interest is not expected or the principal or interest is more than 90 days past due, unless the loan is both well-collateralized and in the process of collection. Generally, all interest accrued but not collected for loans that are placed on nonaccrual status are reversed against current interest income. Interest collections on nonaccrual loans are generally applied as principal reductions. The Company determines past due or delinquency status of a loan based on contractual payment terms.
A loan is considered impaired when it is probable the Company will be unable to collect all principal and interest payments due according to the contractual terms of the loan agreement. Individually identified impaired loans are measured based on the present value of expected payments using the loan’s original effective rate as the discount rate, the loan’s observable market price, or the fair value of the collateral if the loan is collateral dependent. If the recorded investment in the impaired loan exceeds the measure of fair value, a valuation allowance may be established as part of the allowance for loan losses. Changes to the valuation allowance are recorded as a component of the provision for loan losses.
Impaired loans also include troubled debt restructurings (“TDRs”). In the normal course of business management grants concessions to borrowers, which would not otherwise be considered, where the borrowers are experiencing financial difficulty. The concessions granted most frequently for TDRs involve reductions or delays in required payments of principal and interest for a specified time, the rescheduling of payments in accordance with a bankruptcy plan or the charge-off of a portion of the loan. In some cases, the conditions of the credit also warrant nonaccrual status, even after the restructure occurs. As part of the credit approval process, the restructured loans are evaluated for adequate collateral protection in determining the appropriate accrual status at the time of restructure. TDR loans may be returned to accrual status if there has been at least a six month sustained period of repayment performance by the borrower.
Allowance for Loan Losses
| The allowance for loan losses is maintained at a level which, in management’s judgment, is adequate to absorb credit losses inherent in the loan portfolio. The amount of the allowance is based on management’s evaluation of the collectability of the loan portfolio, including the nature of the portfolio, credit concentrations, trends in historical loss experience, specific impaired loans, economic conditions, and other risks inherent in the portfolio. Allowances for impaired loans are generally determined based on collateral values or the present value of the estimated cash flows. The allowance is increased by a provision for loan losses, which is charged to expense, and reduced by charge-offs, net of recoveries. In addition, various regulatory agencies, as an integral part of their examination process, periodically review the allowance for losses on loans. Such agencies may require the Company to recognize adjustments to the allowance based on their judgments about information available to them at the time of their examination. |
| 68 |
Foreclosed Real Estate
Foreclosed real estate includes both formally foreclosed property and in-substance foreclosed property. At the time of foreclosure, foreclosed real estate is recorded at fair value less cost to sell, which becomes the property’s new basis. Any write downs based on the asset’s fair value at date of acquisition are charged to the allowance for loan losses. After foreclosure, these assets are carried at the lower of their new cost basis or fair value less cost to sell. Costs incurred in maintaining foreclosed real estate and subsequent adjustments to the carrying amount of the property are included in other operating expenses.
Premises and Equipment
Premises and equipment are stated at cost less accumulated depreciation. Expenditures for additions and major improvements that significantly extend the useful lives of the assets are capitalized. Expenditures for repairs and maintenance are charged to expense as incurred. Assets which are disposed of are removed from the accounts and the resulting gains or losses are recorded in operations. Depreciation is calculated on a straight-line basis over the estimated useful lives of the related assets (3 to 10 years).
Leasehold improvements are amortized on a straight-line basis over the lesser of the lease terms or the estimated useful lives of the improvements.
Derivatives and Hedging Activities
| As part of its overall interest rate risk management, the Company uses derivative instruments, which can include interest rate swaps, caps, and floors. Financial Accounting Standards Board (“FASB”) ASC 815-10, Derivatives and Hedging, requires all derivative instruments to be carried at fair value on the balance sheet. This accounting standard provides special accounting provisions for derivative instruments that qualify for hedge accounting. To be eligible, the Company must specifically identify a derivative as a hedging instrument and identify the risk being hedged. The derivative instrument must be shown to meet specific requirements under this accounting standard. |
| The Company designates the derivative on the date the derivative contract is entered into as (1) a hedge of the fair value of a recognized asset or liability or of an unrecognized firm commitment (a “fair-value” hedge) or (2) a hedge of a forecasted transaction of the variability of cash flows to be received or paid related to a recognized asset or liability (a “cash-flow” hedge). Changes in the fair value of a derivative that is highly effective as a fair-value hedge, and that is designated and qualifies as a fair-value hedge, along with the loss or gain on the hedged asset or liability that is attributable to the hedged risk (including losses or gains on firm commitments), are recorded in current-period earnings. The effective portion of the changes in the fair value of a derivative that is highly effective and that is designated and qualifies as a cash-flow hedge is recorded in other comprehensive income, until earnings are affected by the variability of cash flows (e.g., when periodic settlements on a variable-rate asset or liability are recorded in earnings). The remaining gain or loss on the derivative, if any, in excess of the cumulative change in the present value of future cash flows of the hedged item is recognized in earnings. |
| The Company formally documents all relationships between hedging instruments and hedged items, as well as its risk-management objective and strategy for undertaking various hedge transactions. This process includes linking all derivatives that are designated as fair-value or cash-flow hedges to specific assets and liabilities on the balance sheet or to specific firm commitments or forecasted transactions. The Company also formally assessed, both at the hedge’s inception and on an ongoing basis (if the hedges do not qualify for short-cut accounting), whether the derivatives that are used in hedging transactions are highly effective in offsetting changes in fair values or cash flows of hedged items. When it is determined that a derivative is not highly effective as a hedge or that it has ceased to be a highly effective hedge, the Company discontinues hedge accounting prospectively, as discussed below. The Company discontinues hedge accounting prospectively when: (1) it is determined that the derivative is no longer effective in offsetting changes in the fair value or cash flows of a hedged item (including firm commitments or forecasted transactions); (2) the derivative expires or is sold, terminated, or exercised; (3) the derivative is re-designated as a hedge instrument, because it is unlikely that a forecasted transaction will occur; (4) a hedged firm commitment no longer meets the definition of a firm commitment; or (5) management determines that designation of the derivative as a hedge instrument is no longer appropriate. |
When hedge accounting is discontinued because it is determined that the derivative no longer qualifies as an effective fair-value hedge, hedge accounting is discontinued prospectively and the derivative will continue to be carried on the balance sheet at its fair value with all changes in fair value being recorded in earnings but with no offsetting being recorded on the hedged item or in other comprehensive income for cash flow hedges.
| 69 |
The Company uses derivatives to hedge interest rate exposures associated with mortgage loans held for sale and mortgage loans in process. The Company regularly enters into derivative financial instruments in the form of forward contracts, as part of its normal asset/liability management strategies. The Company’s obligations under forward contracts consist of “best effort” commitments to deliver mortgage loans originated in the secondary market at a future date. Interest rate lock commitments related to loans that are originated for later sale are classified as derivatives. In the normal course of business, the Company regularly extends these rate lock commitments to customers during the loan origination process. The fair values of the Company’s forward contract and rate lock commitments to customers as of December 31, 2012 and 2011 were not material and have not been recorded.
During 2008 the Company entered into interest rate swaps (“swaps”) to facilitate customer transactions and meet their financing needs. Upon entering into these swaps, the Company entered into offsetting positions with a regional correspondent bank in order to minimize the risk to the Company. As of December 31, 2012, the Company was party to two swaps with notional amounts totaling approximately $11.1 million with customers, and two swaps with notional amounts totaling approximately $11.1 million with a regional correspondent bank. These swaps qualify as derivatives, but are not designated as hedging instruments.
Income Taxes
| Income tax expense is the total of the current year income tax due or refundable and the change in deferred tax assets and liabilities. Deferred tax assets and liabilities are the expected future tax amounts for the temporary differences between carrying amounts and tax bases of assets and liabilities, computed using enacted tax rates. A valuation allowance, if needed, reduces deferred tax assets to the amount expected to be realized. |
Stock-Based Compensation
| At December 31, 2012, the Company had two stock-based employee compensation plans for grants of equity compensation to key employees. These plans have been accounted for under the provisions of FASB ASC 718-10, Compensation – Stock Compensation. The stock-based employee compensation plans are more fully described in Note 13. |
Earnings per Common Share
| Basic earnings per common share are computed by dividing net income by the weighted average number of common shares outstanding during the period. Diluted earnings per common share include the dilutive effect of additional potential common shares issuable under stock options and warrants. |
| Loan Commitments and Related Financial Instruments |
Financial instruments, which include credit card arrangements, commitments to make loans and standby letters of credit, are issued to meet customer financing needs. The face amount for these items represents the exposure to loss before considering customer collateral or ability to repay. Such financial instruments are recorded when they are funded. Instruments such as stand-by letters of credit are considered financial guarantees in accordance with FASB ASC 460-10. The fair value of these financial guarantees is not material.
| Fair Value of Financial Instruments |
| Fair values of financial instruments are estimated using relevant market information and other assumptions, as more fully disclosed in Note 22. Fair value estimates involve uncertainties and matters of significant judgment regarding interest rates, credit risk, prepayments, and other factors, especially in the absence of broad markets for particular items. Changes in assumptions or in market conditions could significantly affect the estimates. |
| Comprehensive Income |
Comprehensive income consists of net income and other comprehensive income. Accumulated comprehensive income, which is recognized as a separate component of equity, includes unrealized gains and losses on securities available for sale.
| Advertising |
| Advertising costs are expensed as incurred. Advertising expense for the years ended December 31, 2012, 2011 and 2010 was $454,000, $406,000 and $313,000, respectively. Advertising typically consists of local print media aimed at businesses that the Company targets as well as sponsorships of local events that the Company’s clients and prospects are involved with. |
| 70 |
Recently Adopted Accounting Pronouncements
In April 2011, the FASB issued ASU No. 2011-03, Transfers and Servicing (Topic 860): Reconsideration of Effective Control for Repurchase Agreements, which removed from the assessment of effective control the criterion relating to the transferor’s ability to repurchase or redeem financial assets on substantially the agreed-upon terms, even in the event of default by the transferee. The amendments in this update also eliminated the requirement to demonstrate that the transferor possesses adequate collateral to fund substantially all the cost of purchasing replacement assets. The amendments in this update were effective for interim and annual periods beginning after December 31, 2011, with prospective application to transactions or modifications of existing transactions that occur on or after the effective date. Early adoption was not permitted. The Company adopted these amendments when required, and they did not have any effect on its financial position or results of operations.
In May 2011, the FASB issued ASU No. 2011-04, Fair Value Measurement (Topic 820): Amendments to Achieve Common Fair Value Measurement and Disclosure Requirements in U.S. GAAP and IFRS, which outlined the collaborative effort of the FASB and the International Accounting Standards Board (“IASB”) to consistently define fair value and to come up with a set of consistent disclosures for fair value. The amendments in this update explain how to measure fair value. They do not require additional fair value measurements and are not intended to establish valuation standards or affect valuation practices outside of financial reporting. The amendments in this update were to be applied prospectively. For public entities, the amendments were effective for interim and annual periods beginning after December 31, 2011. Early application was not permitted. The Company adopted these amendments when required, and they did not have a material effect on its financial position or results of operations.
In June 2011, the FASB issued ASU No. 2011-05, Comprehensive Income (Topic 220): Presentation of Comprehensive Income, which amended existing standards to allow an entity the option to present the total of comprehensive income, the components of net income, and the components of other comprehensive income either in a single continuous statement of comprehensive income or in two separate but consecutive statements. Under both options, an entity is required to present each component of net income along with total net income, each component of other comprehensive income along with a total for other comprehensive income, and a total amount for comprehensive income. Any changes pursuant to the options allowed in the amendments were to be applied retrospectively. For public entities, the amendments were effective for fiscal years, and interim periods within those years, beginning after December 15, 2011. Early adoption was permitted. This update had no impact on financial reporting of the Company.
In December 2011, the FASB issued ASU No. 2011-12, Comprehensive Income (Topic 220): Deferral of the Effective Date for Amendments to the Presentation of Reclassifications of Items Out of Accumulated Other Comprehensive Income in ASU No. 2011-05, which deferred the effective date pertaining to reclassification adjustments out of other accumulated comprehensive income in ASU 2011-05, until the FASB was able to reconsider those requirements. All other requirements of ASU 2011-05 were not affected by this update, including the requirement to report comprehensive income either in a single continuous financial statement or in two separate but consecutive financial statements. Public entities were to apply these requirements for fiscal years, and interim periods within those years, beginning after December 15, 2011, which coincide with the effective dates of the requirements in ASU 2011-05 amended by this update. This update, like ASU No. 2011-05, had no impact on financial reporting of the Company.
Recent Accounting Pronouncements
In December 2011, the FASB issued ASU No. 2011-11, Balance Sheet (Topic 210): Disclosures about Offsetting Assets and Liabilities, which amends disclosures by requiring improved information about financial instruments and derivative instruments that are either offset on the balance sheet or subject to an enforceable master netting arrangement or similar agreement, irrespective of whether they are offset on the balance sheet. Reporting entities are required to provide both net and gross information for these assets and liabilities in order to enhance comparability between those entities that prepare their financial statements on the basis of U.S. GAAP and those entities that prepare their financial statements on the basis of international financial reporting standards (“IFRS”). Companies are required to apply the amendments for fiscal years beginning on or after January 1, 2013, and interim periods within those years. Retrospective disclosures are required. The Company does not believe this update will have a material impact on its financial position or results of operations.
| 71 |
NOTE 2. DEBT SECURITIES
The amortized cost and fair value of available-for-sale and held-to-maturity securities at December 31, 2012 and 2011 are summarized as follows:
| Gross | Gross | |||||||||||||||
| Amortized | Unrealized | Unrealized | Market | |||||||||||||
| Cost | Gain | Loss | Value | |||||||||||||
| (In Thousands) | ||||||||||||||||
| December 31, 2012 | ||||||||||||||||
| Securities Available for Sale | ||||||||||||||||
| U.S. Treasury and government sponsored agencies | $ | 27,360 | $ | 1,026 | $ | - | $ | 28,386 | ||||||||
| Mortgage-backed securities | 69,298 | 4,168 | - | 73,466 | ||||||||||||
| State and municipal securities | 112,319 | 5,941 | (83 | ) | 118,177 | |||||||||||
| Corporate debt | 13,677 | 210 | (39 | ) | 13,848 | |||||||||||
| Total | 222,654 | 11,345 | (122 | ) | 233,877 | |||||||||||
| Securities Held to Maturity | ||||||||||||||||
| Mortgage-backed securities | 20,429 | 768 | (40 | ) | 21,157 | |||||||||||
| State and municipal securities | 5,538 | 655 | - | 6,193 | ||||||||||||
| Total | $ | 25,967 | $ | 1,423 | $ | (40 | ) | $ | 27,350 | |||||||
| December 31, 2011 | ||||||||||||||||
| Securities Available for Sale | ||||||||||||||||
| U.S. Treasury and government sponsored agencies | $ | 98,169 | $ | 1,512 | $ | (59 | ) | $ | 99,622 | |||||||
| Mortgage-backed securities | 88,118 | 4,462 | - | 92,580 | ||||||||||||
| State and municipal securities | 95,331 | 5,230 | (35 | ) | 100,526 | |||||||||||
| Corporate debt | 1,030 | 51 | - | 1,081 | ||||||||||||
| Total | 282,648 | 11,255 | (94 | ) | 293,809 | |||||||||||
| Securities Held to Maturity | ||||||||||||||||
| Mortgage-backed securities | 9,676 | 410 | - | 10,086 | ||||||||||||
| State and municipal securities | 5,533 | 380 | - | 5,913 | ||||||||||||
| Total | $ | 15,209 | $ | 790 | $ | - | $ | 15,999 | ||||||||
All mortgage-backed securities are with government sponsored enterprises (GSEs) such as Federal National Mortgage Association, Government National Mortgage Association, Federal Home Loan Bank, and Federal Home Loan Mortgage Corporation.
At year-end 2012 and 2011, there were no holdings of securities of any issuer, other than the U.S. government and its agencies, in an amount greater than 10% of stockholders’ equity.
The amortized cost and fair value of securities as of December 31, 2012 and 2011 by contractual maturity are shown below. Actual maturities may differ from contractual maturities because the issuers may have the right to call or prepay obligations with or without call or prepayment penalties.
| December 31, 2012 | December 31, 2011 | |||||||||||||||
| Amortized Cost | Market Value | Amortized Cost | Market Value | |||||||||||||
| (In Thousands) | ||||||||||||||||
| Securities available for sale | ||||||||||||||||
| Due within one year | $ | 11,971 | $ | 12,052 | $ | 10,664 | $ | 10,762 | ||||||||
| Due from one to five years | 79,192 | 81,940 | 112,488 | 114,227 | ||||||||||||
| Due from five to ten years | 59,825 | 63,801 | 65,509 | 69,864 | ||||||||||||
| Due after ten years | 2,368 | 2,618 | 5,868 | 6,376 | ||||||||||||
| Mortgage-backed securities | 69,298 | 73,466 | 88,118 | 92,580 | ||||||||||||
| $ | 222,654 | $ | 233,877 | $ | 282,647 | $ | 293,809 | |||||||||
| Securities held to maturity | ||||||||||||||||
| Due after ten years | $ | 5,538 | $ | 6,193 | $ | 5,533 | $ | 5,913 | ||||||||
| Mortgage-backed securities | 20,429 | 21,157 | 9,676 | 10,086 | ||||||||||||
| $ | 25,967 | $ | 27,350 | $ | 15,209 | $ | 15,999 | |||||||||
| 72 |
The following table shows the gross unrealized losses and fair value of securities, aggregated by category and length of time that securities have been in a continuous unrealized loss position at December 31, 2012 and 2011. In estimating other-than-temporary impairment losses, management considers, among other things, the length of time and the extent to which the fair value has been less than cost, the financial condition and near-term prospects of the issuer and the intent and ability of the Company to hold the security for a period of time sufficient to allow for any anticipated recovery in fair value. The unrealized losses shown in the following table are primarily due to increases in market rates over the yields available at the time of purchase of the underlying securities and not credit quality. Because the Company does not intend to sell these securities and it is more likely than not that the Company will not be required to sell the securities before recovery of their amortized cost basis, which may be maturity, the Company does not consider these securities to be other-than-temporarily impaired at December 31, 2012. There were no other-than-temporary impairments for the years ended December 31, 2012, 2011 and 2010.
| Less Than Twelve Months | Twelve Months or More | Total | ||||||||||||||||||||||
| Gross | Gross | Gross | ||||||||||||||||||||||
| Unrealized | Unrealized | Unrealized | ||||||||||||||||||||||
| Losses | Fair Value | Losses | Fair Value | Losses | Fair Value | |||||||||||||||||||
| (In Thousands) | ||||||||||||||||||||||||
| December 31, 2012 | ||||||||||||||||||||||||
| U.S. Treasury and government sponsored agencies | $ | - | $ | - | $ | - | $ | - | $ | - | $ | - | ||||||||||||
| Mortgage-backed securities | (40 | ) | 4,439 | - | - | (40 | ) | 4,439 | ||||||||||||||||
| State and municipal securities | (83 | ) | 8,801 | - | 166 | (83 | ) | 8,967 | ||||||||||||||||
| Corporate debt | (39 | ) | 4,882 | - | - | (39 | ) | 4,882 | ||||||||||||||||
| Total | $ | (162 | ) | $ | 18,122 | $ | - | $ | 166 | $ | (162 | ) | $ | 18,288 | ||||||||||
| December 31, 2011 | ||||||||||||||||||||||||
| U.S. Treasury and government sponsored agencies | $ | (59 | ) | $ | 15,074 | $ | - | $ | - | $ | (59 | ) | $ | 15,074 | ||||||||||
| Mortgage-backed securities | - | - | - | - | - | - | ||||||||||||||||||
| State and municipal securities | (35 | ) | 4,559 | - | - | (35 | ) | 4,559 | ||||||||||||||||
| Corporate debt | - | - | - | - | - | - | ||||||||||||||||||
| Total | $ | (94 | ) | $ | 19,633 | $ | - | $ | - | $ | (94 | ) | $ | 19,633 | ||||||||||
At December 31, 2012, only one of the Company’s 572 debt securities was in an unrealized loss position for more than 12 months.
During 2012, 10 government agency sponsored mortgage-backed securities with an amortized cost of $23.6 million and one government agency bond with an amortized cost of $1.5 million were bought. 15 government agency securities with a total amortized cost of $61.0 million were called during 2012, three U.S. Treasury securities with an amortized cost of $10.0 million matured. During 2011, 16 government agency bonds with an amortized cost of $63.2 million and 20 government agency sponsored mortgage-backed securities with an amortized cost of $29.9 million were bought. Nine U.S. Treasury notes, six government agency bonds and five government agency sponsored mortgage-backed securities were sold with an amortized cost of $56.1 million and a net gain on sale in the amount of $992,000. There were no sales of securities during 2012. During 2011, Losses on sales of securities of $326,000, netted against the gains above, resulted in net gain on sales of securities of $666,000 for the year. During 2010, bonds with a total amortized cost of $32.2 million were sold with total gains recognized in the amount of $108,000.
The carrying value of investment securities pledged to secure public funds on deposits and for other purposes as required by law as of December 31, 2012 and 2011 was $210.0 million and $197.9 million, respectively.
Restricted equity securities include (1) a restricted investment in Federal Home Loan Bank of Atlanta stock for membership requirement and to secure available lines of credit, and (2) an investment in First National Bankers Bank stock. The amount of investment in the Federal Home Loan Bank of Atlanta stock was $3.7 million and $3.3 million at December 31, 2012 and 2011, respectively. The amount of investment in the First National Bankers Bank stock was $250,000 at December 31, 2012 and 2011.
| 73 |
| NOTE 3. | LOANS |
The composition of loans at December 31, 2012 and 2011 is summarized as follows:
| December 31, | ||||||||
| 2012 | 2011 | |||||||
| (In Thousands) | ||||||||
| Commercial, financial and agricultural | $ | 1,030,990 | $ | 799,464 | ||||
| Real estate - construction | 158,361 | 151,218 | ||||||
| Real estate - mortgage: | ||||||||
| Owner-occupied commercial | 568,041 | 398,601 | ||||||
| 1-4 family mortgage | 235,909 | 205,182 | ||||||
| Other mortgage | 323,599 | 235,251 | ||||||
| Total real estate - mortgage | 1,127,549 | 839,034 | ||||||
| Consumer | 46,282 | 41,026 | ||||||
| Total Loans | 2,363,182 | 1,830,742 | ||||||
| Less: Allowance for loan losses | (26,258 | ) | (22,030 | ) | ||||
| Net Loans | $ | 2,336,924 | $ | 1,808,712 | ||||
Changes in the allowance for loan losses during the years ended December 31, 2012, 2011 and 2010, respectively are as follows:
| Years Ended December 31, | ||||||||||||
| 2012 | 2011 | 2010 | ||||||||||
| (In Thousands) | ||||||||||||
| Balance, beginning of year | $ | 22,030 | $ | 18,077 | $ | 14,737 | ||||||
| Loans charged off | (5,755 | ) | (5,653 | ) | (7,208 | ) | ||||||
| Recoveries | 883 | 634 | 198 | |||||||||
| Provision for loan losses | 9,100 | 8,972 | 10,350 | |||||||||
| Balance, end of year | $ | 26,258 | $ | 22,030 | $ | 18,077 | ||||||
The Company assesses the adequacy of its allowance for loan losses prior to the end of each calendar quarter. The level of the allowance is based on management’s evaluation of the loan portfolios, past loan loss experience, current asset quality trends, known and inherent risks in the portfolio, adverse situations that may affect the borrower’s ability to repay (including the timing of future payment), the estimated value of any underlying collateral, composition of the loan portfolio, economic conditions, industry and peer bank loan quality indications and other pertinent factors, including regulatory recommendations. This evaluation is inherently subjective as it requires material estimates including the amounts and timing of future cash flows expected to be received on impaired loans that may be susceptible to significant change. Loan losses are charged off when management believes that the full collectability of the loan is unlikely. A loan may be partially charged-off after a “confirming event” has occurred which serves to validate that full repayment pursuant to the terms of the loan is unlikely. Allocation of the allowance is made for specific loans, but the entire allowance is available for any loan that in management’s judgment deteriorates and is uncollectible. The portion of the reserve classified as qualitative factors, is management’s evaluation of potential future losses that would arise in the loan portfolio should management’s assumption about qualitative and environmental conditions materialize. This qualitative factor portion of the allowance for loan losses is based on management’s judgment regarding various external and internal factors including macroeconomic trends, management’s assessment of the Company’s loan growth prospects, and evaluations of internal risk controls.
The following table presents an analysis of the allowance for loan losses by portfolio segment as of December 31, 2012 and 2011. The total allowance for loan losses is disaggregated into those amounts associated with loans individually evaluated and those associated with loans collectively evaluated.
Changes in the allowance for loan losses, segregated by loan type, during the years ended December 31, 2012 and 2011, respectively, are as follows:
| 74 |
| Commercial, | ||||||||||||||||||||||||
| financial and | Real estate - | Real estate - | Qualitative | |||||||||||||||||||||
| agricultural | construction | mortgage | Consumer | Factors | Total | |||||||||||||||||||
| (In Thousands) | ||||||||||||||||||||||||
| Year Ended December 31, 2012 | ||||||||||||||||||||||||
| Allowance for loan losses: | ||||||||||||||||||||||||
| Balance at December 31, 2011 | $ | 6,627 | $ | 6,542 | $ | 3,295 | $ | 531 | $ | 5,035 | $ | 22,030 | ||||||||||||
| Chargeoffs | (1,106 | ) | (3,088 | ) | (660 | ) | (901 | ) | - | (5,755 | ) | |||||||||||||
| Recoveries | 125 | 58 | 692 | 8 | - | 883 | ||||||||||||||||||
| Provision | 2,587 | 2,999 | 1,585 | 561 | 1,368 | 9,100 | ||||||||||||||||||
| Balance at December 31, 2012 | $ | 8,233 | $ | 6,511 | $ | 4,912 | $ | 199 | $ | 6,403 | $ | 26,258 | ||||||||||||
| December 31, 2012 | ||||||||||||||||||||||||
| Individually Evaluated for Impairment | $ | 577 | $ | 1,013 | $ | 1,921 | $ | - | $ | - | $ | 3,511 | ||||||||||||
| Collectively Evaluated for Impairment | 7,656 | 5,498 | 2,991 | 199 | 6,403 | 22,747 | ||||||||||||||||||
| Loans: | ||||||||||||||||||||||||
| Ending Balance | $ | 1,030,990 | $ | 158,361 | $ | 1,127,549 | $ | 46,282 | $ | - | $ | 2,363,182 | ||||||||||||
| Individually Evaluated for Impairment | 3,910 | 14,422 | 18,927 | 135 | - | 37,394 | ||||||||||||||||||
| Collectively Evaluated for Impairment | 1,027,080 | 143,939 | 1,108,622 | 46,147 | - | 2,325,788 | ||||||||||||||||||
| Year Ended December 31, 2011 | ||||||||||||||||||||||||
| Allowance for loan losses: | ||||||||||||||||||||||||
| Balance at December 31, 2010 | $ | 5,348 | $ | 6,373 | $ | 2,443 | $ | 749 | $ | 3,164 | $ | 18,077 | ||||||||||||
| Chargeoffs | (1,096 | ) | (2,594 | ) | (1,096 | ) | (867 | ) | - | (5,653 | ) | |||||||||||||
| Recoveries | 361 | 180 | 12 | 81 | - | 634 | ||||||||||||||||||
| Provision | 2,014 | 2,583 | 1,936 | 568 | 1,871 | 8,972 | ||||||||||||||||||
| Balance at December 31, 2011 | $ | 6,627 | $ | 6,542 | $ | 3,295 | $ | 531 | $ | 5,035 | $ | 22,030 | ||||||||||||
| December 31, 2011 | ||||||||||||||||||||||||
| Individually Evaluated for Impairment | $ | 1,382 | $ | 1,533 | $ | 941 | $ | 325 | $ | - | $ | 4,181 | ||||||||||||
| Collectively Evaluated for Impairment | 5,245 | 5,009 | 2,354 | 206 | 5,035 | 17,849 | ||||||||||||||||||
| Loans: | ||||||||||||||||||||||||
| Ending Balance | $ | 799,464 | $ | 151,218 | $ | 839,034 | $ | 41,026 | $ | - | $ | 1,830,742 | ||||||||||||
| Individually Evaluated for Impairment | 5,578 | 16,262 | 14,866 | 547 | - | 37,253 | ||||||||||||||||||
| Collectively Evaluated for Impairment | 793,886 | 134,956 | 824,168 | 40,479 | - | 1,793,489 | ||||||||||||||||||
The credit quality of the loan portfolio is summarized no less frequently than quarterly using categories similar to the standard asset classification system used by the federal banking agencies. The following table presents credit quality indicators for the loan loss portfolio segments and classes. These categories are utilized to develop the associated allowance for loan losses using historical losses adjusted for current economic conditions defined as follows:
| · | Pass – loans which are well protected by the current net worth and paying capacity of the obligor (or obligors, if any) or by the fair value, less cost to acquire and sell, of any underlying collateral. |
| · | Special Mention – loans with potential weakness that may, if not reversed or corrected, weaken the credit or inadequately protect the Company’s position at some future date. These loans are not adversely classified and do not expose an institution to sufficient risk to warrant an adverse classification. |
| · | Substandard – loans that exhibit well-defined weakness or weaknesses that presently jeopardize debt repayment. These loans are characterized by the distinct possibility that the institution will sustain some loss if the weaknesses are not corrected. |
| · | Doubtful – loans that have all the weaknesses inherent in loans classified substandard, plus the added characteristic that the weaknesses make collection or liquidation in full on the basis of currently existing facts, conditions, and values highly questionable and improbable. |
| 75 |
Loans by credit quality indicator as of December 31, 2012 and 2011 were as follows:
| Special | ||||||||||||||||||||
| December 31, 2012 | Pass | Mention | Substandard | Doubtful | Total | |||||||||||||||
| (In Thousands) | ||||||||||||||||||||
| Commercial, financial and agricultural | $ | 1,004,043 | $ | 19,172 | $ | 7,775 | $ | - | $ | 1,030,990 | ||||||||||
| Real estate - construction | 121,168 | 22,771 | 14,422 | - | 158,361 | |||||||||||||||
| Real estate - mortgage: | ||||||||||||||||||||
| Owner-occupied commercial | 555,536 | 4,142 | 8,363 | - | 568,041 | |||||||||||||||
| 1-4 family mortgage | 223,152 | 6,379 | 6,378 | - | 235,909 | |||||||||||||||
| Other mortgage | 312,473 | 6,674 | 4,452 | - | 323,599 | |||||||||||||||
| Total real estate mortgage | 1,091,161 | 17,195 | 19,193 | - | 1,127,549 | |||||||||||||||
| Consumer | 46,076 | 71 | 135 | - | 46,282 | |||||||||||||||
| Total | $ | 2,262,448 | $ | 59,209 | $ | 41,525 | $ | - | $ | 2,363,182 | ||||||||||
| Special | ||||||||||||||||||||
| December 31, 2011 | Pass | Mention | Substandard | Doubtful | Total | |||||||||||||||
| (In Thousands) | ||||||||||||||||||||
| Commercial, financial and agricultural | $ | 780,270 | $ | 11,775 | $ | 7,419 | $ | - | $ | 799,464 | ||||||||||
| Real estate - construction | 117,244 | 14,472 | 19,502 | - | 151,218 | |||||||||||||||
| Real estate - mortgage: | ||||||||||||||||||||
| Owner-occupied commercial | 385,084 | 7,333 | 6,184 | - | 398,601 | |||||||||||||||
| 1-4 family mortgage | 194,447 | 4,835 | 5,900 | - | 205,182 | |||||||||||||||
| Other mortgage | 224,807 | 7,034 | 3,410 | - | 235,251 | |||||||||||||||
| Total real estate mortgage | 804,338 | 19,202 | 15,494 | - | 839,034 | |||||||||||||||
| Consumer | 40,353 | 96 | 577 | - | 41,026 | |||||||||||||||
| Total | $ | 1,742,205 | $ | 45,545 | $ | 42,992 | $ | - | $ | 1,830,742 | ||||||||||
| 76 |
Loans by performance status as of December 31, 2012 and 2011 are as follows:
| December 31, 2012 | Performing | Nonperforming | Total | |||||||||
| (In Thousands) | ||||||||||||
| Commercial, financial and agricultural | $ | 1,030,714 | $ | 276 | $ | 1,030,990 | ||||||
| Real estate - construction | 151,901 | 6,460 | 158,361 | |||||||||
| Real estate - mortgage: | ||||||||||||
| Owner-occupied commercial | 565,255 | 2,786 | 568,041 | |||||||||
| 1-4 family mortgage | 235,456 | 453 | 235,909 | |||||||||
| Other mortgage | 323,359 | 240 | 323,599 | |||||||||
| Total real estate mortgage | 1,124,070 | 3,479 | 1,127,549 | |||||||||
| Consumer | 46,139 | 143 | 46,282 | |||||||||
| Total | $ | 2,352,824 | $ | 10,358 | $ | 2,363,182 | ||||||
| December 31, 2011 | Performing | Nonperforming | Total | |||||||||
| (In Thousands) | ||||||||||||
| Commercial, financial and agricultural | $ | 798,285 | $ | 1,179 | $ | 799,464 | ||||||
| Real estate - construction | 141,155 | 10,063 | 151,218 | |||||||||
| Real estate - mortgage: | ||||||||||||
| Owner-occupied commercial | 397,809 | 792 | 398,601 | |||||||||
| 1-4 family mortgage | 204,512 | 670 | 205,182 | |||||||||
| Other mortgage | 234,558 | 693 | 235,251 | |||||||||
| Total real estate mortgage | 836,879 | 2,155 | 839,034 | |||||||||
| Consumer | 40,651 | 375 | 41,026 | |||||||||
| Total | $ | 1,816,970 | $ | 13,772 | $ | 1,830,742 | ||||||
| 77 |
Loans by past due status as of December 31, 2012 and 2011 are as follows:
| December 31, 2012 | Past Due Status (Accruing Loans) | |||||||||||||||||||||||||||
| Total Past | ||||||||||||||||||||||||||||
| 30-59 Days | 60-89 Days | 90+ Days | Due | Non-Accrual | Current | Total Loans | ||||||||||||||||||||||
| (In Thousands) | ||||||||||||||||||||||||||||
| Commercial, financial and agricultural | $ | 1,699 | $ | 385 | $ | - | $ | 2,084 | $ | 276 | $ | 1,028,630 | $ | 1,030,990 | ||||||||||||||
| Real estate - construction | - | - | - | - | 6,460 | 151,901 | 158,361 | |||||||||||||||||||||
| Real estate - mortgage: | ||||||||||||||||||||||||||||
| Owner-occupied commercial | 1,480 | 10 | - | 1,490 | 2,786 | 563,765 | 568,041 | |||||||||||||||||||||
| 1-4 family mortgage | 420 | 16 | - | 436 | 453 | 235,020 | 235,909 | |||||||||||||||||||||
| Other mortgage | 516 | - | - | 516 | 240 | 322,843 | 323,599 | |||||||||||||||||||||
| Total real estate - | ||||||||||||||||||||||||||||
| mortgage | 2,416 | 26 | - | 2,442 | 3,479 | 1,121,628 | 1,127,549 | |||||||||||||||||||||
| Consumer | 108 | - | 8 | 116 | 135 | 46,031 | 46,282 | |||||||||||||||||||||
| Total | $ | 4,223 | $ | 411 | $ | 8 | $ | 4,642 | $ | 10,350 | $ | 2,348,190 | $ | 2,363,182 | ||||||||||||||
| December 31, 2011 | Past Due Status (Accruing Loans) | |||||||||||||||||||||||||||
| Total Past | ||||||||||||||||||||||||||||
| 30-59 Days | 60-89 Days | 90+ Days | Due | Non-Accrual | Current | Total Loans | ||||||||||||||||||||||
| (In Thousands) | ||||||||||||||||||||||||||||
| Commercial, financial and agricultural | $ | - | $ | - | $ | - | $ | - | $ | 1,179 | $ | 798,285 | $ | 799,464 | ||||||||||||||
| Real estate - construction | 2,234 | - | - | 2,234 | 10,063 | 138,921 | 151,218 | |||||||||||||||||||||
| Real estate - mortgage: | ||||||||||||||||||||||||||||
| Owner-occupied commercial | - | - | - | - | 792 | 397,809 | 398,601 | |||||||||||||||||||||
| 1-4 family mortgage | 2,107 | - | - | 2,107 | 670 | 202,405 | 205,182 | |||||||||||||||||||||
| Other mortgage | - | - | - | - | 693 | 234,558 | 235,251 | |||||||||||||||||||||
| Total real estate - mortgage | 2,107 | - | - | 2,107 | 2,155 | 834,772 | 839,034 | |||||||||||||||||||||
| Consumer | - | 84 | - | 84 | 375 | 40,567 | 41,026 | |||||||||||||||||||||
| Total | $ | 4,341 | $ | 84 | $ | - | $ | 4,425 | $ | 13,772 | $ | 1,812,545 | $ | 1,830,742 | ||||||||||||||
| 78 |
The following table presents details of the Company’s impaired loans as of December 31, 2012 and 2011, respectively. Loans which have been fully charged off do not appear in the tables.
| December 31, 2012 | ||||||||||||||||||||
| Unpaid | Average | Interest Income | ||||||||||||||||||
| Recorded | Principal | Related | Recorded | Recognized | ||||||||||||||||
| Investment | Balance | Allowance | Investment | in Period | ||||||||||||||||
| (In Thousands) | ||||||||||||||||||||
| With no allowance recorded: | ||||||||||||||||||||
| Commercial, financial and agricultural | $ | 2,602 | $ | 2,856 | $ | - | $ | 2,313 | $ | 105 | ||||||||||
| Real estate - construction | 6,872 | 7,894 | - | 7,631 | 188 | |||||||||||||||
| Real estate - mortgage: | ||||||||||||||||||||
| Owner-occupied commercial | 5,111 | 5,361 | - | 5,411 | 145 | |||||||||||||||
| 1-4 family mortgage | 2,166 | 2,388 | - | 2,177 | 108 | |||||||||||||||
| Other mortgage | 4,151 | 4,249 | - | 4,206 | 275 | |||||||||||||||
| Total real estate - mortgage | 11,428 | 11,998 | - | 11,794 | 528 | |||||||||||||||
| Consumer | 135 | 344 | - | 296 | 6 | |||||||||||||||
| Total with no allowance recorded | 21,037 | 23,092 | - | 22,034 | 827 | |||||||||||||||
| With an allowance recorded: | ||||||||||||||||||||
| Commercial, financial and agricultural | 1,308 | 1,308 | 577 | 1,325 | 90 | |||||||||||||||
| Real estate - construction | 7,550 | 8,137 | 1,013 | 6,961 | 154 | |||||||||||||||
| Real estate - mortgage: | ||||||||||||||||||||
| Owner-occupied commercial | 3,195 | 3,195 | 779 | 3,277 | 77 | |||||||||||||||
| 1-4 family mortgage | 4,002 | 4,002 | 1,007 | 4,001 | 139 | |||||||||||||||
| Other mortgage | 302 | 302 | 135 | 307 | 20 | |||||||||||||||
| Total real estate - mortgage | 7,499 | 7,499 | 1,921 | 7,585 | 236 | |||||||||||||||
| Consumer | - | - | - | - | - | |||||||||||||||
| Total with allowance recorded | 16,357 | 16,944 | 3,511 | 15,871 | 480 | |||||||||||||||
| Total Impaired Loans: | ||||||||||||||||||||
| Commercial, financial and agricultural | 3,910 | 4,164 | 577 | 3,638 | 195 | |||||||||||||||
| Real estate - construction | 14,422 | 16,031 | 1,013 | 14,592 | 342 | |||||||||||||||
| Real estate - mortgage: | ||||||||||||||||||||
| Owner-occupied commercial | 8,306 | 8,556 | 779 | 8,688 | 222 | |||||||||||||||
| 1-4 family mortgage | 6,168 | 6,390 | 1,007 | 6,178 | 247 | |||||||||||||||
| Other mortgage | 4,453 | 4,551 | 135 | 4,513 | 295 | |||||||||||||||
| Total real estate - mortgage | 18,927 | 19,497 | 1,921 | 19,379 | 764 | |||||||||||||||
| Consumer | 135 | 344 | - | 296 | 6 | |||||||||||||||
| Total impaired loans | $ | 37,394 | $ | 40,036 | $ | 3,511 | $ | 37,905 | $ | 1,307 | ||||||||||
| 79 |
| December 31, 2011 | ||||||||||||||||||||
| Unpaid | Average | Interest Income | ||||||||||||||||||
| Recorded | Principal | Related | Recorded | Recognized in | ||||||||||||||||
| Investment | Balance | Allowance | Investment | Period | ||||||||||||||||
| (In Thousands) | ||||||||||||||||||||
| With no allowance recorded: | ||||||||||||||||||||
| Commercial, financial and agricultural | $ | 1,264 | $ | 1,264 | $ | - | $ | 1,501 | $ | 74 | ||||||||||
| Real estate - construction | 11,583 | 12,573 | - | 10,406 | 226 | |||||||||||||||
| Owner-occupied commercial | 2,493 | 2,493 | - | 2,523 | 153 | |||||||||||||||
| 1-4 family mortgage | 1,293 | 1,293 | - | 1,241 | 44 | |||||||||||||||
| Other mortgage | 2,837 | 2,837 | - | 2,746 | 162 | |||||||||||||||
| Total real estate - mortgage | 6,623 | 6,623 | - | 6,510 | 359 | |||||||||||||||
| Consumer | 173 | 173 | - | 173 | 6 | |||||||||||||||
| Total with no allowance recorded | 19,643 | 20,633 | - | 18,590 | 665 | |||||||||||||||
| With an allowance recorded: | ||||||||||||||||||||
| Commercial, financial and agricultural | 4,314 | 4,314 | 1,382 | 4,156 | 226 | |||||||||||||||
| Real estate - construction | 4,679 | 4,679 | 1,482 | 3,987 | 94 | |||||||||||||||
| Real estate - mortgage: | ||||||||||||||||||||
| Owner-occupied commercial | 3,515 | 3,515 | 88 | 3,504 | 365 | |||||||||||||||
| 1-4 family mortgage | 4,397 | 4,397 | 904 | 4,484 | 198 | |||||||||||||||
| Other mortgage | 331 | 331 | - | 337 | 22 | |||||||||||||||
| Total real estate - mortgage | 8,243 | 8,243 | 992 | 8,325 | 585 | |||||||||||||||
| Consumer | 374 | 624 | 325 | 425 | - | |||||||||||||||
| Total with allowance recorded | 17,610 | 17,860 | 4,181 | 16,893 | 905 | |||||||||||||||
| Total Impaired Loans: | ||||||||||||||||||||
| Commercial, financial and agricultural | 5,578 | 5,578 | 1,382 | 5,657 | 300 | |||||||||||||||
| Real estate - construction | 16,262 | 17,252 | 1,482 | 14,393 | 320 | |||||||||||||||
| Real estate - mortgage: | ||||||||||||||||||||
| Owner-occupied commercial | 6,008 | 6,008 | 88 | 6,027 | 518 | |||||||||||||||
| 1-4 family mortgage | 5,690 | 5,690 | 904 | 5,725 | 242 | |||||||||||||||
| Other mortgage | 3,168 | 3,168 | - | 3,083 | 184 | |||||||||||||||
| Total real estate - mortgage | 14,866 | 14,866 | 992 | 14,835 | 944 | |||||||||||||||
| Consumer | 547 | 797 | 325 | 598 | 6 | |||||||||||||||
| Total impaired loans | $ | 37,253 | $ | 38,493 | $ | 4,181 | $ | 35,483 | $ | 1,570 | ||||||||||
Troubled Debt Restructurings (“TDR”) at December 31, 2012 and 2011 totaled $12.3 million and $4.5 million, respectively. The increase for the year primarily consists of two relationships that were added in the first and third quarters of 2012. At December 31, 2012, the Company had a related allowance for loan losses of $1,442,000 allocated to these TDRs, compared to $439,000 at December 31, 2011. The Company had three TDR loans to one borrower in the amount of $2.8 million enter into payment default status during the first quarter of 2012. The assets securing these loans are under a letter of intent to sell at a purchase price that is expected to be sufficient to pay the full principal owed. The final contract is still in negotiation. All other loans classified as TDRs as of December 31, 2012 are performing as agreed under the terms of their restructured plans. The following table presents an analysis of TDRs as of December 31, 2012 and 2011.
| 80 |
| December 31, 2012 | December 31, 2011 | |||||||||||||||||||||||
| Pre- | Post- | Pre- | Post- | |||||||||||||||||||||
| Modification | Modification | Modification | Modification | |||||||||||||||||||||
| Outstanding | Outstanding | Outstanding | Outstanding | |||||||||||||||||||||
| Number of | Recorded | Recorded | Number of | Recorded | Recorded | |||||||||||||||||||
| Contracts | Investment | Investment | Contracts | Investment | Investment | |||||||||||||||||||
| (In Thousands) | ||||||||||||||||||||||||
| Troubled Debt Restructurings | ||||||||||||||||||||||||
| Commercial, financial and agricultural | 2 | $ | 1,168 | $ | 1,168 | 2 | $ | 1,369 | $ | 1,369 | ||||||||||||||
| Real estate - construction | 15 | 3,213 | 3,213 | - | - | - | ||||||||||||||||||
| Real estate - mortgage: | ||||||||||||||||||||||||
| Owner-occupied commercial | 3 | 3,121 | 3,121 | 3 | 2,785 | 2,785 | ||||||||||||||||||
| 1-4 family mortgage | 5 | 1,709 | 1,709 | - | - | - | ||||||||||||||||||
| Other mortgage | 1 | 302 | 302 | 1 | 331 | 331 | ||||||||||||||||||
| Total real estate mortgage | 9 | 5,132 | 5,132 | 4 | 3,116 | 3,116 | ||||||||||||||||||
| Consumer | - | - | - | - | - | - | ||||||||||||||||||
| 26 | $ | 9,513 | $ | 9,513 | 6 | $ | 4,485 | $ | 4,485 | |||||||||||||||
| Number of | Recorded | Number of | Recorded | |||||||||||||||||||||
| Contracts | Investment | Contracts | Investment | |||||||||||||||||||||
| Troubled Debt Restructurings | ||||||||||||||||||||||||
| That Subsequently Defaulted Commercial, financial and agricultural | - | $ | - | - | $ | - | ||||||||||||||||||
| Real estate - construction | - | - | - | - | ||||||||||||||||||||
| Real estate - mortgage: | ||||||||||||||||||||||||
| Owner-occupied commercial | 3 | 2,786 | - | - | ||||||||||||||||||||
| 1-4 family mortgage | - | - | - | - | ||||||||||||||||||||
| Other mortgage | - | - | - | - | ||||||||||||||||||||
| Total real estate - mortgage | 3 | 2,786 | - | - | ||||||||||||||||||||
| Consumer | - | - | - | - | ||||||||||||||||||||
| 3 | $ | 2,786 | - | $ | - | |||||||||||||||||||
In the ordinary course of business, the Company has granted loans to certain related parties, including directors, and their affiliates. The interest rates on these loans were substantially the same as rates prevailing at the time of the transaction and repayment terms are customary for the type of loan. Changes in related party loans for the years ended December 31, 2012 and 2011 are as follows:
| Years Ended December 31, | ||||||||
| 2012 | 2011 | |||||||
| (In Thousands) | ||||||||
| Balance, beginning of year | $ | 9,047 | $ | 6,825 | ||||
| Advances | 7,630 | 7,926 | ||||||
| Repayments | (8,096 | ) | (4,204 | ) | ||||
| Participations | 3,819 | (1,500 | ) | |||||
| Balance, end of year | $ | 12,400 | $ | 9,047 | ||||
| NOTE 4. | FORECLOSED PROPERTIES |
Other real estate and certain other assets acquired in foreclosure are carried at the lower of the recorded investment in the loan or fair value less estimated costs to sell the property.
| 81 |
An analysis of foreclosed properties for the years ended December 31, 2012, 2011 and 2010 follows:
| 2012 | 2011 | 2010 | ||||||||||
| Balance at beginning of year | $ | 12,275 | $ | 6,966 | $ | 12,525 | ||||||
| Transfers from loans and capitalized expenses | 2,695 | 9,029 | 5,447 | |||||||||
| Foreclosed properties sold | (2,967 | ) | (3,334 | ) | (7,995 | ) | ||||||
| Writedowns and partial liquidations | (2,318 | ) | (386 | ) | (3,011 | ) | ||||||
| Balance at end of year | $ | 9,685 | $ | 12,275 | $ | 6,966 | ||||||
| NOTE 5. | PREMISES AND EQUIPMENT |
Premises and equipment are summarized as follows:
| December 31, | ||||||||
| 2012 | 2011 | |||||||
| (In Thousands) | ||||||||
| Land and building | $ | 1,724 | $ | - | ||||
| Furniture and equipment | 8,642 | 5,224 | ||||||
| Leasehold improvements | 4,742 | 4,436 | ||||||
| 15,108 | 9,660 | |||||||
| Accumulated depreciation | (6,261 | ) | (5,069 | ) | ||||
| $ | 8,847 | $ | 4,591 | |||||
The provisions for depreciation charged to occupancy and equipment expense for the years ended December 31, 2012, 2011 and 2010 were $1,218,000, $1,173,000 and $1,066,000, respectively.
The Company leases land and building space under non-cancellable operating leases. Future minimum lease payments under non-cancellable operating leases are summarized as follows:
| (In Thousands) | ||||
| 2012 | $ | 2,068 | ||
| 2013 | 1,955 | |||
| 2014 | 1,945 | |||
| 2015 | 1,974 | |||
| 2016 | 1,934 | |||
| Thereafter | 7,201 | |||
| $ | 17,077 | |||
For the years ended December 31, 2012, 2011 and 2010, annual rental expense on operating leases was $2,195,000, $2,060,000 and $1,734,000, respectively.
| NOTE 6. | VARIABLE INTEREST ENTITIES (VIEs) |
The Company utilizes special purpose entities (SPEs) that constitute investments in limited partnerships that undertake certain development projects to achieve federal and state tax credits. These SPEs are typically structured as VIEs and are thus subject to consolidation by the reporting enterprise that absorbs the majority of the economic risks and rewards of the VIE. To determine whether it must consolidate a VIE, the Company analyzes the design of the VIE to identify the sources of variability within the VIE, including an assessment of the nature of risks created by the assets and other contractual obligations of the VIE, and determines whether it will absorb a majority of that variability.
The Company has invested in a limited partnership for which it determined it is not the primary beneficiary, and which thus is not subject to consolidation by the Company. The Company reports its investment in this partnership at its net realizable value, estimated to be the discounted value of the remaining amount of tax credits to be received. The amount recorded as investment in this partnership at December 31, 2012 and 2011 was $313,000 and $504,000, respectively, and is included in other assets.
| 82 |
On December 31, 2009, the Company entered into a limited partnership as funding investor. The partnership is a single purpose entity that is lending money to a real estate investor for the purpose of acquiring and operating a multi-tenant office building. The investment qualifies for New Market Tax Credits under Internal Revenue Code Section 45D, as amended. The Company has determined that it is the primary beneficiary of the economic risks and rewards of the VIE, and thus has consolidated the partnership’s assets and liabilities into its consolidated financial statements. The amount recorded as an investment in this partnership at December 31, 2012 and 2011 was $3,192,000 and $3,403,000, respectively, of which $2,270,000 in 2012 and 2011 is included in loans of the Company. The remaining amounts are included in other assets.
| NOTE 7. | DEPOSITS |
Deposits at December 31, 2012 and 2011 were as follows:
| December 31, | ||||||||
| 2012 | 2011 | |||||||
| (In Thousands) | ||||||||
| Noninterest-bearing demand | $ | 545,174 | $ | 418,810 | ||||
| Interest-bearing checking | 1,551,158 | 1,325,451 | ||||||
| Savings | 19,560 | 15,638 | ||||||
| Time | 69,179 | 71,368 | ||||||
| Time, $100,000 and over | 326,501 | 312,620 | ||||||
| $ | 2,511,572 | $ | 2,143,887 | |||||
The scheduled maturities of time deposits at December 31, 2012 were as follows:
| (In Thousands) | ||||
| 2013 | $ | 247,482 | ||
| 2014 | 87,433 | |||
| 2015 | 21,167 | |||
| 2016 | 26,437 | |||
| 2017 | 13,161 | |||
| $ | 395,680 | |||
At December 31, 2012 and 2011, overdraft deposits reclassified to loans were $3,860,000 and $876,000, respectively.
| NOTE 8. | FEDERAL FUNDS PURCHASED |
At December 31, 2012, The Company had $117.1 million in federal funds purchased from its respondent banks that are clients of its correspondent banking unit, compared to $79.3 million at December 31, 2011. The Company was paying an interest rate of 0.25% on these balances at December 31, 2012.
At December 31, 2012, the Company had available lines of credit totaling approximately $130 million with various financial institutions for borrowing on a short-term basis, with no amount outstanding. Available lines with these same banks totaled approximately $140 million at December 31, 2011. These lines are subject to annual renewals with varying interest rates.
| NOTE 9. | OTHER BORROWINGS |
Other borrowings of $19.9 million are comprised of the Company’s 5.5% Subordinated Notes due November 9, 2022, which were issued in a private placement in November 2012. The notes pay interest semi-annually.
On June 1, 2012, the Company paid off its 8.25% Subordinated Note due June 1, 2016 in the aggregate principal amount of $5 million. This note was payable to one accredited investor and was issued on June 23, 2009.
On November 8, 2012, the Company redeemed all of its outstanding 8.5% Junior Subordinated Deferrable Interest Debentures due 2038, which were held by ServisFirst Capital Trust I. As a result, all of the outstanding 8.5% Trust Preferred Securities and 8.5% Common Securities of the Trust were redeemed. The redemption price for the Trust Preferred Securities was $1,000 per security, for a total principal amount of $15 million, plus accrued distributions up to the redemption date. The Junior Subordinated Debentures were originally issued on September 2, 2008, and in accordance with their terms, were subject to option redemption by the Company on or after September 1, 2011. Pursuant to the terms of its Amended and Restated Trust Agreement, ServisFirst Capital Trust I is required to use the proceeds it receives from the redemption of the Junior Subordinated Debentures to redeem its Trust Preferred Securities and 8.5% Common Securities on the same day.
| 83 |
The Company prepaid both of its advances from Federal Home Loan Bank (“FHLB”) during 2011, one in March and the other in June. Prepayment penalties of $738,000 were paid to the FHLB as part of these prepayments, and is included in other operating expenses.
| NOTE 10. | SF HOLDING 1, INC. AND SF REALTY 1, INC. |
In January 2012, the Company formed SF Holding 1, Inc., an Alabama corporation, and its subsidiary, SF Realty 1, Inc., an Alabama corporation. SF Realty 1 elected to be treated as a real estate investment trust (“REIT”) for U.S. income tax purposes. SF Realty 1 holds and manages participations in residential mortgages and commercial real estate loans originated by ServisFirst Bank. SF Holding 1, Inc. and SF Realty 1, Inc. are both consolidated into the Company.
| NOTE 11. | PARTICIPATION IN THE SMALL BUSINESS LENDING FUND OF THE U.S. TREASURY DEPARTMENT |
On June 21, 2011, the Company entered into a Securities Purchase Agreement with the Secretary of the Treasury, pursuant to which the Company issued and sold to the Treasury 40,000 shares of its Senior Non-Cumulative Perpetual Preferred Stock, Series A, having a liquidation preference of $1,000 per share (the “Series A Preferred Stock”), for aggregate proceeds of $40,000,000. The issuance was pursuant to the Treasury’s Small Business Lending Fund program, a $30 billion fund established under the Small Business Jobs Act of 2010, which encourages lending to small businesses by providing capital to qualified community banks with assets of less than $10 billion. The Series A Preferred Stock is entitled to receive non-cumulative dividends payable quarterly on each January 1, April 1, July 1 and October 1, commencing October 1, 2011. The dividend rate, which is calculated on the aggregate Liquidation Amount, has been initially set at 1% per annum based upon the current level of “Qualified Small Business Lending” (“QSBL”) by the Bank. The dividend rate for future dividend periods will be set based upon the percentage change in qualified lending between each dividend period and the baseline QSBL level established at the time the Agreement was entered into. Such dividend rate may vary from 1% per annum to 5% per annum for the second through tenth dividend periods, and from 1% per annum to 7% per annum for the eleventh through the first half of the nineteenth dividend periods. If the Series A Preferred Stock remains outstanding for more than four-and-one-half years, the dividend rate will be fixed at 9%. Prior to that time, in general, the dividend rate decreases as the level of the Bank’s QSBL increases. Such dividends are not cumulative, but the Company may only declare and pay dividends on its common stock (or any other equity securities junior to the Series A Preferred Stock) if it has declared and paid dividends for the current dividend period on the Series A Preferred Stock, and will be subject to other restrictions on its ability to repurchase or redeem other securities. In addition, if (i) the Company has not timely declared and paid dividends on the Series A Preferred Stock for six dividend periods or more, whether or not consecutive, and (ii) shares of Series A Preferred Stock with an aggregate liquidation preference of at least $25,000,000 are still outstanding, the Treasury (or any successor holder of Series A Preferred Stock) may designate two additional directors to be elected to the Company’s Board of Directors.
As is more completely described in the Certificate of Designation, holders of the Series A Preferred Stock have the right to vote as a separate class on certain matters relating to the rights of holders of Series A Preferred Stock and on certain corporate transactions. Except with respect to such matters and, if applicable, the election of the additional directors described above, the Series A Preferred Stock does not have voting rights.
The Company may redeem the shares of Series A Preferred Stock, in whole or in part, at any time at a redemption price equal to the sum of the Liquidation Amount per share and the per-share amount of any unpaid dividends for the then-current period, subject to any required prior approval by the Company’s primary federal banking regulator.
| NOTE 12. | DERIVATIVES |
During 2008, the Company entered into interest rate swaps (“swaps”) to facilitate customer transactions and meet customer financing needs. Upon entering into these swaps, the Company entered into offsetting positions with a regional correspondent bank in order to minimize the risk to the Company. As of December 31, 2012, the Company was party to two swaps with notional amounts totaling approximately $11.1 million with customers and two swaps with notional amounts totaling approximately $11.1 million with a regional correspondent bank. These swaps qualify as derivatives, but are not designated as hedging instruments. The Company has recorded the value of these swaps at $490,000 in offsetting entries in other assets and other liabilities.
| 84 |
The Company has entered into agreements with secondary market investors to deliver loans on a “best efforts delivery” basis. When a rate is committed to a borrower, it is based on the best price that day and locked with the investor for the customer for a 30-day period. In the event the loan is not delivered to the investor, the Company has no risk or exposure with the investor. The interest rate lock commitments related to loans that are originated for later sale are classified as derivatives. The fair values of the Company’s agreements with investors and rate lock commitments to customers as of December 31, 2012 and December 31, 2011 were not material.
| NOTE 13. | EMPLOYEE AND DIRECTOR BENEFITS |
At December 31, 2012, the Company has two stock-based compensation plans, which are described below. The compensation cost that has been charged against income for the plans was approximately $1,049,000, $975,000 and $713,000 for the years ended December 31, 2012, 2011 and 2010, respectively.
Stock Incentive Plans
The Company’s 2005 Stock Incentive Plan (the “2005 Plan”), originally permitted the grant of stock options to its officers, employees, directors and organizers of the Company for up to 525,000 shares of common stock. However, upon stockholder approval during 2006, the 2005 Plan was amended in order to allow the Company to grant stock options for up to 1,025,000 shares of common stock. Both incentive stock options and non-qualified stock options may be granted under the 2005 Plan. Option awards are generally granted with an exercise price equal to the estimated fair market value of the Company’s stock at the date of grant; those option awards vest in varying amounts from 2007 through 2015 and are based on continuous service during that vesting period and have a ten-year contractual term. Dividends are not paid on unexercised options and dividends are not subject to vesting. The 2005 Plan provides for accelerated vesting if there is a change in control (as defined in the 2005 Plan).
On March 23, 2009, the Company’s board of directors adopted the 2009 Stock Incentive Plan (the “2009 Plan”), which was effective upon approval by the stockholders at the 2009 Annual Meeting of Stockholders. The 2009 Plan authorizes the grant of stock appreciation rights, restricted stock, stock options, non-stock share equivalents, performance shares or performance units and other equity-based awards.
Both incentive stock options and non-qualified stock options may be granted under the 2009 Plan. Option awards are generally granted with an exercise price equal to the estimated fair market value of the Company’s stock at the date of grant. Up to 425,000 shares of common stock of the Company are available for awards under the 2009 Plan.
As of December 31, 2012, there are a total of 257,000 shares available to be granted under both of these plans.
On September 21, 2006, we granted non-plan stock options to persons representing certain key business relationships to purchase up to an aggregate of 30,000 shares of our common stock for a purchase price of $15.00 per share. On November 2, 2007, we granted non-plan stock options to persons representing certain key business relationships to purchase up to an aggregate of 25,000 shares of our common stock for a purchase price of $20.00 per share. These stock options are non-qualified and are not part of either of our stock incentive plans. They vested 100% in a lump sum five years after their date of grant and expire 10 years after their date of grant.
The fair value of each stock option award is estimated on the date of grant using a Black-Scholes-Merton valuation model that uses the assumptions noted in the following table. Expected volatilities are based on an index of approximately 79 publicly traded banks in the southeast United States. The expected term of options granted is based on the short-cut method and represents the period of time that options granted are expected to be outstanding. The risk-free rate for periods within the contractual life of the option is based on the U.S. Treasury yield curve in effect at the time of grant.
| 2012 | 2011 | 2010 | ||||||||||
| Expected volatility | 19.80 | % | 26.50 | % | 26.00 | % | ||||||
| Expected dividends | - | % | 0.37 | % | - | % | ||||||
| Expected term (in years) | 6.5 | 6.5 | 7.0 | |||||||||
| Risk-free rate | 1.05 | % | 2.21 | % | 2.10 | % | ||||||
| 85 |
The weighted average grant-date fair value of options granted during the years ended December 31, 2012, December 31, 2011 and December 31, 2010 was $6.59, $7.82 and $7.91, respectively.
The following tables summarize stock option activity.:
| Shares | Weighted Average Exercise Price | Weighted Average Remaining Contractual Term (years) | Aggregate Intrinsic Value | |||||||||||||
| (In Thousands) | ||||||||||||||||
| Year Ended December 31, 2012: | ||||||||||||||||
| Outstanding at beginning of year | 1,073,800 | $ | 18.33 | 6.0 | $ | 12,508 | ||||||||||
| Granted | 45,500 | 30.00 | 9.3 | 130 | ||||||||||||
| Exercised | (288,130 | ) | 12.71 | 2.4 | 5,846 | |||||||||||
| Forfeited | (14,670 | ) | 24.54 | - | - | |||||||||||
| Outstanding at end of year | 816,500 | $ | 20.87 | 5.8 | $ | 9,905 | ||||||||||
| Exercisable at December 31, 2012 | 412,825 | $ | 14.03 | 3.6 | $ | 7,831 | ||||||||||
| Year Ended December 31, 2011: | ||||||||||||||||
| Outstanding at beginning of year | 881,000 | $ | 15.65 | 6.9 | $ | 8,238 | ||||||||||
| Granted | 233,500 | 27.16 | 9.3 | - | ||||||||||||
| Exercised | (40,700 | ) | 10.53 | 3.8 | 792 | |||||||||||
| Forfeited | - | 15.00 | - | - | ||||||||||||
| Outstanding at end of year | 1,073,800 | $ | 18.33 | 6.0 | $ | 12,508 | ||||||||||
| Exercisable at December 31, 2011 | 442,940 | $ | 13.19 | 4.4 | $ | 7,447 | ||||||||||
| Year Ended December 31, 2010: | ||||||||||||||||
| Outstanding at beginning of year | 863,500 | $ | 15.17 | 6.8 | $ | 8,483 | ||||||||||
| Granted | 37,500 | 25.00 | 9.4 | - | ||||||||||||
| Exercised | (10,000 | ) | 10.00 | - | 150 | |||||||||||
| Forfeited | (10,000 | ) | 15.00 | - | - | |||||||||||
| Outstanding at end of year | 881,000 | $ | 15.65 | 6.9 | $ | 8,238 | ||||||||||
| Exercisable at December 31, 2010 | 272,627 | $ | 11.96 | 5.1 | $ | 3,555 | ||||||||||
Exercisable options at December 31, 2012 were as follows:
| Range of Exercise Price | Shares | Weighted Average Exercise Price | Weighted Average Remaining Contractual Term (years) | Aggregate Intrinsic Value | ||||||||||||||
| (In Thousands) | ||||||||||||||||||
| $ | 10.00 | 106,500 | $ | 10.00 | 2.4 | $ | 2,450 | |||||||||||
| 11.00 | 119,500 | 11.00 | 3.3 | 2,629 | ||||||||||||||
| 15.00 | 101,830 | 15.00 | 3.9 | 1,833 | ||||||||||||||
| 20.00 | 47,995 | 20.00 | 4.8 | 624 | ||||||||||||||
| 25.00 | 37,000 | 25.00 | 5.7 | 296 | ||||||||||||||
| 412,825 | $ | 14.03 | 3.6 | $ | 7,832 | |||||||||||||
| 86 |
As of December 31, 2012, there was $1,795,000 of total unrecognized compensation cost related to non-vested stock options. The cost is expected to be recognized on the straight-line method over the next 2.1 years. The total fair value of shares vested during the year ended December 31, 2012 was $404,000.
Restricted Stock
The Company has issued restricted stock, and currently has 20,500 non-vested shares issued. The value of restricted stock awards is determined to be the current value of the Company’s stock, and this total value will be recognized as compensation expense over the vesting period, which is five years from the date of grant. As of December 31, 2012, there was $360,000 of total unrecognized compensation cost related to non-vested restricted stock. The cost is expected to be recognized evenly over the remaining 1.7 years of the restricted stock’s vesting period.
Stock Warrants
In recognition of the efforts and financial risks undertaken by the organizers of ServisFirst Bank (the “Bank”) in 2005, the Bank granted warrants to organizers to purchase a total of 60,000 shares of Bank common stock at a price of $10, which was the fair market value of the Bank’s common stock at the date of the grant. The warrants became warrants to purchase a like number of shares of the Company’s common stock upon the formation of the Company as a holding company for the Bank. The warrants vest in equal annual increments over a three-year period commencing on the first anniversary date of the Bank’s incorporation and will terminate on the tenth anniversary of the incorporation date. All of these warrants were exercised as of December 31, 2012 and there were 20,000 outstanding as of December 31, 2011.
The Company issued warrants for 75,000 shares of common stock with an exercise price of $25 per share in the third quarter of 2008. These warrants were issued in connection with trust preferred securities. There were 70,500 warrants outstanding as of December 31, 2012 and 75,000 warrants were outstanding as of December 31, 2011.
The Company issued warrants for 15,000 shares of common stock with an exercise price of $25 per share in the second quarter of 2009. These warrants were issued in connection with the issuance of the Company’s 8.25% Subordinated Note.
As of December 31, 2012, all warrants were fully vested.
Retirement Plans
The Company has a retirement savings 401(k) and profit-sharing plan in which all employees age 21 and older may participate after completion of one year of service. For employees in service with the Bank at June 15, 2005, the length of service and age requirements were waived. The Company matches employees’ contributions based on a percentage of salary contributed by participants and may make additional discretionary profit sharing contributions. The Company’s expense for the plan was $1,167,000, $946,000 and $377,000 for 2012, 2011 and 2010, respectively. The Company’s board of directors approved additional discretionary matches for 2012 and 2011 based on the profits of the Company during those years. The additional matches were 4% and 3%, respectively, and amounted to $576,000 and $432,000, respectively, and are included in the expenses above.
| NOTE 14. | COMMON STOCK |
During 2011, the Company completed private placements of 340,000 shares of common stock. The shares were issued and sold at $30 per share to 105 accredited investors, of which approximately 33,900 shares were purchased by directors, officers and their families, and 20 non-accredited investors. This sale of stock resulted in net proceeds of $10,159,000. This includes stock offering expenses of $33,000.
| NOTE 15. | REGULATORY MATTERS |
The Bank is subject to dividend restrictions set forth in the Alabama Banking Code and by the Alabama State Banking Department. Under such restrictions, the Bank may not, without the prior approval of the Alabama State Banking Department, declare dividends in excess of the sum of the current year’s earnings plus the retained earnings from the prior two years. Based on these restrictions, the Bank would be limited to paying $90.1 million in dividends as of December 31, 2012.
| 87 |
The Bank is subject to various regulatory capital requirements administered by the state and federal banking agencies. Failure to meet minimum capital requirements can initiate certain mandatory and possible additional discretionary actions by regulators that if undertaken, could have a direct material effect on the Bank and the financial statements. Under regulatory capital adequacy guidelines and the regulatory framework for prompt corrective action, the Bank must meet specific capital guidelines involving quantitative measures of the Bank’s assets, liabilities, and certain off-balance-sheet items as calculated under regulatory accounting practices. The Bank’s capital amounts and classification under the prompt corrective guidelines are also subject to qualitative judgments by the regulators about components, risk weightings, and other factors.
Quantitative measures established by regulation to ensure capital adequacy require the Bank to maintain minimum amounts and ratios (set forth in the table below) of total risk-based capital and Tier 1 capital to risk-weighted assets (as defined in the regulations), and Tier 1 capital to adjusted total assets (as defined). Management believes, as of December 31, 2012, that the Bank meets all capital adequacy requirements to which it is subject.
As of December 31, 2012, the most recent notification from the Federal Deposit Insurance Corporation categorized ServisFirst Bank as well capitalized under the regulatory framework for prompt corrective action. To remain categorized as well capitalized, the Bank will have to maintain minimum total risk-based, Tier 1 risk-based, and Tier 1 leverage ratios as disclosed in the table below. Management believes that it is well capitalized under the prompt corrective action provisions as of December 31, 2012.
The Company’s and Bank’s actual capital amounts and ratios are presented in the following table:
| Actual | For Capital Adequacy Purposes | To Be Well Capitalized Under Prompt Corrective Action Provisions | ||||||||||||||||||||||
| Amount | Ratio | Amount | Ratio | Amount | Ratio | |||||||||||||||||||
| As of December 31, 2012: | ||||||||||||||||||||||||
| Total Capital to Risk Weighted Assets: | ||||||||||||||||||||||||
| Consolidated | $ | 287,136 | 11.78 | % | $ | 194,943 | 8.00 | % | N/A | N/A | ||||||||||||||
| ServisFirst Bank | 284,141 | 11.66 | % | 194,942 | 8.00 | % | $ | 243,678 | 10.00 | % | ||||||||||||||
| Tier I Capital to Risk Weighted Assets: | ||||||||||||||||||||||||
| Consolidated | 240,961 | 9.89 | % | 97,472 | 4.00 | % | N/A | N/A | ||||||||||||||||
| ServisFirst Bank | 257,883 | 10.58 | % | 97,471 | 4.00 | % | 146,207 | 6.00 | % | |||||||||||||||
| Tier I Capital to Average Assets: | ||||||||||||||||||||||||
| Consolidated | 240,961 | 8.43 | % | 114,323 | 4.00 | % | N/A | N/A | ||||||||||||||||
| ServisFirst Bank | 257,883 | 9.03 | % | 114,227 | 4.00 | % | 142,784 | 5.00 | % | |||||||||||||||
| As of December 31, 2011: | ||||||||||||||||||||||||
| Total Capital to Risk Weighted Assets: | ||||||||||||||||||||||||
| Consolidated | $ | 246,334 | 12.79 | % | $ | 154,094 | 8.00 | % | N/A | N/A | ||||||||||||||
| ServisFirst Bank | 243,279 | 12.63 | % | 154,070 | 8.00 | % | $ | 192,588 | 10.00 | % | ||||||||||||||
| Tier I Capital to Risk Weighted Assets: | ||||||||||||||||||||||||
| Consolidated | 219,350 | 11.39 | % | 77,047 | 4.00 | % | N/A | N/A | ||||||||||||||||
| ServisFirst Bank | 216,295 | 11.23 | % | 77,035 | 4.00 | % | 115,553 | 6.00 | % | |||||||||||||||
| Tier I Capital to Average Assets: | ||||||||||||||||||||||||
| Consolidated | 219,350 | 9.17 | % | 95,642 | 4.00 | % | N/A | N/A | ||||||||||||||||
| ServisFirst Bank | 216,295 | 9.06 | % | 95,481 | 4.00 | % | 119,352 | 5.00 | % | |||||||||||||||
| 88 |
NOTE 16. OTHER OPERATING INCOME AND EXPENSES
The major components of other operating income and expense included in noninterest income and noninterest expense are as follows:
| Years Ended December 31, | ||||||||||||
| 2012 | 2011 | 2010 | ||||||||||
| (In Thousands) | ||||||||||||
| Other Operating Income | ||||||||||||
| (Loss) gain on sale of other real estate owned | $ | (105 | ) | $ | 76 | $ | (203 | ) | ||||
| Credit card income | 1,064 | 481 | 30 | |||||||||
| Other | 744 | 650 | 744 | |||||||||
| $ | 1,703 | $ | 1,207 | $ | 571 | |||||||
| Other Operating Expenses | ||||||||||||
| Postage | $ | 159 | $ | 194 | $ | 173 | ||||||
| Telephone | 385 | 409 | 358 | |||||||||
| Data processing | 2,202 | 2,023 | 1,983 | |||||||||
| Other loan expenses | 2,836 | 2,406 | 1,027 | |||||||||
| Supplies | 320 | 356 | 263 | |||||||||
| Customer and public relations | 791 | 689 | 477 | |||||||||
| Marketing | 454 | 406 | 313 | |||||||||
| Sales and use tax | 198 | 208 | 141 | |||||||||
| Donations and contributions | 482 | 437 | 261 | |||||||||
| Directors fees | 286 | 235 | 216 | |||||||||
| Prepayment penalties FHLB advances | - | 738 | - | |||||||||
| Other | 2,609 | 2,313 | 2,071 | |||||||||
| $ | 10,722 | $ | 10,414 | $ | 7,283 | |||||||
NOTE 17. INCOME TAXES
The components of income tax expense are as follows:
| Year Ended December 31, | ||||||||||||
| 2012 | 2011 | 2010 | ||||||||||
| (In Thousands) | ||||||||||||
| Current | $ | 19,301 | $ | 13,629 | $ | 11,570 | ||||||
| Deferred | (2,181 | ) | (1,240 | ) | (2,212 | ) | ||||||
| Income tax expense | $ | 17,120 | $ | 12,389 | $ | 9,358 | ||||||
The Company’s total income tax expense differs from the amounts computed by applying the Federal income tax statutory rates to income before income taxes. A reconciliation of the differences is as follows:
| Year Ended December 31, 2012 | ||||||||
| Amount | % of Pre-tax Earnings | |||||||
| (In Thousands) | ||||||||
| Income tax at statutory federal rate | $ | 18,047 | 35.00 | % | ||||
| Effect on rate of: | ||||||||
| State income tax, net of federal tax effect | 709 | 1.37 | % | |||||
| Tax-exempt income, net of expenses | (1,007 | ) | (1.95 | )% | ||||
| Bank owned life insurance contracts | (568 | ) | (1.10 | )% | ||||
| Incentive stock option expense | 121 | 0.23 | % | |||||
| Other | (182 | ) | (0.35 | )% | ||||
| Effective income tax and rate | $ | 17,120 | 33.20 | % | ||||
| Year Ended December 31, 2011 | ||||||||
| Amount | % of Pre-tax Earnings | |||||||
| (In Thousands) | ||||||||
| Income tax at statutory federal rate | $ | 12,540 | 35.00 | % | ||||
| Effect on rate of: | ||||||||
| State income tax, net of federal tax effect | 967 | 2.70 | % | |||||
| Tax-exempt income, net of expenses | (875 | ) | (2.44 | )% | ||||
| Bank owned life insurance contracts | (137 | ) | (0.38 | )% | ||||
| Incentive stock option expense | 128 | 0.36 | % | |||||
| Other | (234 | ) | (0.65 | )% | ||||
| Effective income tax and rate | $ | 12,389 | 34.59 | % | ||||
| 89 |
| Year Ended December 31, 2010 | ||||||||
| Amount | % of Pre-tax Earnings | |||||||
| (In Thousands) | ||||||||
| Income tax at statutory federal rate | $ | 9,358 | 35.00 | % | ||||
| Effect on rate of: | ||||||||
| State income tax, net of federal tax effect | 715 | 2.67 | % | |||||
| Tax-exempt income, net of expenses | (773 | ) | (2.89 | )% | ||||
| Incentive stock option expense | 144 | 0.54 | % | |||||
| Other | (86 | ) | (0.32 | )% | ||||
| Effective income tax and rate | $ | 9,358 | 35.00 | % | ||||
The components of net deferred tax asset are as follows:
| December 31, | ||||||||||||
| 2012 | 2011 | 2010 | ||||||||||
| (In Thousands) | ||||||||||||
| Other real estate | $ | 1,064 | $ | 452 | $ | 646 | ||||||
| Start-up costs | 101 | 115 | 127 | |||||||||
| Net unrealized (gains) losses on securities available for sale | (3,929 | ) | (4,220 | ) | (1,528 | ) | ||||||
| Depreciation | (509 | ) | (489 | ) | (206 | ) | ||||||
| Deferred loan fees | (237 | ) | (176 | ) | (72 | ) | ||||||
| Allowance for loan losses | 10,142 | 8,509 | 6,974 | |||||||||
| Nonqualified equity awards | 583 | 436 | 194 | |||||||||
| Other | 171 | 287 | 231 | |||||||||
| Net deferred income tax assets | $ | 7,386 | $ | 4,914 | $ | 6,366 | ||||||
The Company believes its net deferred tax asset is recoverable as of December 31, 2012 based on the expectation of future taxable income and other relevant considerations.
Accounting Standards Codification (“ASC”) 740 defines the threshold for recognizing the benefits of tax return positions in the financial statements as “more-likely-than-not” to be sustained by the taxing authority. This section also provides guidance on derecognition, measurement and classification of income tax uncertainties in interim periods. As of December 31, 2012, the Company had no unrecognized tax benefits related to federal or state income tax matters. The Company does not anticipate any material increase or decrease in unrecognized tax benefits during 2012 related to any tax positions taken prior to December 31, 2012. As of December 31, 2012, the Company has accrued no interest or penalties related to uncertain tax positions. It is the Company’s policy to recognize interest and penalties, if any, related to income tax matters in income tax expense.
The Company and its subsidiaries file consolidated U.S. Federal, State of Alabama and State of Florida income tax returns. The Company is currently open to audit under the statute of limitations by the Internal Revenue Service for the years ended December 31, 2010 through 2012. The Company is also currently open to audit by the State of Alabama for the years ended December 31, 2010 through 2012, and open to audit by the state of Florida for the years ended December 31, 2011 and 2012, as we opened our first office in the State of Florida in 2011.
NOTE 18. COMMITMENTS AND CONTINGENCIES
Loan Commitments
The Company is a party to financial instruments with off-balance-sheet risk in the normal course of business to meet the financing needs of its customers. These financial instruments include commitments to extend credit, credit card arrangements, and standby letters of credit. Such commitments involve, to varying degrees, elements of credit and interest rate risk in excess of the amount recognized in the balance sheets. A summary of the Company’s approximate commitments and contingent liabilities is as follows:
| 2012 | 2011 | 2010 | ||||||||||
| (In Thousands) | ||||||||||||
| Commitments to extend credit | $ | 860,421 | $ | 697,939 | $ | 538,719 | ||||||
| Credit card arrangements | 25,699 | 19,686 | 17,601 | |||||||||
| Standby letters of credit and financial guarantees | 36,374 | 42,937 | 47,103 | |||||||||
| Total | $ | 922,494 | $ | 760,562 | $ | 603,423 | ||||||
| 90 |
Commitments to extend credit, credit card arrangements, commercial letters of credit and standby letters of credit all include exposure to some credit loss in the event of nonperformance of the customer. The Company uses the same credit policies in making commitments and conditional obligations as it does for on-balance sheet financial instruments. Because these instruments have fixed maturity dates, and because many of them expire without being drawn upon, they do not generally present any significant liquidity risk to the Company.
NOTE 19. CONCENTRATIONS OF CREDIT
The Company originates primarily commercial, residential, and consumer loans to customers in the Company’s market area. The ability of the majority of the Company’s customers to honor their contractual loan obligations is dependent on the economy in the market area.
The Company’s loan portfolio is concentrated primarily in loans secured by real estate, of which 54% is secured by real estate in the Company’s primary market areas. In addition, a substantial portion of the other real estate owned is located in that same market. Accordingly, the ultimate collectability of the loan portfolio and the recovery of the carrying amount of other real estate owned are susceptible to changes in market conditions in the Company’s primary market area.
NOTE 20. EARNINGS PER COMMON SHARE
Basic earnings per common share are computed by dividing net income available to common stockholders by the weighted average number of common shares outstanding during the period. Diluted earnings per common share include the dilutive effect of additional potential common shares issuable under stock options and warrants, as well as the common shares issuable upon conversion of the Company’s 6% Mandatory Convertible Trust Preferred Securities due March 15, 2040.
| 91 |
| Years Ended December 31, | ||||||||||||
| 2012 | 2011 | 2010 | ||||||||||
| (Dollar Amounts In Thousands Except Per Share Amounts) | ||||||||||||
| Earnings Per Share | ||||||||||||
| Weighted average common shares outstanding | 5,996,437 | 5,759,524 | 5,519,151 | |||||||||
| Net income available to common stockholders | $ | 34,045 | $ | 23,238 | $ | 17,378 | ||||||
| Basic earnings per common share | $ | 5.68 | 4.03 | $ | 3.15 | |||||||
| Weighted average common shares outstanding | 5,996,437 | 5,759,524 | 5,519,151 | |||||||||
| Dilutive effects of assumed conversions and exercise of stock options and warrants | 945,315 | 989,639 | 775,453 | |||||||||
| Weighted average common and dilutive potential common shares outstanding | 6,941,752 | 6,749,163 | 6,294,604 | |||||||||
| Net income available to common stockholders | $ | 34,045 | $ | 23,238 | $ | 17,378 | ||||||
| Effect of interest expense on convertible debt, net of tax and discretionary expenditures related to conversion | $ | 569 | $ | 568 | $ | 473 | ||||||
| Net income available to common stockholders, adjusted for effect of debt conversion | $ | 34,614 | $ | 23,806 | $ | 17,851 | ||||||
| Diluted earnings per common share | $ | 4.99 | $ | 3.53 | $ | 2.84 | ||||||
NOTE 21. RELATED PARTY TRANSACTIONS
Loans
As more fully described in Note 3, the Company had outstanding loan balances to related parties as of December 31, 2012 and 2011 in the amount of $12.4 million and $9.0 million, respectively.
NOTE 22. FAIR VALUE MEASUREMENT
Measurement of fair value under U.S. GAAP establishes a hierarchy that prioritizes observable and unobservable inputs used to measure fair value, as of the measurement date, into three broad levels, which are described below:
Level 1: Quoted prices (unadjusted) in active markets that are accessible at the measurement date for assets or liabilities. The fair value hierarchy gives the highest priority to Level 1 inputs.
Level 2: Observable prices that are based on inputs not quoted on active markets, but corroborated by market data.
Level 3: Unobservable inputs are used when little or no market data is available. The fair value hierarchy gives the lowest priority to Level 3 inputs.
In determining fair value, the Company utilizes valuation techniques that maximize the use of observable inputs and minimize the use of unobservable inputs to the extent possible and also considers counterparty credit risk in its assessment of fair value.
Debt Securities. Where quoted prices are available in an active market, securities are classified within Level 1 of the hierarchy. Level 1 securities include highly liquid government securities such as U.S. treasuries and exchange-traded equity securities. For securities traded in secondary markets for which quoted market prices are not available, the Company generally relies on prices obtained from independent vendors. Such independent pricing services are to advise the Company on the carrying value of the securities available for sale portfolio. As part of the Company’s procedures, the price provided from the service is evaluated for reasonableness given market changes. When a questionable price exists, the Company investigates further to determine if the price is valid. If needed, other market participants may be utilized to determine the correct fair value. The Company has also reviewed and confirmed its determinations in discussions with the pricing service regarding their methods of price discovery. Securities measured with these techniques are classified within Level 2 of the hierarchy and often involve using quoted market prices for similar securities, pricing models or discounted cash flow calculations using inputs observable in the market where available. Examples include U.S. government agency securities, mortgage-backed securities, obligations of states and political subdivisions, and certain corporate, asset-backed and other securities. In cases where Level 1 or Level 2 inputs are not available, securities are classified in Level 3 of the hierarchy.
| 92 |
Interest Rate Swap Agreements. The fair value is estimated by a third party using inputs that are observable or that can be corroborated by observable market data and, therefore, are classified within Level 2 of the hierarchy. These fair value estimations include primarily market observable inputs such as yield curves and option volatilities, and include the value associated with counterparty credit risk.
Impaired Loans. Impaired loans are measured and reported at fair value when full payment under the loan terms is not probable. Impaired loans are carried at the present value of expected future cash flows using the loan’s existing rate in a discounted cash flow calculation, or the fair value of the collateral if the loan is collateral-dependent. Expected cash flows are based on internal inputs reflecting expected default rates on contractual cash flows. This method of estimating cash flows does not incorporate the exit-price concept of fair value described in ASC 820-10 and would generally result in a higher value than the exit-price approach. For loans measured using the estimated fair value of collateral less costs to sell, fair value is generally determined based on appraisals performed by certified and licensed appraisers using inputs such as absorption rates, capitalization rates and market comparables, adjusted for estimated costs to sell. Management modifies the appraised values, if needed, to take into account recent developments in the market or other factors, such as changes in absorption rates or market conditions from the time of valuation, and anticipated sales values considering management’s plans for disposition. Such modifications to the appraised values could result in lower valuations of such collateral. Estimated costs to sell are based on current amounts of disposal costs for similar assets. These measurements are classified as Level 3 within the valuation hierarchy. Impaired loans are subject to nonrecurring fair value adjustment upon initial recognition or subsequent impairment. A portion of the allowance for loan losses is allocated to impaired loans if the value of such loans is deemed to be less than the unpaid balance. Impaired loans are reviewed and evaluated on at least a quarterly basis for additional impairment and adjusted accordingly based on the same factors identified above. The amount recognized as an impairment charge related to impaired loans that are measured at fair value on a nonrecurring basis was $4,586,000 and $5,419,000 during the years ended December 31, 2012 and 2011, respectively. Impaired loans measured at fair value on a nonrecurring basis are classified within Level 3 of the hierarchy.
Other Real Estate Owned. Other real estate owned (“OREO”) acquired through, or in lieu of, foreclosure are held for sale and are initially recorded at the lower of cost or fair value, less selling costs. Any write-downs to fair value at the time of transfer to OREO are charged to the allowance for loan losses subsequent to foreclosure. Values are derived from appraisals of underlying collateral and discounted cash flow analysis. A net loss on the sale and write-downs of OREO of $2,166,000 and $266,000 was recognized during the years ended December 31, 2012 and 2011. These charges were for write-downs in the value of OREO subsequent to foreclosure and losses on the disposal of OREO. OREO is classified within Level 3 of the hierarchy.
| 93 |
The following table presents the Company’s financial assets and financial liabilities carried at fair value on a recurring basis as of December 31, 2012 and December 31, 2011:
| Fair Value Measurements at December 31, 2012 Using | ||||||||||||||||
| Quoted Prices in | ||||||||||||||||
| Active Markets | Significant Other | Significant | ||||||||||||||
| for Identical | Observable Inputs | Unobservable | ||||||||||||||
| Assets (Level 1) | (Level 2) | Inputs (Level 3) | Total | |||||||||||||
| Assets Measured on a Recurring Basis: | (In Thousands) | |||||||||||||||
| Available-for-sale securities: | ||||||||||||||||
| U.S. Treasury and government sponsored agencies | $ | - | $ | 28,386 | $ | - | $ | 28,386 | ||||||||
| Mortgage-backed securities | - | 73,466 | - | 73,466 | ||||||||||||
| State and municipal securities | - | 118,177 | - | 118,177 | ||||||||||||
| Corporate debt | - | 13,848 | - | 13,848 | ||||||||||||
| Interest rate swap agreements | - | 389 | - | 389 | ||||||||||||
| Liabilities Measured on a Recurring Basis: | ||||||||||||||||
| Interest rate swap agreements | $ | - | $ | 389 | $ | - | $ | 389 | ||||||||
| Fair Value Measurements at December 31, 2011 Using | ||||||||||||||||
| Quoted Prices in | ||||||||||||||||
| Active Markets | Significant Other | Significant | ||||||||||||||
| for Identical | Observable Inputs | Unobservable | ||||||||||||||
| Assets (Level 1) | (Level 2) | Inputs (Level 3) | Total | |||||||||||||
| Assets Measured on a Recurring Basis: | (In Thousands) | |||||||||||||||
| Available-for-sale securities | ||||||||||||||||
| U.S. Treasury and government sponsored agencies | $ | - | $ | 99,622 | $ | - | $ | 99,622 | ||||||||
| Mortgage-backed securities | - | 92,580 | - | 92,580 | ||||||||||||
| State and municipal securities | - | 100,526 | - | 100,526 | ||||||||||||
| Corporate debt | - | 1,081 | - | 1,081 | ||||||||||||
| Interest rate swap agreements | - | 617 | - | 617 | ||||||||||||
| Interest rate cap | - | 9 | - | 9 | ||||||||||||
| Total assets at fair value | $ | - | $ | 294,435 | $ | - | $ | 294,435 | ||||||||
| Liabilities Measured on a Recurring Basis: | ||||||||||||||||
| Interest rate swap agreements | $ | - | $ | 617 | $ | - | $ | 617 | ||||||||
| 94 |
The carrying amount and estimated fair value of the Company’s financial instruments were as follows::
| Fair Value Measurements at December 31, 2012 Using | ||||||||||||||||
| Quoted Prices in | ||||||||||||||||
| Active Markets | Significant Other | Significant | ||||||||||||||
| for Identical | Observable | Unobservable | ||||||||||||||
| Assets (Level 1) | Inputs (Level 2) | Inputs (Level 3) | Total | |||||||||||||
| Assets Measured on a Nonrecurring Basis: | (In Thousands) | |||||||||||||||
| Impaired loans, net of related allowance | $ | - | - | $ | 33,883 | $ | 33,883 | |||||||||
| Other real estate owned and repossessed assets | - | - | 9,685 | 9,685 | ||||||||||||
| Total assets at fair value | - | - | $ | 43,568 | $ | 43,568 | ||||||||||
| Fair Value Measurements at December 31, 2011 Using | ||||||||||||||||
| Quoted Prices in | ||||||||||||||||
| Active Markets | Significant Other | Significant | ||||||||||||||
| for Identical | Observable | Unobservable | ||||||||||||||
| Assets (Level 1) | Inputs (Level 2) | Inputs (Level 3) | Total | |||||||||||||
| Assets Measured on a Nonrecurring Basis: | (In Thousands) | |||||||||||||||
| Impaired loans, net of related allowance | $ | - | $ | - | $ | 33,072 | $ | 33,072 | ||||||||
| Other real estate owned | - | - | 12,275 | 12,275 | ||||||||||||
| Total assets at fair value | $ | - | $ | - | $ | 45,347 | $ | 45,347 | ||||||||
The fair value of a financial instrument is the current amount that would be exchanged in a sale between willing parties, other than in a forced liquidation. Fair value is best determined based upon quoted market prices. However, in many instances, there are no quoted market prices for the Company’s various financial instruments. In cases where quoted market prices are not available, fair values are based on estimates using present value or other valuation techniques. Those techniques are significantly affected by the assumptions used, including the discount rate and estimates of future cash flows. Accordingly, the fair value estimates may not be realized in an immediate settlement of the instrument. Current U.S. GAAP excludes certain financial instruments and all nonfinancial instruments from its fair value disclosure requirements. Accordingly, the aggregate fair value amounts presented may not necessarily represent the underlying fair value of the Company.
The following methods and assumptions were used by the Company in estimating its fair value disclosures for financial instruments.
Debt securities: Where quoted prices are available in an active market, securities are classified within Level 1 of the hierarchy. Level 1 securities include highly liquid government securities such as U.S. treasuries and exchange-traded equity securities. For securities traded in secondary markets for which quoted market prices are not available, the Company generally relies on prices obtained from independent vendors. Such independent pricing services are to advise the Company on the carrying value of the securities available for sale portfolio. As part of the Company’s procedures, the price provided from the service is evaluated for reasonableness given market changes. When a questionable price exists, the Company investigates further to determine if the price is valid. If needed, other market participants may be utilized to determine the correct fair value. The Company has also reviewed and confirmed its determinations in discussions with the pricing service regarding their methods of price discovery. Securities measured with these techniques are classified within Level 2 of the hierarchy and often involve using quoted market prices for similar securities, pricing models or discounted cash flow calculations using inputs observable in the market where available. Examples include U.S. government agency securities, mortgage-backed securities, obligations of states and political subdivisions, and certain corporate, asset-backed and other securities. In cases where Level 1 or Level 2 inputs are not available, securities are classified in Level 3 of the hierarchy.
Restricted equity securities: Fair values for other investments are considered to be their cost as they are redeemed at par value.
Loans: For variable-rate loans that re-price frequently and with no significant change in credit risk, fair value is based on carrying amounts. The fair value of other loans (for example, fixed-rate commercial real estate loans, mortgage loans, and industrial loans) is estimated using discounted cash flow analysis, based on interest rates currently being offered for loans with similar terms to borrowers of similar credit quality. Loan fair value estimates include judgments regarding future expected loss experience and risk characteristics. The method of estimating fair value does not incorporate the exit-price concept of fair value as prescribed by ASC 820 and generally produces a higher value than an exit-price approach. The measurement of the fair value of loans is classified within Level 3 of the fair value hierarchy.
| 95 |
Mortgage loans held for sale: Loans are committed to be delivered to investors on a “best efforts delivery” basis within 30 days of origination. Due to this short turn-around time, the carrying amounts of the Company’s loan purchase agreements with investors approximate their fair values.
Derivatives: The fair value of the derivative agreements are estimated by a third party using inputs that are observable or can be corroborated by observable market data. As part of the Company’s procedures, the price provided from the third party is evaluated for reasonableness given market changes. These measurements are classified within Level 2 of the fair value hierarchy.
Deposits: The fair value disclosed for demand deposits is, by definition, equal to the amount payable on demand at the reporting date (that is, their carrying amounts). The carrying amounts of variable-rate, fixed-term money market accounts and certificates of deposit approximate their fair values. Fair values for fixed-rate certificates of deposit are estimated using a discounted cash flow calculation using interest rates currently offered for deposits with similar remaining maturities. The fair value of the Company’s time deposits do not take into consideration the value of the Company’s long-term relationships with depositors, which may have significant value. Measurements of the fair value of certificates of deposit are classified within Level 2 of the fair value hierarchy.
Other borrowings: The fair value of other borrowings are estimated using discounted cash flow analysis, based on interest rates currently being offered by the Federal Home Loan Bank for borrowings of similar terms as those being valued. These measurements are classified within Level 2 in the fair value hierarchy.
Subordinated debentures: The fair value of subordinated debentures are estimated using a discounted cash flow analysis, based on interest rates currently being offered on the best alternative debt available at the measurement date. These measurements are classified within Level 2 in the fair value hierarchy.
Loan commitments: The fair values of the Company’s off-balance sheet financial instruments are based on fees currently charged to enter into similar agreements. Since the majority of the Company’s other off-balance-sheet instruments consist of non-fee-producing, variable-rate commitments, the Company has determined they do not have a distinguishable fair value.
The carrying amount, estimated fair value and placement in the fair value hierarchy of the Company’s financial instruments as of December 31, 2012 and December 31, 2011 are presented in the following table. This table includes those financial assets and liabilities that are not measured and reported at fair value on a recurring basis or nonrecurring basis.
| 96 |
The Company’s financial assets and financial liabilities which are carried at fair value were as follows:.
| December 31, | ||||||||||||||||
| 2012 | 2011 | |||||||||||||||
| Carrying Amount | Fair Value | Carrying Amount | Fair Value | |||||||||||||
| (In Thousands) | ||||||||||||||||
| Financial Assets: | ||||||||||||||||
| Level 2 Inputs: | ||||||||||||||||
| Debt securities available for sale | $ | 233,877 | $ | 233,877 | $ | 293,809 | $ | 293,809 | ||||||||
| Debt securities held to maturity | 25,967 | 27,350 | 15,209 | 15,999 | ||||||||||||
| Restricted equity securities | 3,941 | 3,941 | 3,501 | 3,501 | ||||||||||||
| Mortgage loans held for sale | 25,826 | 25,826 | 17,859 | 17,859 | ||||||||||||
| Bank owned life insurance contracts | 57,014 | 57,014 | 40,390 | 40,390 | ||||||||||||
| Derivatives | 389 | 389 | 626 | 626 | ||||||||||||
| Level 3 Inputs: | ||||||||||||||||
| Loans, net | $ | 2,336,924 | $ | 2,327,780 | $ | 1,808,712 | $ | 1,811,612 | ||||||||
| Financial Liabilities: | ||||||||||||||||
| Level 2 Inputs: | ||||||||||||||||
| Deposits | $ | 2,511,572 | $ | 2,516,320 | $ | 2,143,887 | $ | 2,150,308 | ||||||||
| Other borrowings | 19,917 | 19,917 | 4,954 | 5,377 | ||||||||||||
| Subordinated debentures | 15,050 | 15,050 | 30,514 | 27,402 | ||||||||||||
| Derivatives | 389 | 389 | 617 | 617 | ||||||||||||
NOTE 23. PARENT COMPANY FINANCIAL INFORMATION
The following information presents the condensed balance sheet of the Company as of December 31, 2012 and 2011 and the condensed statements of income and cash flows for the years ended December 31, 2012, 2011 and 2010.
BALANCE SHEETS DECEMBER 31, 2012 AND 2011
(In Thousands)
| 2012 | 2011 | |||||||
| ASSETS | ||||||||
| Cash and due from banks | $ | 3,264 | $ | 2,908 | ||||
| Investment in subsidiary | 265,229 | 223,753 | ||||||
| Other assets | 18 | 293 | ||||||
| Total assets | $ | 268,511 | $ | 226,954 | ||||
| LIABILITIES AND STOCKHOLDERS' EQUITY | ||||||||
| Liabilities: | ||||||||
| Other borrowings | $ | 19,917 | $ | - | ||||
| Subordinated debentures | 15,050 | 30,514 | ||||||
| Other liabilities | 287 | 148 | ||||||
| Total liabilities | 35,254 | 30,662 | ||||||
| Stockholders' equity: | ||||||||
| Preferred stock, Series A Senior Non-Cumulative Perpetual, par value $.001 (liquidation preference $1,000), net of discount; 40,000 shares authorized, 40,000 shares issued and outstanding at December 31, 2012 and no shares authorized, issued and outstanding at December 31, 2011 | 39,958 | 39,958 | ||||||
| Common stock, par value $.001 per share; 50,000,000 shares authorized; 6,268,812 shares issued and outstanding at December 31, 2012 and 5,932,182 shares issued and outstanding at December 31, 2011 | 6 | 6 | ||||||
| Additional paid-in capital | 93,505 | 87,805 | ||||||
| Retained earnings | 92,492 | 61,581 | ||||||
| Accumulated other comprehensive income | 7,296 | 6,942 | ||||||
| Total stockholders' equity | 233,257 | 196,292 | ||||||
| Total liabilites and stockholders' equity | $ | 268,511 | $ | 226,954 | ||||
| 97 |
STATEMENTS OF INCOME
FOR THE YEARS ENDED DECEMBER 31,
(In Thousands)
| 2012 | 2011 | 2010 | ||||||||||
| Income: | ||||||||||||
| Dividends received from subsidiary | $ | - | $ | 800 | $ | 1,230 | ||||||
| Other income | 41 | 43 | 42 | |||||||||
| Total income | 41 | 843 | 1,272 | |||||||||
| Interest on borrowings | 2,213 | 2,345 | 2,236 | |||||||||
| Other operating expenses | 325 | 291 | 295 | |||||||||
| Total expenses | 2,538 | 2,636 | 2,531 | |||||||||
| undistributed earnings of subsidiary | (2,497 | ) | (1,793 | ) | (1,259 | ) | ||||||
| Income tax benefit | (944 | ) | (976 | ) | (924 | ) | ||||||
| earnings of subsidiary | (1,553 | ) | (817 | ) | (335 | ) | ||||||
| Equity in undistributed earnings of subsidiary | 35,998 | 24,255 | 17,713 | |||||||||
| Net income | 34,445 | 23,438 | 17,378 | |||||||||
| Dividends on preferred stock | 400 | 200 | - | |||||||||
| Net income available to common stockholders | $ | 34,045 | $ | 23,238 | $ | 17,378 | ||||||
STATEMENT OF CASH FLOWS
FOR THE YEARS ENDED DECEMBER 31,
(In Thousands)
| 2012 | 2011 | 2010 | ||||||||||
| Operating activities | ||||||||||||
| Net income | $ | 34,445 | $ | 23,438 | $ | 17,378 | ||||||
| Adjustments to reconcile net income to net cash used in operating activities: | ||||||||||||
| Other | 878 | (50 | ) | 241 | ||||||||
| Equity in undistributed earnings of subsidiary | (35,998 | ) | (24,255 | ) | (17,713 | ) | ||||||
| Net cash (used in) provided by operating activities | (675 | ) | (867 | ) | (94 | ) | ||||||
| Investing activities | ||||||||||||
| Investment in subsidiary | - | (46,200 | ) | (15,000 | ) | |||||||
| Net cash used in investing activities | - | (46,200 | ) | (15,000 | ) | |||||||
| Financing activities | ||||||||||||
| Proceeds from other borrowings | 19,917 | - | - | |||||||||
| Repayment of subordinated debentures | (15,464 | ) | - | - | ||||||||
| Proceeds from issuance of subordinated debentures | - | - | 15,050 | |||||||||
| Proceeds from issuance of preferred stock | - | 39,958 | - | |||||||||
| Proceeds from issuance of common stock | 112 | 10,166 | - | |||||||||
| Dividends on preferred stock | (400 | ) | (200 | ) | - | |||||||
| Dividends on common stock | (3,134 | ) | - | - | ||||||||
| Net cash provided by financing activities | 1,031 | 49,924 | 15,050 | |||||||||
| (Decrease) increase in cash and cash equivalents | $ | 356 | $ | 2,857 | $ | (44 | ) | |||||
| Cash and cash equivalents at beginning of year | 2,908 | 51 | 95 | |||||||||
| Cash and cash equivalents at end of year | $ | 3,264 | $ | 2,908 | $ | 51 | ||||||
QUARTERLY FINANCIAL DATA (UNAUDITED)
The following table sets forth certain unaudited quarterly financial data derived from our consolidated financial statements. Such data is only a summary and should be read in conjunction with our historical consolidated financial statements and related notes continued in this annual report on Form 10-K.
| 98 |
| 2012 Quarter Ended | ||||||||||||||||
| (Dollars in thousands, except per share data) | ||||||||||||||||
| March 31 | June 30 | September 30 | December 31 | |||||||||||||
| Interest income | $ | 25,571 | $ | 26,654 | $ | 27,743 | $ | 29,055 | ||||||||
| Interest expense | 3,833 | 3,749 | 3,695 | 3,624 | ||||||||||||
| Net interest income | 21,738 | 22,905 | 24,048 | 25,431 | ||||||||||||
| Provision for loan losses | 2,383 | 3,083 | 1,185 | 2,449 | ||||||||||||
| Net income available to common stockholders | 8,155 | 8,231 | 9,202 | 8,457 | ||||||||||||
| Net income per common share, basic | $ | 1.37 | $ | 1.38 | $ | 1.53 | $ | 1.40 | ||||||||
| Net income per common share, diluted | $ | 1.20 | $ | 1.21 | $ | 1.35 | $ | 1.23 | ||||||||
| 2011 Quarter Ended | ||||||||||||||||
| (Dollars in thousands, except per share data) | ||||||||||||||||
| March 31 | June 30 | September 30 | December 31 | |||||||||||||
| Interest income | $ | 20,961 | $ | 22,080 | $ | 23,312 | $ | 25,058 | ||||||||
| Interest expense | 3,985 | 4,032 | 4,093 | 3,970 | ||||||||||||
| Net interest income | 16,976 | 18,048 | 19,219 | 21,088 | ||||||||||||
| Provision for loan losses | 2,231 | 1,494 | 2,740 | 2,507 | ||||||||||||
| Net income available to common stockholders | 4,871 | 5,845 | 6,035 | 6,487 | ||||||||||||
| Net income per common share, basic | $ | 0.88 | $ | 1.02 | $ | 1.03 | $ | 1.10 | ||||||||
| Net income per common share, diluted | $ | 0.77 | $ | 0.89 | $ | 0.90 | $ | 0.97 | ||||||||
ITEM 9. CHANGES IN AND DISAGREEMENTS WITH ACCOUNTANTS ON ACCOUNTING AND FINANCIAL DISCLOSURE.
There were no changes in or disagreements with accountants regarding accounting and financial disclosure matters during the year ended December 31, 2012.
ITEM 9A. CONTROLS AND PROCEDURES
Evaluation of Disclosure Controls and Procedures
Our management, under supervision and with the participation of the Chief Executive Officer and the Chief Financial Officer, evaluated the effectiveness of our disclosure controls and procedures, as defined under Exchange Act Rule 13a-15(e). Based upon that evaluation of these disclosure controls and procedures, the Chief Executive Officer and Chief Financial Officer concluded that our disclosure controls and procedures were effective as of December 31, 2012.
Changes in Internal Control over Financial Reporting
The Chief Executive Officer and Chief Financial Officer have concluded that there were no changes in our internal control over financial reporting identified in the evaluation of the effectiveness of our disclosure controls and procedures that occurred during the fiscal quarter ended December 31, 2012, that have materially affected, or are reasonably likely to materially affect, our internal control over financial reporting.
Management’s Report on Internal Control over Financial Reporting
Our management is responsible for establishing and maintaining adequate internal control over financial reporting, as defined under Exchange Act Rules 13a-15(f) and 14d-14(f). Our internal control over financial reporting is designed to provide reasonable assurance regarding the reliability of financial reporting and the preparation of financial statements for external purposes in accordance with generally accepted accounting principles.
As of December 31, 2012, management assessed the effectiveness of our internal control over financial reporting based on criteria for effective internal control over financial reporting established in “Internal Control – Integrated Framework,” issued by the Committee of Sponsoring Organizations (COSO) of the Treadway Commission. Based on the assessment, management determined that the Company maintained effective internal control over financial reporting as of December 31, 2012, based on those criteria.
| 99 |
The effectiveness of the Company’s internal control over financial reporting as of December 31, 2012, has been audited by KPMG LLP, an independent registered public accounting firm, as stated in their report herein — “Report of Independent Registered Public Accounting Firm.”
ITEM 9B. OTHER INFORMATION.
None.
PART III
ITEM 10. DIRECTORS, EXECUTIVE OFFICERS AND CORPORATE GOVERNANCE.
We respond to this Item by incorporating by reference the material responsive to this Item in our definitive proxy statement to be filed with the Securities and Exchange Commission in connection with our 2013 Annual Meeting of Stockholders. Information regarding the Company’s executive officers is provided in Part I, Item 1 of the Form 10-K.
Code of Ethics
Our Board of Directors has adopted a Code of Ethics that applies to all of our employees, officers and directors. The Code of Ethics covers compliance with law; fair and honest dealings with us, with competitors and with others; fair and honest disclosure to the public; and procedures for compliance with the Code of Ethics. A copy of the Code of Ethics is included as Exhibit 14 to this Form 10-K.
ITEM 11. EXECUTIVE COMPENSATION.
We respond to this Item by incorporating by reference the material responsive to this Item in our definitive proxy statement to be filed with the Securities and Exchange Commission in connection with our 2013 Annual Meeting of Stockholders.
ITEM 12. SECURITY OWNERSHIP OF CERTAIN BENEFICIAL OWNERS AND MANAGEMENT AND RELATED STOCKHOLDER MATTERS.
We respond to this Item by incorporating by reference the material responsive to this Item in our definitive proxy statement to be filed with the Securities and Exchange Commission in connection with our 2013 Annual Meeting of Stockholders. The information called for by this item relating to “Securities Authorized for Issuance Under Equity Compensation Plans” is provided in Part II, Item 5 of this Form 10-K.
ITEM 13. CERTAIN RELATIONSHIPS AND RELATED TRANSACTIONS, AND DIRECTOR INDEPENDENCE.
We respond to this Item by incorporating by reference the material responsive to this Item in our definitive proxy statement to be filed with the Securities and Exchange Commission in connection with our 2013 Annual Meeting of Stockholders.
ITEM 14. PRINCIPAL ACCOUNTING FEES AND SERVICES.
We respond to this Item by incorporating by reference the material responsive to this Item in our definitive proxy statement to be filed with the Securities and Exchange Commission in connection with our 2013 Annual Meeting of Stockholders.
| 100 |
PART IV
ITEM 15. FINANCIAL STATEMENT SCHEDULES AND EXHIBITS
| (a) | The following statements are filed as a part of this Annual Report on Form 10-K |
| Page | |
| Report of Independent Registered Public Accounting Firm on Consolidated Financial Statements | 58 |
| Report of Independent Registered Public Accounting Firm on Consolidated Financial Statements | 59 |
| Report of Management on Internal Control over Financial Reporting | 60 |
| Report of Independent Registered Public Accounting Firm on Internal Control over Financial Reporting | 61 |
| Consolidated Balance Sheets at December 31, 2012 and 2011 | 62 |
| Consolidated Statements of Income for the Years Ended December 31, 2012, 2011 and 2010 | 63 |
| Consolidated Statements of Comprehensive Income for the Years Ended December 31, 2012, 2011 and 2010 | 64 |
| Consolidated Statements of Stockholders' Equity for the Years Ended December 31, 2012, 2011 and 2010 | 65 |
| Consolidated Statements of Cash Flows for the Years Ended December 31, 2012, 2011 and 2010 | 66 |
| Notes to Consolidated Financial Statements | 67 |
(b) The following exhibits are furnished with this Annual Report on Form 10-K
| EXHIBIT NO. | NAME OF EXHIBIT | ||
| 2.1 | Plan of Reorganization and Agreement of Merger dated August 29, 2007 (1) | ||
| 3.1 | Certificate of Incorporation, as amended (2) | ||
| 3.2 | Bylaws (1) | ||
| 4.1 | Form of Common Stock Certificate (1) | ||
| 4.2 | Revised Form of Common Stock Certificate (3) | ||
| 4.3 | Form of Common Stock Purchase Warrant dated September 2, 2008 (4) | ||
| 4.4 | Warrant to Purchase Share of Common Stock dated June 23, 2009 (7) | ||
| 4.5 | Amended and Restated Trust Agreement of ServisFirst Capital Trust II, dated March 15, 2010 (8) | ||
| 4.6 | Indenture dated March 15, 2010, by and between ServisFirst Bancshares, Inc. and Wilmington Trust Company (8) | ||
| 4.7 | Preferred Securities Guaranty Agreement, dated March 15, 2010, by and between ServisFirst Bancshares, Inc. and Wilmington Trust Company (8) | ||
| 4.8 | Small Business Fund - Securities Purchase Agreement dated June 21, 2011 between the Secretary of the Treasury and ServisFirst Bancshares, Inc. (9) | ||
| 4.9 | Certificate of Designation of Senior Non-cumulative Perpetual Preferred Stock, Series A of ServisFirst Bancshares, Inc. (9) | ||
| 4.1 | Note Purchase Agreement, dated November 9, 2012, between ServisFirst Bancshares, Inc. and certain accredited investors (10) | ||
| 4.11 | Form of 5.50% Subordinated Note due November 9, 2022 (10) |
| 101 |
| 10.1 | 2005 Amended and Restated Stock Incentive Plan (1)* | ||
| 10.2 | Change in Control Agreement with William M. Foshee date May 20, 2005 (1)* | ||
| 10.3 | Change in Control Agreement with Clarence C. Pouncey III date June 6, 2006 (1)* | ||
| 10.4 | Employment Agreement of Andrew N. Kattos dated April 27, 2006 (1)* | ||
| 10.5 | Employment Agreement of G. Carlton Barker dated February 1, 2007 (1)* | ||
| 10.6 | 2009 Stock Incentive Plan (5)* | ||
| 11 | Statement Regarding Computation of Earnings Per Share is included herein at Note 20 to the Consolidated Financial Statements in Item 8. | ||
| 14 | Code of Ethics for Principal Financial Officers (6) | ||
| 21 | List of Subsidiaries | ||
| 23.1 | Consent of KPMG LLP | ||
| 23.2 | Consent of Mauldin & Jenkins | ||
| 24 | Power of Attorney | ||
| 31.1 | Certification of Chief Executive Officer pursuant to Rule 13a-14(a) | ||
| 31.2 | Certification of Chief Financial Officer pursuant to Rule 13a-14(a) | ||
| 32.1 | Certification of Chief Executive Officer pursuant to 18 U.S.C. Section 1350 | ||
| 32.2 | Certification of Chief Financial Officer pursuant to 18 U.S.C. Section 1350 | ||
| 101.INS | XBRL Instance Document | ||
| 101.SCH | XBRL Schema Documents | ||
| 101.CAL | XBRL Calculation Linkbase Document | ||
| 101.LAB | XBRL Label Linkbase Document | ||
| 101.PRE | XBRL Presentation Linkbase Document | ||
| 101.DEF | XBRL Definition Linkbase Document |
(1) Previously filed as an exhibit to ServisFirst Bancshares, Inc.'s Registration Statement on Form 10, as filed with the Securities and Exchange Commission on March 28, 2008, and incorporated herein by reference.
(2) Previously filed as Exhibit 3.01 of ServisFirst Bancshares, Inc.'s Quarterly Report on Form 10-Q for the quarter ended September 30, 2012, and incorporated herein by reference.
(3) Previously filed as an exhibit to ServisFirst Bancshares, Inc.'s Current Report on Form 8-K dated September 15, 2008, and incorporated herein by reference.
(4) Previously filed as an exhibit to ServisFirst Bancshares, Inc.'s Current Report on Form 8-K dated September 2, 2008, and incorporated herein by reference.
(5) Previously filed as an exhibit to ServisFirst Bancshares, Inc.'s Definitive Proxy Statement on Schedule 14A relating to the 2009 Annual Meeting of Stockholders and incorporated herein by reference.
(6) Previously filed as an exhibit to ServisFirst Bancshares, Inc.'s Annual Report on Form 10-K for the year ended December 31, 2008, and incorporated herein by reference.
| 102 |
(7) Previously filed as an exhibit to ServisFirst Bancshares, Inc.'s Annual Report on Form 10-K for the year ended December 31, 2009, and incorporated herein by reference.
(8) Previously filed as an exhibit to ServisFirst Bancshares, Inc.'s Current Report on Form 8-K dated March 15, 2010, and incorporated herein by reference.
(9) Previously filed as an exhibit to ServisFirst Bancshares, Inc.'s Current Report on Form 8-K dated June 21, 2011, and incorporated herein by reference.
(10) Previously filed as an exhibit to ServisFirst Bancshares, Inc.'s Current Report on Form 8-K dated November 8, 2012, and incorporated herein by reference.
* Management contract or compensatory plan arrangements.
SIGNATURES
Pursuant to the requirements of Section 13 or 15(d) of the Securities Exchange Act of 1934, the Registrant has duly caused this report to be signed on its behalf by the undersigned, thereunto duly authorized.
| SERVISFIRST BANCSHARES, INC. | ||
| By: | /s/Thomas A. Broughton, III | |
| Thomas A. Broughton, III | ||
President and Chief Executive Officer | ||
Dated: March 12, 2013
Pursuant to the requirements of the Securities Exchange Act of 1934, this report has been signed below by the following persons on behalf of the Registrant and in the capacities and on the date indicated.
| Signature | Title | Date | |
| /s/Thomas A. Broughton, III | President, Chief Executive | March 12, 2013 | |
| Thomas A. Broughton, III | Officer and Director (Principal | ||
| Executive Officer) | |||
| /s/ William M. Foshee | Executive Vice President | March 12, 2013 | |
| William M. Foshee | and Chief Financial Officer
|
||
| (Principal Financial Officer and | |||
| Principal Accounting Officer) | |||
| * | Chairman of the Board | March 12, 2013 | |
| Stanley M. Brock | |||
| * | Director | March 12, 2013 | |
| Michael D. Fuller | |||
| * | Director | March 12, 2013 | |
| James J. Filler | |||
| * | Director | March 12, 2013 | |
| Joseph R. Cashio | |||
| * | Director | March 12, 2013 | |
| Hatton C. V. Smith |
________________
*The undersigned, acting pursuant to a Power of Attorney, has signed this Annual Report on Form 10-K for and on behalf of the persons indicated above as such persons’ true and lawful attorney-in-fact and in their names, places and stated, in the capacities indicated above and on the date indicated below.
| 103 |
| /s/ William M. Foshee | |||
| William M. Foshee | |||
| Attorney-in-Fact | |||
| March 12, 2013 |
EXHIBIT INDEX
(b) The following exhibits are furnished with this Annual Report on Form 10-K
| EXHIBIT NO. | NAME OF EXHIBIT | ||
| 21 | List of Subsidiaries | ||
| 23.1 | Consent of KPMG LLP | ||
| 23.2 | Consent of Mauldin & Jenkins | ||
| 24 | Power of Attorney | ||
| 31.1 | Certification of Chief Executive Officer pursuant to Rule 13a-14(a) | ||
| 31.2 | Certification of Chief Financial Officer pursuant to Rule 13a-14(a) | ||
| 32.1 | Certification of Chief Executive Officer pursuant to 18 U.S.C. Section 1350 | ||
| 32.2 | Certification of Chief Financial Officer pursuant to 18 U.S.C. Section 1350 | ||
| 101.INS | XBRL Instance Document | ||
| 101.SCH | XBRL Schema Documents | ||
| 101.CAL | XBRL Calculation Linkbase Document | ||
| 101.LAB | XBRL Label Linkbase Document | ||
| 101.PRE | XBRL Presentation Linkbase Document | ||
| 101.DEF | XBRL Definition Linkbase Document |
| 104 |